Improve Construction Safety with Mobile Tech and Data Analytics
•
1 recomendación•2,693 vistas

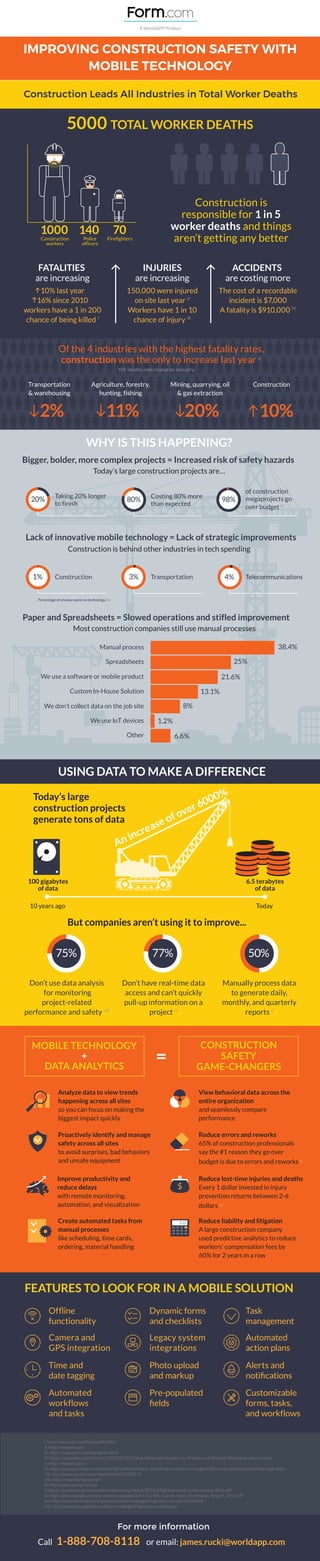
Out of the 5000 workers who die on-the-job each year, construction leads all industries in total worker deaths . And from the looks of things, there doesn’t seem to be a light at the end of the tunnel. In fact, of the 4 industries with the highest fatality rates, construction is the only one where things are actually getting worse, with a 10% fatality increase YoY. Still, today’s construction projects are getting bigger and bolder. More risks are being taken, more hazards are popping up, and more people are getting hurt, sick, and even dying. So why is this happening?
Recomendados

Recomendados
Más contenido relacionado
Similar a Improve Construction Safety with Mobile Tech and Data Analytics
Similar a Improve Construction Safety with Mobile Tech and Data Analytics (20)
Último
Último (20)
Improve Construction Safety with Mobile Tech and Data Analytics
- 1. A WorldAPP Product IMPROVING CONSTRUCTION SAFETY WITH MOBILE TECHNOLOGY Construction Leads All Industries in Total Worker Deaths 5000 TOTAL WORKER DEATHS Construction workers Police officers 140 Firefighters 70 Construction is responsible for 1 in 5 worker deaths and things aren’t getting any better Of the 4 industries with the highest fatality rates, construction was the only to increase last year V FATALITIES are increasing INJURIES are increasing ACCIDENTS are costing more 10% last year 16% since 2010 workers have a 1 in 200 chance of being killed I 150,000 were injured on site last year II Workers have 1 in 10 chance of injury III The cost of a recordable incident is $7,000 A fatality is $910,000 IV YoY fatality rate change by industry Transportation & warehousing Agriculture, forestry, hunting, fishing Mining, quarrying, oil & gas extraction Construction 2% 11% 20% 10% WHY IS THIS HAPPENING? Bigger, bolder, more complex projects = Increased risk of safety hazards Lack of innovative mobile technology = Lack of strategic improvements Paper and Spreadsheets = Slowed operations and stifled improvement Today’s large construction projects are… Construction is behind other industries in tech spending Taking 20% longer to finish 20% Costing 80% more than expected of construction megaprojects go over budget VI 80% 98% Construction1% Transportation3% Telecommunications4% Most construction companies still use manual processes Manual process Spreadsheets Custom In-House Solution We don’t collect data on the job site We use loT devices Other We use a software or mobile product 38.4% 25% 21.6% 13.1% 8% 1.2% 6.6% 10 years ago 100 gigabytes of data 6.5 terabytes of data Today But companies aren’t using it to improve... Don’t use data analysis for monitoring project-related performance and safety viii Don’t have real-time data access and can’t quickly pull-up information on a project ix Manually process data to generate daily, monthly, and quarterly reports x 75% 77% 50% $ FEATURES TO LOOK FOR IN A MOBILE SOLUTION Analyze data to view trends happening across all sites so you can focus on making the biggest impact quickly Proactively identify and manage safety across all sites to avoid surprises, bad behaviors and unsafe equipment Improve productivity and reduce delays with remote monitoring, automation, and visualization Create automated tasks from manual processes like scheduling, time cards, ordering, material handling View behavioral data across the entire organization and seamlessly compare performance Reduce errors and reworks 65% of construction professionals say the #1 reason they go over budget is due to errors and reworks XI Reduce lost-time injuries and deaths Every 1 dollar invested in injury prevention returns between 2-6 dollars XII Reduce liability and litigation A large construction company used predictive analytics to reduce workers' compensation fees by 60% for 2 years in a row Offline functionality Time and date tagging Dynamic forms and checklists Photo upload and markup Pre-populated fields Task management Alerts and notifications Automated action plans Camera and GPS integration Automated workflows and tasks Legacy system integrations Customizable forms, tasks, and workflows I. http://www.ishn.com/keywords/osha II. http://www.bls.gov/ III. http://www.ishn.com/keywords/osha IV. https://ohsonline.com/Articles/2012/07/01/Using-Advanced-Analytics-to-Predict-and-Prevent-Workplace-Injuries.aspx V. http://www.bls.gov/ VI. http://www.mckinsey.com/industries/capital-projects-and-infrastructure/our-insights/the-construction-productivity-imperative VII. http://www.gartner.com/newsroom/id/2200815 VIII. http://www.kpmg.com/gcs IX. http://www.kpmg.com/gcs X. https://assets.kpmg.com/content/dam/kpmg/xx/pdf/2016/09/global-construction-survey-2016.pdf XI. http://jbknowledge.com/wp-content/uploads/2016/12/JBK_Construction_Technology_Report_2016.pdf XII. http://www.oncenter.com/products/oasis/landpage/infographic-survey-2015.html XIII. http://www.nsc.org/learn/safety-knowledge/Pages/injury-facts.aspx or email: james.rucki@worldapp.com For more information Call 1-888-708-8118 An increase of over 6000%Today’s large construction projects generate tons of data 1000 Percentage of revenue spent on technology VII CONSTRUCTION SAFETY GAME-CHANGERS MOBILE TECHNOLOGY + DATA ANALYTICS = USING DATA TO MAKE A DIFFERENCE