Burke workshop doing financial projections
•Descargar como DOC, PDF•
1 recomendación•472 vistas


Recomendados
Recomendados
Más contenido relacionado
La actualidad más candente
La actualidad más candente (19)
Similar a Burke workshop doing financial projections
Similar a Burke workshop doing financial projections (20)
Último
Último (20)
Burke workshop doing financial projections
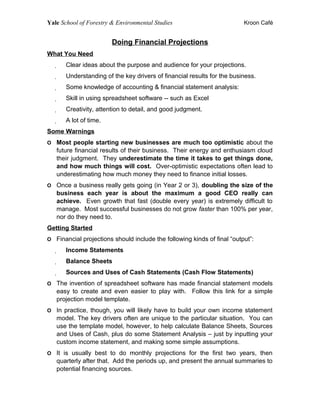
- 1. Yale School of Forestry & Environmental Studies Kroon Café Doing Financial Projections What You Need Clear ideas about the purpose and audience for your projections. Understanding of the key drivers of financial results for the business. Some knowledge of accounting & financial statement analysis: Skill in using spreadsheet software -- such as Excel Creativity, attention to detail, and good judgment. A lot of time. Some Warnings O Most people starting new businesses are much too optimistic about the future financial results of their business. Their energy and enthusiasm cloud their judgment. They underestimate the time it takes to get things done, and how much things will cost. Over-optimistic expectations often lead to underestimating how much money they need to finance initial losses. O Once a business really gets going (in Year 2 or 3), doubling the size of the business each year is about the maximum a good CEO really can achieve. Even growth that fast (double every year) is extremely difficult to manage. Most successful businesses do not grow faster than 100% per year, nor do they need to. Getting Started O Financial projections should include the following kinds of final “output”: Income Statements Balance Sheets Sources and Uses of Cash Statements (Cash Flow Statements) O The invention of spreadsheet software has made financial statement models easy to create and even easier to play with. Follow this link for a simple projection model template. O In practice, though, you will likely have to build your own income statement model. The key drivers often are unique to the particular situation. You can use the template model, however, to help calculate Balance Sheets, Sources and Uses of Cash, plus do some Statement Analysis – just by inputting your custom income statement, and making some simple assumptions. O It is usually best to do monthly projections for the first two years, then quarterly after that. Add the periods up, and present the annual summaries to potential financing sources.
- 2. Yale School of Forestry & Environmental Studies Kroon Café Income Statements: Monthly Projections Month 1 Month 2 Month 3 Month 4 Month 5 Month 6 Revenues Cost of Goods Sold Gross Profit Sales & Marketing Expense General & Admin Expense Operating Income Depreciation Expense Interest Expense Taxes Net Income (Loss) Key points: o Revenues & expenses are independent of cash payments. Recognize them when a transaction happens, not when cash comes in or goes out (maybe much later). o Cost of Goods Sold are the direct costs in producing your service – materials, installation costs, customer service, maintenance, etc. o Revenue – Costs of Goods Sold = Gross Profit o General & Administrative are support costs, like finance, HR, IT, top management o Gross Profit – Sales & Marketing – General & Admin = Operating Income, also known as Operating Cash Flow o Following these conventions allows for comparison of your projections with other similar business’ results. o Depreciation expense spreads out the cost of property, plant and equipment – over its useful life. o R&D costs? Making Assumptions O Start with the monthly numbers for Year 1. For any business raising money, making your numbers in your first year of projections is really important. If you, as management, miss these numbers you may: 1. Run out of money too soon,
- 3. Yale School of Forestry & Environmental Studies Kroon Café 2. Get fired and/or 3. Not be able to raise more money. If 1) or 3) happens, you will probably go bust. O Consider the macroeconomic situation when building your projections: Overall economic growth rate of GDP during projection period Economic recession(s) - timing, duration Rate of inflation Level of interest rates O Tackle the Income Statement first. Project your number of customers based on the key revenue driver. Project monthly sales – for twelve months.... Monthly Projections Month 1 Month 2 Month 3 Month 4 Month 5 Month 6 Customers 0 0 11 20 45 77 Revenues 0 0 3 6 13 26 o Next, think through the 12 months of costs associated with these sales: Cost of Goods Sold – materials, installation costs, inspection, maintenance, regulatory costs, billing system Selling costs – sales people, advertising, travel, web site Administrative Costs – Management, office space, supplies, utilities, insurance o Points to remember: You may not have any revenues for the first few months – as you build the system, sign up customers, etc. – but you will still have expenses. Model this. Don’t forget to figure in one-time start-up costs (incorporate, write a business plan, licensing, permitting fees, getting regulatory approval, etc.) If you have more than one product or service, model them separately, then total them. Be sure to model total headcount and include cost of benefits (20-25% of salary, typically). You should allocate personnel costs into Cost of Goods Sold, Marketing & Sales and General & Administrative, based on function. Rental space can be: (Headcount x Avg. Sq. Ft. Per Person x $ Cost Per Sq. Ft.)
- 4. Yale School of Forestry & Environmental Studies Kroon Café o Your projections might look something like this: Monthly Projections Month 1 Month 2 Month 3 Month 4 Month 5 Month 6 Revenues 0 0 3 6 13 26 Cost of Goods Sold 0 0 1 3 6 13 Gross Profit 0 0 2 3 7 13 Sales & Marketing Expense 4 5 7 9 11 12 General & Admin Expense 4 7 9 11 13 16 Operating Income -8 -12 -14 -17 -17 -15 Depreciation Expense 1 1 1 1 1 1 Interest Expense 1 1 1 1 2 2 Taxes 0 0 0 0 0 0 Net Income (Loss) -10 -14 -16 -19 -20 -18 o Then, add up your 12 months of projections. Annual Projections Year 1 Year 2 Year 3 Year 4 Year 5 Sales 150 Cost of Goods Sold 77 Gross Profit 61 Sales & Marketing 102 General & Admin 140 Operating Income (181) Operating income is an estimate of how much money will need to raise – on top of the cost of any property and equipment you must buy. Does this number make sense? Are you losing enough money (have you remembered all your costs)? Are you losing more money than you can raise? o Building out future years, two approaches: Continue estimating growth of customers from month to month, quarter to quarter. Or Pick a break-even year – the year your operating income exceeds costs and you don’t need outside financing to survive. Take this approach if there is a year by which you must break even. If, say, banks or investors require that you reach break even by year three, figure out: What would this take – in sales? Annual Projections Year 1 Year 2 Year 3 Year 4 Year 5
- 5. Yale School of Forestry & Environmental Studies Kroon Café Sales 150 800 Cost of Goods Sold 77 350 Gross Profit 73 450 Sales & Marketing 102 195 General & Admin 140 210 Operating Income (169) 45 Figuring out what your break-even year looks like, and when it will occur, probably is the single most important part of making a good set of projections. With either approach, remember to increase costs with sales. A common mistake, for example, is to forget to add personnel as the business grows. And, as personnel increases, so may rent, supplies, utilities, insurance, etc. O Compare your Income Statement numbers to similar companies to figure out if your break-even, and projections in general, are reasonable, Calculate profit and cost margins by dividing all categories by sales: Annual Projections Year 3 As a % of Sales Sales 800 100% Cost of Goods Sold 350 44% Gross Profit 450 56% Sales & Marketing 195 24% General & Admin 210 26% Operating Income 45 6% Look especially at the gross and operating profit margins, and at the categories of costs. At this stage of your business, your profit margins should not be higher than similar operations – nor your cost margins lower. Does your business differ in key respects? If so, can you explain why? If not, you are probably being to optimistic. If your projections look reasonable, smooth in the year(s) between Year One and your projected break even year. Project out past your break-even year. Do not grow faster than people will believe. Consider a 50% annual growth rate in revenues, as a first cut. Remember to increase costs as you grow. O Next, Some Assets
- 6. Yale School of Forestry & Environmental Studies Kroon Café Transfer the Income Statement totals to the model template, or construct your own Balance Sheet and Sources & Uses model. Typical key items: Category Numbers Expressed As: Examples: Cash in Banks % of Sales 3% of Sales Acounts Receivable % of Sales Sales x 1/6 (60 Day Turnover) Inventory % of Cost of Goods Sold Cost of Goods Sold x 10% Fixed Assets Formula 1 Yr. = Last Yr. + CapEx - Deprec. Other Assets % Sales 2 1% of Sales Accounts Payable % of Costs of Goods Sold Cost of Goods Sold x 1/6 Accrued Expenses % of S&M + G&A Expense S&M + G&A Expense x 1/12 Other reasonable links or relationships are possible. You want the balance sheet to grow in line with the growth of the business. Balance sheets use cash, too. One also needs to project the Capital Expenditures (Property, Plant, Equipment purchases) and some Depreciation Expense. Include replacement costs for failed as well as worn out equipment. Set Depreciation Expense as a percentage of Net Fixed Assets as of the end of the previous year. The template assumes an average rate of 10 years. The template model will use this information to complete a “Sources and Uses of Cash” Statement and generate a large number in the “Necessary to Balance” line of the Balance Sheet. Necessary to Balance is not an accounting category. Instead, for each Year, “Necessary to Balance” represents the amount of financing that you need. You must assume that you will sell equity or borrow debt, or some combination -- equal to the amount of “Necessary to Balance.” For example, in the template attached, the business needs to raise $900,000 to finance the first year of operations. If Necessary to Balance shows extra cash (versus a need for financing), you can pay this out in dividends to your investors – or add it to your cash account cell. The second is probably more realistic in the case of a new business. 1 Net Fixed Assets from last year, plus Capital Expenditures minus Depreciation, this year. 2 Other Assets might include prepaid insurance or rent, intangible assets, etc.
- 7. Yale School of Forestry & Environmental Studies Kroon Café Transfer the Income Statement totals to the model template, or construct your own Balance Sheet and Sources & Uses model. Typical key items: Category Numbers Expressed As: Examples: Cash in Banks % of Sales 3% of Sales Acounts Receivable % of Sales Sales x 1/6 (60 Day Turnover) Inventory % of Cost of Goods Sold Cost of Goods Sold x 10% Fixed Assets Formula 1 Yr. = Last Yr. + CapEx - Deprec. Other Assets % Sales 2 1% of Sales Accounts Payable % of Costs of Goods Sold Cost of Goods Sold x 1/6 Accrued Expenses % of S&M + G&A Expense S&M + G&A Expense x 1/12 Other reasonable links or relationships are possible. You want the balance sheet to grow in line with the growth of the business. Balance sheets use cash, too. One also needs to project the Capital Expenditures (Property, Plant, Equipment purchases) and some Depreciation Expense. Include replacement costs for failed as well as worn out equipment. Set Depreciation Expense as a percentage of Net Fixed Assets as of the end of the previous year. The template assumes an average rate of 10 years. The template model will use this information to complete a “Sources and Uses of Cash” Statement and generate a large number in the “Necessary to Balance” line of the Balance Sheet. Necessary to Balance is not an accounting category. Instead, for each Year, “Necessary to Balance” represents the amount of financing that you need. You must assume that you will sell equity or borrow debt, or some combination -- equal to the amount of “Necessary to Balance.” For example, in the template attached, the business needs to raise $900,000 to finance the first year of operations. If Necessary to Balance shows extra cash (versus a need for financing), you can pay this out in dividends to your investors – or add it to your cash account cell. The second is probably more realistic in the case of a new business. 1 Net Fixed Assets from last year, plus Capital Expenditures minus Depreciation, this year. 2 Other Assets might include prepaid insurance or rent, intangible assets, etc.