SlideShare una empresa de Scribd logo
1 de 8
Descargar para leer sin conexión
Published online 4 July 2008 Nucleic Acids Research, 2008, Vol. 36, No. 14 e91
doi:10.1093/nar/gkn408
A new method for robust quantitative and
qualitative analysis of real-time PCR
Eric B. Shain* and John M. Clemens
Abbott Molecular Inc., 1300 E. Touhy Avenue, Des Plaines, IL 60018, USA
Received February 25, 2008; Revised June 3, 2008; Accepted June 10, 2008
ABSTRACT
An automated data analysis method for real-time
PCR needs to exhibit robustness to the factors
that routinely impact the measurement and analysis
of real-time PCR data. Robust analysis is paramount
to providing the same interpretation for results
regardless of the skill of the operator performing
or reviewing the work. We present a new method
for analysis of real-time PCR data, the maxRatio
method, which identifies a consistent point within
or very near the exponential region of the PCR
signal without requiring user intervention. Com-
pared to other analytical techniques that generate
only a cycle number, maxRatio generates several
measurements of amplification including cycle num-
bers and relative measures of amplification effi-
ciency and curve shape. By using these values, the
maxRatio method can make highly reliable reactive/
nonreactive determination along with quantitative
evaluation. Application of the maxRatio method to
the analysis of quantitative and qualitative real-time
PCR assays is shown along with examples of
method robustness to, and detection of, amplifica-
tion response anomalies.
INTRODUCTION
Real-time PCR has become a widely used methodology
for both qualitative and quantitative determination of
molecular targets. The power of real-time PCR is that
the fluorescence response observed is a direct measure of
the dynamics of the amplification reaction process. The
real-time PCR curve is a fluorescence response with a
roughly sigmoidal shape that correlates to the growth of
amplified product during the PCR amplification process.
The shape of the PCR amplification curve reflects the
dynamics of the PCR reaction for an individual sample
that is controlled by the assay design, which includes reac-
tive components (primer and probe designs and concen-
trations, concentrations of enzymes, activators, buffers,
dNTPs, etc.) and cycling conditions for the reaction.
Current analytical methods primarily concentrate on
quantitative responses that involve cycle number determi-
nation. These approaches provide a quantitative assess-
ment by focusing on one portion of the amplification
growth curve, namely the region of observed exponential
growth. The cycle threshold (Ct) method (1) determines a
cycle number based on the point where the fluorescence
response grows above the background level to cross a
predetermined fluorescence threshold value. The critical
steps involved in Ct determination include defining the
baseline, establishing a suitable threshold for quantifica-
tion of the target and using either an external calibration
curve or an internal quantitation standard (2) for quanti-
tation. The Ct method is an excellent method for provid-
ing quantitative PCR analysis because of the consistency
in signal intensity during the exponential growth phase of
the PCR. However, it is susceptible to baselining error
when challenged with signal anomalies such as spectral
crosstalk or transients due to bubbles in the reaction or
noise. For example, to generate a Ct value within the
exponential growth region of the PCR curve, a low thresh-
old may be required. With a low threshold, there is a
potential for a threshold crossing due to an anomalous
signal, e.g. spectral crosstalk rather than true amplifica-
tion. It is difficult to discriminate between a Ct value
caused by a false threshold crossing and one generated
by a valid reactive response. In such cases, analysis can
require some measure of interpretation on the part of the
data reviewer to assess whether a particular response is
truly an amplification or not. In addition, it is difficult
to determine the true Ct value in the presence of such
signal anomalies. Even small errors in the baselining pro-
cess can cause negative reactions to cross the threshold or
reactive signals to cross early or late. An alternate method
for determination of cycle numbers is the use of derivative
methods, such as the second derivative maximum method
(3), which do not require baselining. Both Ct and deriva-
tive methods provide a cycle number response for the PCR
reaction, but do not provide any means for assessing the
efficiency of the individual reaction or suitability of the
PCR curve for quantitative analysis.
We present here a new method for analysis of real-time
PCR data, the maxRatio method, which identifies a
*To whom correspondence should be addressed. Tel: +1 224 361 7251; Fax: +1 224 361 7505; Email: eric.shain@abbott.com
ß 2008 The Author(s)
This is an Open Access article distributed under the terms of the Creative Commons Attribution Non-Commercial License (http://creativecommons.org/licenses/
by-nc/2.0/uk/) which permits unrestricted non-commercial use, distribution, and reproduction in any medium, provided the original work is properly cited.
consistent point within or very near the exponential region
of the PCR signal without requiring user intervention.
Compared to other analysis techniques that generate
only a cycle number, maxRatio generates several measure-
ments of amplification including cycle numbers and rela-
tive measures of amplification efficiency and curve shape.
By using these values, the maxRatio method can achieve
highly reliable reactive/nonreactive determination along
with quantitative evaluation.
MATERIALS AND METHODS
maxRatio method description
The maxRatio method takes a PCR amplification signal
and calculates a ratio at each cycle using Equation (1).
Ration ¼
Signaln
SignalnÀ1
À 1 1
where Signaln is the measured real-time PCR fluorescence
response for the target of interest at cycle n. Because
Equation (1) has the signal in the numerator and denomi-
nator, the ratio is a self-normalizing, dimensionless
expression. The effect of normalization by a nearly con-
stant reference signal divides out and either raw or nor-
malized fluorescence may be used. This self normalizing
characteristic also provides the ratio transformation with
an inherent insensitivity to variability in signal intensity
such as might occur from well-to-well within an instru-
ment or between instruments.
The ratio calculation transforms the roughly sigmoidal
shaped amplification curve to a ratio curve with a well-
defined peak. Figure 1 illustrates this transformation. The
ratio curve exhibits several well-defined features.
The maximum value of the ratio curve defines two
values. The magnitude of the ratio curve at the maximum
is defined as the MR (maxRatio) value. The cycle number
at which the maximum occurs is defined as the FCN value
or fractional cycle number. The ratio curve is based on a
cycle-by-cycle ratio of signal intensities, which differs from
the first or second derivative maximum methods (3) as the
derivative calculation is a difference measurement. The
FCN value generated by the maxRatio method is conse-
quently not the same value as the cycle number generated
by either derivative method. The ratio curve has a char-
acteristic width, measured as the half width at half max-
imum, referred to as the width parameter.
The ratio curve is a relative measure of the fluorescence
signal growth throughout the PCR reaction. The early
cycle ratio curve near zero represents the baseline region
of the PCR curve and the late cycle region corresponds to
the plateau phase. The ascending part of the ratio curve
corresponds to the exponential growth phase; the descend-
ing part of the ratio curve is the transition from the expo-
nential to the plateau phase in the PCR curve.
Nonreactive responses have ratio curves that are nearly
flat with an MR value near zero. A ratio threshold can
be established, which separates reactive versus nonreactive
responses based on MR values.
The signal value, Signaln, in the ratio Equation (1)
includes the PCR signal intensity and the inherent back-
ground fluorescence level. As such, MR values are a rela-
tive measure of reaction efficiency. The magnitude of the
MR value even for a perfectly efficient reaction is always
less than one because of the inherent level of background
fluorescence incorporated in the ratio equation. By includ-
ing the background fluorescence in the ratio equation, the
resulting ratio curve avoids the problem of division by
zero and is highly insensitive to even moderate baseline
slope variation. Different probe designs and dye/quencher
combinations can exhibit different levels of quenching. An
assay with higher background fluorescence will typically
have lower MR values.
Many efforts have been made to estimate absolute PCR
reaction efficiency from individual responses (4–7).
Although an absolute measurement of reaction efficiency
would be ideal, it has been reported that even nominal
variations in baseline determination can make calculation
of absolute amplification efficiency from individual
responses unreliable. Calculating initial starting concen-
tration using such an absolute efficiency measure is diffi-
cult. In any case, all such methods rely on precise removal
of background fluorescence level and slope, and generally
require curve fitting functions to relatively few points.
It should be noted that the relative efficiency measure
MR value generated by the maxRatio method is not
used to directly estimate reaction efficiency or to calculate
initial sample concentration. Instead, MR is used to deter-
mine if a response is reactive or nonreactive and for reac-
tive responses if it is a normal amplification for that assay.
It has been found that for some assays, low target
amplification curves exhibit suppressed signal levels, for
example due to competition with nonspecific amplification
products. As a result, the exponential growth portion of
the amplification curve is reduced. This causes the ratio
peak and therefore the FCN value to shift slightly earlier.
The result is a slight overquantitation for low copy sam-
ples. At the same time, these suppressed signals exhibit
reduced MR responses. We can take advantage of this
0 5 10 15 20 25 30 35 40
0
5
10
15
20
Fluorescence
0 5 10 15 20 25 30 35 40
0
5
10
15
20
Fluorescence
0
0.1
0.2
0.3
0.4
Cycle
Ratio
0
0.1
0.2
0.3
0.4
Cycle
Ratio
FCNRatio Curve
Ratio Curve
MR
FCN
PCR Response
PCR Response
Ratio Threshold
MR/2
Ratio Threshold
Width
A
B
Figure 1. MR, FCN and width definition. (A) PCR response and ratio
curve for a positive reaction with definition of MR, FCN and width.
(B) PCR response and ratio curve for a negative reaction.
e91 Nucleic Acids Research, 2008, Vol. 36, No. 14 PAGE 2 OF 7
correlated behavior between the FCN and MR response
values for these samples to create an adjusted FCN value
(FCNA) that uses the MR value to compensate for the
earlier FCN determination. The FCNA is defined in
Equation (2).
FCNA ¼ FCN À Log2ðMRÞ 2
Use of FCNA may provide more linear quantitation to
the lowest detectable responses for some assays.
Ratio threshold use
The ratio threshold is used to separate populations of
responses based on relative reaction efficiency (MR)
values. Setting of the ratio threshold is determined by
characterization of the assay and is determined primarily
by analysis of negatives. One method might be to deter-
mine the mean and SD of the MR values for negative
reactions and then set the ratio threshold to a level of
the mean plus some number of SDs (typically 5 to 10
SD). Other considerations when setting the ratio threshold
include the presence of spectral crosstalk in multiplex
assays and signal anomalies such as initial transients.
Although shown in Figure 1 as a straight line, the ratio
threshold can be set with different levels at different
cycles. The setting of the ratio threshold is determined
during assay development and typically does not need to
be changed even for different instruments or reagent lots.
Unlike the threshold used for Ct analysis, the ratio thresh-
old is only used to determine reactivity of the response. It
has no effect on the FCN value used for quantification of
positive reactions.
More than one ratio threshold can be established. While
one ratio threshold can be set on the basis of separating
nonreactive from reactive responses, a second threshold
can be applied based on separating normal reactive
responses from abnormal reactive responses.
Use of response shifting
Because the ratio transformation is inherently self-
compensating for reaction signal intensity, it can be
applied to a reaction’s raw fluorescence signal. When a
reference dye is available, the normalized fluorescence
signal is typically analyzed. It should be noted that the
fluorescence signal naturally has a background level of
unquenched fluorescence. Because of the division in the
ratio transformation, it is necessary to maintain this back-
ground fluorescence level to avoid division by zero. As an
alternative to utilizing the raw or normalized fluorescence
response directly, the response may be shifted to fixed
positive background fluorescence level. The advantage of
this response shifting is to eliminate sensitivity to factors
that can change the level of background fluorescence, such
as variability in probe manufacture or fluorescence con-
tamination in the thermal cycler block. The disadvantage
of shifting the response is that it removes the inherent
insensitivity to signal intensity and can introduce some
instrument-to-instrument variability. For this reason, if
response shifting is implemented, using a shift value near
the natural level of background fluorescence is recom-
mended. It should be noted that shifting will directly
affect the magnitude of the MR value. Shifting to a low
value will increase both the MR value of positive reactions
as well as the mean and SD of the MR for negative reac-
tions. In terms of statistical separation of populations, this
rarely makes significant difference. Shifting to a low level
can also reduce robustness to spectral crosstalk, initial
signal transients and other anomalies in the baseline por-
tion of the amplification response. It is important there-
fore when developing the assay, to focus on statistical
separation of reactive from nonreactive populations by
MR, not on maximizing the MR value.
Method implementation
The maxRatio method has been implemented as part of
the Abbott m2000TM
system. The m2000 system consists
of two instruments: the Abbott m2000sp and the m2000rt.
The m2000sp automates the extraction, purification and
preparation of DNA and RNA from patient samples. The
m2000rt real-time PCR instrument amplifies and detects
real-time PCR assays. Because the m2000 system has an
effective automatic baselining algorithm, baseline slope
correction (but not offset) is applied. Although normal-
ization and baseline slope correction are not required by
the maxRatio method, a small improvement in perfor-
mance may be achieved using them. In addition, the
signal has a smoothing filter applied. It is a feature of
the maxRatio method that a much more aggressive noise
filter can be applied without significantly affecting the
cycle number compared to the Ct method. The m2000rt
instrument implements a fourth order, zero-phase noise
filter. In order to obtain 0.01 cycle resolution, a cubic
spline interpolation is applied to the ratio curve.
Example data sets
The PCR data used to illustrate attributes of the
maxRatio analysis method consist of actual and modified
data derived from Abbott RealTime PCR assays pro-
cessed on the m2000 system. Modified data is used as
noted to demonstrate the performance of different algo-
rithms to anomolous responses that may occur periodi-
cally in the course of normal processing.
RESULTS AND DISCUSSION
Assay quantification using maxRatio
A comparison of quantification using the maxRatio algo-
rithm was made using an Abbott RealTime HIV-1 linear-
ity panel (8). A dilution series of Armored HIV-1 RNA
ranging from 7.44 log10 copies/ml to 1.56 log10 copies/ml
(27.5 million copies/ml to 36 copies/ml) was analyzed.
Three runs were performed with four replicates per run
at each concentration. All 12 replicates were detected for
the highest seven dilutions, while 11 out of 12 replicates
were detected at 36 copies/ml. The maxRatio method was
implemented with response shifting set to 0.7. FCN and
FCNA cycle numbers were used for quantitation by the
maxRatio method.
Figure 2 illustrates HIV-1 normalized FAM (6-carboxy-
fluorescein) fluorescence for one of the runs processed
PAGE 3 OF 7 Nucleic Acids Research, 2008, Vol. 36, No. 14 e91
with the maxRatio algorithm. Plotting the MR versus
FCN values generates the characteristic MR–FCN plot
for this data. The only negative response is from the
negative control, which is identified in the MR versus
FCN plot with an MR value near zero. Since there is no
signal growth in reactions without target, the ratio curve is
nearly equal to zero throughout the amplification process.
The MR value of approximately zero easily distinguishes
the negative response from the reactive samples.
Comparable quantification performance using either
Ct, FCN or FCNA values was observed as shown in
Figure 3. Ct values were generated using m2000rt soft-
ware. This system uses an automatic baselining algorithm,
which determines the optimum background regression
region on an individual responses basis.
Qualititative data analysis
An Abbott RealTime Chlamydia trachomatis/Neisseria
gonorrhoeae (CT/NG) assay (not available in the US)
was used to test 623 patient specimens collected with the
Abbott multi-Collect Specimen Collection Kit. The sam-
ples included male and female urine specimens, male
urethral swab specimens and female endocervical and
vaginal swab specimens. A total of 15 Abbott RealTime
CT/NG runs were performed using three m2000sp and
two m2000rt instruments. The maxRatio method was
implemented without response shifting. Figure 4 shows
the MR–FCN plots for a representative subset of the
data. As can be seen, negative sample MR values are
exceptionally low for C. trachomatis responses. Neisseria
gonorrhoeae negative sample MR values are slightly ele-
vated and have FCN values between 35 and 40 showing
the effect of modest spectral crosstalk from the internal
control responses.
Detection of suppressed amplification
The MR value consistently identifies efficient from ineffi-
cient amplifications even in the presence of factors such as
baseline anomalies. As discussed earlier, multiple ratio
thresholds can be established to partition responses into
categories such as nonreactive, normally reactive and
abnormally reactive. Figure 5 demonstrates this approach
using a RealTime HIV-1 example. A single well (C1) from
this run had a suppressed amplification. The signal in this
well starts rising above background as early as cycle 12,
0 5 10 15 20 25 30 35 40
0
5
10
15
20
Cycle
NormalizedFAM
0 5 10 15 20 25 30 35 40
0
0.1
0.2
0.3
0.4
Cycle
Ratio
0 5 10 15 20 25 30 35 40
0
0.1
0.2
0.3
0.4
FCN
MR
A
B
C
Ratio Threshold
Figure 2. Analysis by maxRatio of RealTime HIV-1 assay amplification
plots. HIV-1 RNA ranging from 7.44 log10 copies/ml to 1.56 log10
copies/ml were tested in replicates of four using the m2000sp and
m2000rt instruments. (A) Amplification plots of the HIV-1 normalized
FAM fluorescence versus cycle number. (B) Corresponding plots after
applying the ratio transformation. (C) Plot of MR versus FCN values
derived from the peaks of the ratio responses.
0 1 2 3 4 5 6 7 8
0
2
4
6
8
ConcentrationbyCt
(Log10copies/ml)
y = 0.9243*x + 0.3003
R2
= 0.9977, N = 95
0 1 2 3 4 5 6 7 8
0
2
4
6
8
ConcentrationbyFCN
(Log10copies/ml)
y = 0.9598*x + 0.2231
R2 = 0.9982, N = 95
0 1 2 3 4 5 6 7 8
0
2
4
6
8
Assigned Concentration (Log10 copies/ml)
ConcentrationbyFCNA
(Log10copies/ml)
y = 0.9694*x + 0.1814
R2
= 0.9979, N = 95
A
C
B
Figure 3. Analysis by maxRatio of a RealTime HIV-1 linearity panel.
HIV-1 RNA ranging from 7.44 log10 copies/ml to 1.56 log10 copies/ml
were tested using the m2000sp and m2000rt instruments. (A) Observed
versus assigned concentration calculated using Ct values. (B) Observed
versus assigned concentration calculated using FCN values.
(C) Observed versus assigned concentration calculated using FCNA
values.
e91 Nucleic Acids Research, 2008, Vol. 36, No. 14 PAGE 4 OF 7
but clearly is not amplifying as strongly as the other reac-
tive samples on the plate. The response for well C1 rises
above the Ct threshold, but the accuracy of quantification
would be in doubt. Final fluorescence level cannot be used
to invalidate this well in that it is comparable to the final
fluorescence from the wells with low viral load samples.
Figure 5C shows the clear partitioning of this abnormal
response from both the nonreactive and normal reactive
responses using two ratio thresholds. This approach
allows the ability to differentiate and invalidate such sup-
pressed amplifications without requiring visual inspection
by the operator. The Kinetic Outlier Detection (KOD)
method presented by Bar et al. (9) presents an approach
to detecting anomalous amplification using an absolute
efficiency estimate. While a very attractive approach, this
method shares the issues common to other methods which
attempt to determine absolute efficiency from individual
responses. In particular, sensitivity to the background sub-
traction process, difficulty of identifying the exponential
region and complexity of implementation.
Primer dimers and other sources of nonspecific amplifi-
cation can have a deleterious effect on assay signal.
Nonspecific products can compete for resources and
thereby interfere with specific amplifications. Alterna-
tively, with SYBR assays, nonspecific amplification
products can be falsely interpreted as positive reactions.
Nonspecific reactions are usually inefficient with corres-
pondingly low MR values. To the extent that nonspecific
products affect the PCR response shape, then maxRatio
should provide tools with which to identify compromised
assay results. Both suppressed amplification and false
positives can be handled using maxRatio analysis with
careful selection of parameters.
Internal control evaluation
Real-time PCR assays commonly include an internal con-
trol. In Abbott RealTime assays, the internal control pro-
vides confirmation of the successful processing of the
sample from sample preparation through amplification.
For the Abbott RealTime HIV-1 assay, PCR amplification
of the internal control (IC) is accomplished with a differ-
ent set of primers than those used to amplify HIV-1. The
IC primers target a sequence of 136 nt that is derived from
the hydroxypyruvate reductase (HPR) gene from the
pumpkin plant. The IC Probe is labeled with VIC dye.
Because the IC is noncompetitive with the target reaction,
the IC MR and cycle number values are expected to be
consistent across all reactions independent of target con-
centration. Standard Ct analysis can only evaluate the
internal control based on cycle number. The maxRatio
analysis method may be used to provide a 2D evaluation
of the internal control. When setting the ratio threshold
0 5 10 15 20 25 30 35 40 45
0
0.05
0.1
0.15
0.2
FCN
CTMR
0 5 10 15 20 25 30 35 40 45
0
0.05
0.1
0.15
0.2
FCN
NGMR
0 5 10 15 20 25 30 35 40 45
0
0.05
0.1
0.15
0.2
0.25
FCN
ICMR
A
B
C
Figure 4. Analysis by maxRatio of RealTime CTNG results.
Representative MR–FCN plots of (A) C. trachomatis responses
(B) N. gonorrhoeae responses and (C) IC responses. Each plot represents
collated responses from three out of the 15 runs. Reactive samples are
denoted with a plus plot symbol and nonreactive with a circle plot symbol.
0
5
10
15
BaselinedFAM
0 5 10 15 20 25 30 35 40
−1
0
1
2
3
BaselinedFAM
0 5 10 15 20 25 30 35 40
0
0.1
0.2
0.3
0.4
0.5
FCN
MR
Normal Reactive
Abnormal Reactive
Nonreactive
A
B
C
Well C1
Well C1
Cycle
0 5 10 15 20 25 30 35 40
Cycle
Figure 5. Detection of suppressed amplification by maxRatio analysis
of RealTime HIV-1 assay amplification plots. Single PCR run contain-
ing 72 samples processed using the m1000 and m2000rt instruments.
(A) Amplification plots of the HIV-1 baselined FAM fluorescence
versus cycle number. (B) Same responses plotted with a narrowed fluor-
escence range to highlight well C1 response. (C) Plot of MR versus
FCN values for the assay responses showing partitioning of samples
into nonreactive, normal reactive and abnormal reactive populations.
PAGE 5 OF 7 Nucleic Acids Research, 2008, Vol. 36, No. 14 e91
for an internal control, the objective is not to distinguish
reactive from nonreactive responses, but rather to distin-
guish normal reactive from unacceptable reactive
responses. Using this 2D analysis, one can potentially dis-
tinguish between concentration and inhibition-related
problems. Figure 6 illustrates this evaluation. The IC
data from the same assay run used for Figure 5 is
shown. As can be seen, the response from well C1 crosses
the threshold at a comparable point to other reactions, but
is significantly suppressed. This is reflected in the lower
plot with a corresponding suppressed MR value. This
response would not be deemed invalid by inspecting
cycle number alone. Also present are several late rising
internal control responses whose MR values are normal,
but cycle numbers are delayed.
Robustness to spectral crosstalk
The broad, overlapping fluorescence spectra of dyes used
in multiplex assays presents a challenge to accurately
determine the contribution of each dye response to the
measured signal. Although dye calibration procedures
are in general very effective, several issues limit the ability
to perfectly calibrate a system. These include variable read
temperatures for different assays, differences in mastermix
components compared to the dye calibration solution,
quencher used and even the probe oligo sequence (10).
As an example of the robustness of the maxRatio
method to spectral crosstalk, the response from a single
well (C6) in the HIV-1 data set shown in Figure 2 was
modified by taking a fraction of the signal from the
FAM response and adding it to the VIC response. This
simulates the effect of spectral crosstalk commonly
observed with multiplex assays. The FAM response in
this reaction represents a typical 6.68 log copies/ml
sample and the VIC response a typical internal control.
From –1.4% to 1.4% of the FAM response was added to
the VIC response in increments of 0.2%. Figure 7 shows
the effect of spectral crosstalk on VIC Ct and FCN values.
From nominal, over the range of spectral crosstalk tested,
Ct values varied from –1.50 to 0.47. From nominal, FCN
values varied only from –0.07 to 0.09 cycles.
Detection of Ct validity
By using both maxRatio and Ct methods simultaneously,
an enhancement to analysis validity can be obtained. As
shown in Figure 3, FCN, FCNA and Ct values closely
correlate to log sample concentration. Because of this
close correlation, they can be used to detect and invalidate
responses with baselining errors. The cycle difference
between the FCN or FCNA value and the Ct value
tends to be nearly constant across the dynamic range for
any particular assay. This cycle difference (FCNA – CT)
can be monitored as a parameter to assess validity of the
cycle number determination.
An example of how this FCNA – CT cycle difference is
used to detect invalid responses is provided in Figure 8.
The figure shows an anomalous assay response from an
Abbott RealTime HCV (11) (not available in the US) run
on the m2000rt with a manually prepared PCR plate. The
response exhibits a discontinuity in the background region
that caused an errant Ct determination. The exact source
of the anomaly is unknown, but it is possibly due to a
bubble in the PCR well or a similar transient event. The
anomaly resulted in the baselining process tilting the
response up causing it to cross the threshold early. To
evaluate the impact of this tilt on the analysis, the
response fluorescence data was manually corrected and
reanalyzed. It should be noted that this manual correction
is not part of the maxRatio analysis algorithm, but only
used here to illustrate the ability to detect incorrect base-
lining. The Ct value of the original response was 24.16 and
0 5 10 15 20 25 30 35 40
−0.5
0
0.5
1
1.5
2
Cycle
dRn
0 5 10 15 20 25 30 35 40
0
0.1
0.2
0.3
0.4
0.5
Ct
MR
A
B
Amplicon Contamination Lack of Recovery
Invalid Response
Inadequate Reaction Efficiency or Inhibition
Well C1
Well C1
Figure 6. IC evaluation by maxRatio. IC MR value versus Ct value
corresponding to HIV-1 responses displayed in Figure 5.
0 5 10 15 20 25 30 35 40
0.5
1
1.5
2
2.5
3
3.5
NormalizedVIC
−1.5 −1 −0.5 0 0.5 1 1.5
−2
−1.5
−1
−0.5
0
0.5
1
CycleNumberChange
Delta Ct
Delta FCN
A
B
% FAM Crosstalk into VIC
Cycle
Figure 7. Spectral crosstalk analysis of an IC response from a 6.86
log10 copy/ml RealTime HIV-1 sample. (A) Amplification plots of the
modified VIC IC reactions. (B) Plot of the difference in Ct and FCN
cycle numbers from an unmodified response shown. Ct values calcu-
lated based on a threshold of 0.3 and FCN values calculated from
normalized VIC responses.
e91 Nucleic Acids Research, 2008, Vol. 36, No. 14 PAGE 6 OF 7
the FCNA value was 35.34. The corrected response Ct
value was 30.48 and the FCNA value was 35.39. The base-
line anomaly caused a 6.32 cycle Ct change with only a
0.05 cycle FCNA change. The cycle difference (FCNA –
Ct) was 11.18 cycles for the uncorrected response and 4.91
cycles for the corrected response. Figure 8C displays the
cycle difference for the 28 positive assay responses from
the same PCR run. As can be seen, well G1 is clearly an
outlier.
CONCLUSION
The maxRatio method for analysis of real-time PCR reac-
tions provides a measure of concentration (FCN or
FCNA) together with a relative measure of reaction effi-
ciency (MR) that are not present in other commonly used
data analysis algorithms. These measures are consistently
determined even in the presence of systematic and nonsys-
tematic errors in amplification signals that can cause
errors in interpretation for other methods. The relative
reaction efficiency measurement by MR values provides
an effective and reliable method for reactive/nonreactive
determinations as well as discrimination of normal versus
inhibited responses. Quantitative evaluation using
maxRatio generated cycle numbers is comparable in
linearity and precision to analysis based on Ct values.
Although examples in this article utilize probes for signal
generation, the method has been successfully applied to
SYBR green assays as well and should work for any ampli-
fication signal that exhibits a roughly sigmoidal shape.
While maxRatio analysis can be used by itself to anal-
yze PCR reactions, it may also be used to complement
traditional Ct analysis. The maxRatio analysis technique
can be used to determine assay reactivity so that Ct anal-
ysis is only applied to reactive signals. In addition, the Ct
value can be compared to the maxRatio FCN or FCNA
value to determine cycle number validity.
In the clinical laboratory setting, the data analysis
method needs to be robust to common sources of variance
which include multiple lots of assay reagents, the variability
of a large instrument population and differences in oper-
ator skill and training. The robustness of the maxRatio
method, along with the validity metrics it generates, pro-
vides the objective analysis necessary for an automated
data analysis method for a clinical real-time PCR system.
ACKNOWLEDGEMENTS
Funding to pay the Open Access publication charges for
this article was provided by Abbott Molecular, Inc.,
Des Plaines, IL.
Conflict of interest statement. None declared.
REFERENCES
1. Heid,C., Stevens,J., Livak,K. and Williams,P. (1996) Real time
quantitative PCR. Genome Res., 6, 986–994.
2. Livak,K. and Schmittgen,T. (2001) Analysis of relative gene
expression data using real-time quantitative PCR and the 2ÀÁÁCT
method. Methods, 25, 402–408.
3. Rasmussen,R. (2001) Quantification on the LightCycler instrument.
In Meuer S., Wittwer,C. and Nakagawara,K. Rapid Cycle
Real-Time PCR: Methods and Applications. Springer Press,
Heidelberg. pp. 21–34.
4. Tichopad,A., Dilger,M., Schwarz,G. and Pfaffl,M. (2003)
Standardized determination of real-time PCR efficiency from a
single reaction set-up. Nucleic Acids Res., 31, e122.
5. Swillens,S., Goffard,J., Marechal,Y., de Kerchove d’Exaerde,A. and
El Housni,H. (2004) Instant evaluation of the absolute initial
number of cDNA copies from a single real-time PCR curve. Nucleic
Acids Res., 32, e56.
6. Ramakers,C., Ruijter,J.M., Lekanne Deprez,R.H. and Moorman,A.
(2003) Assumption-free analysis of quantitative real-time polymer-
ase chain reaction (PCR) data. Neurosci. Lett., 339, 62–66.
7. Peirson,S.N., Butler,J.N. and Foster,R.G. (2003) Experimental
validation of novel and conventional approaches to quantitative
real-time PCR data analysis. Nucleic Acids Res., 31, e73.
8. Tang,N., Huang,S., Salituro,J., Mak,W., Cloherty,G., Johanson,J.,
Yu,H.L., Schneider,G., Robinson,J., Hackett,J.Jr et al. (2007) A
real time HIV-1 viral load assay for automated quantitation of
HIV-1 RNA in genetically diverse group M subtypes A-H, group 0
and group N samples. J. Virol. Methods [Epub ahead of print,
doi:10.1016/j.jviromet.2007.07.003].
9. Bar,T., Stahlberg,A., Muszta,A. and Kubista,M. (2003) Kinetic out-
lier detection (KOD) in real-time PCR. Nucleic Acids Res., 31, e105.
10. Marras,S., Kramer,F. and Tyagi,S. (2002) Efficiencies of fluores-
cence resonance energy transfer and contact-mediated quenching in
oligonucleotide probes. Nucleic Acids Res., 30, e122.
11. Michelin,B., Muller,Z., Stelzl,E., Marth,E. and Kessler,H. (2007)
Evaluation of the Abbott real time HCV assay for quantitative
detection of hepatitis C virus RNA. J. Clin. Virol., 38, 96–100.
2.2
2.4
2.6
2.8
3
3.2
NormalizedFAM
0 5 10 15 20 25 30 35 40
−0.2
0
0.2
0.4
0.6
0.8
BaselinedFAM
0 5 10 15 20 25 30 35 40
2
4
6
8
10
12
Ct
FCNA–Ct
A
B
C
Well G1
Well G1
Well G1
Cycle
0 5 10 15 20 25 30 35 40
Cycle
Figure 8. Baseline anomaly of a RealTime HCV assay response.
(A) Amplification plots of the HCV normalized FAM fluorescence
versus cycle number. Solid line is actual response of well G1. Dashed
line represents the same response with discontinuity removed.
(B) Corresponding plots after Savitsky–Golay smoothing and baselin-
ing. (C) Plot of FCNA – Ct cycle difference versus Ct value for the 28
positive responses in the same PCR run.
PAGE 7 OF 7 Nucleic Acids Research, 2008, Vol. 36, No. 14 e91
Reproduced with permission of the copyright owner. Further reproduction prohibited without permission.

Más contenido relacionado

Similar a Lectura1

real time quantitative pcr
 real time quantitative pcr real time quantitative pcr
real time quantitative pcranasalmosawy1
 
Quantitative and Qualitative analysis of HPLC and GC
Quantitative and Qualitative analysis of HPLC and GCQuantitative and Qualitative analysis of HPLC and GC
Quantitative and Qualitative analysis of HPLC and GCDr. Nimra Khan
 
Overview of the glossary related to pcr
Overview of the glossary related to pcrOverview of the glossary related to pcr
Overview of the glossary related to pcrMohammadAtif41
 
Real time pcr
Real time pcrReal time pcr
Real time pcrali h
 
Q pcr symposium2007-pcrarray
Q pcr symposium2007-pcrarrayQ pcr symposium2007-pcrarray
Q pcr symposium2007-pcrarrayElsa von Licy
 
Validation of Analytical Procedures.pdf
Validation of Analytical Procedures.pdfValidation of Analytical Procedures.pdf
Validation of Analytical Procedures.pdfpharma344
 
Quantitation techniques used in chromatography
Quantitation techniques used in chromatographyQuantitation techniques used in chromatography
Quantitation techniques used in chromatographyVrushali Tambe
 
Development and Validation of RP HPLC Method for Estimation of Vortioxetine i...
Development and Validation of RP HPLC Method for Estimation of Vortioxetine i...Development and Validation of RP HPLC Method for Estimation of Vortioxetine i...
Development and Validation of RP HPLC Method for Estimation of Vortioxetine i...ijtsrd
 
BME 302 Cellular Engineering Common Cell & Molecu.docx
BME 302 Cellular Engineering  Common Cell & Molecu.docxBME 302 Cellular Engineering  Common Cell & Molecu.docx
BME 302 Cellular Engineering Common Cell & Molecu.docxhartrobert670
 
LASSO MODELING AS AN ALTERNATIVE TO PCA BASED MULTIVARIATE MODELS TO SYSTEM W...
LASSO MODELING AS AN ALTERNATIVE TO PCA BASED MULTIVARIATE MODELS TO SYSTEM W...LASSO MODELING AS AN ALTERNATIVE TO PCA BASED MULTIVARIATE MODELS TO SYSTEM W...
LASSO MODELING AS AN ALTERNATIVE TO PCA BASED MULTIVARIATE MODELS TO SYSTEM W...mathsjournal
 
2014 IIAG Imputation Assessments
2014 IIAG Imputation Assessments2014 IIAG Imputation Assessments
2014 IIAG Imputation AssessmentsDr Lendy Spires
 
Parameter Estimation using Experimental Bifurcation Diagrams
Parameter Estimation using Experimental Bifurcation DiagramsParameter Estimation using Experimental Bifurcation Diagrams
Parameter Estimation using Experimental Bifurcation DiagramsAndy Salmon
 
First paper with the NITheCS affiliation
First paper with the NITheCS affiliationFirst paper with the NITheCS affiliation
First paper with the NITheCS affiliationRene Kotze
 
LASSO MODELING AS AN ALTERNATIVE TO PCA BASED MULTIVARIATE MODELS TO SYSTEM W...
LASSO MODELING AS AN ALTERNATIVE TO PCA BASED MULTIVARIATE MODELS TO SYSTEM W...LASSO MODELING AS AN ALTERNATIVE TO PCA BASED MULTIVARIATE MODELS TO SYSTEM W...
LASSO MODELING AS AN ALTERNATIVE TO PCA BASED MULTIVARIATE MODELS TO SYSTEM W...mathsjournal
 

Similar a Lectura1 (20)

real time quantitative pcr
 real time quantitative pcr real time quantitative pcr
real time quantitative pcr
 
Quantitative and Qualitative analysis of HPLC and GC
Quantitative and Qualitative analysis of HPLC and GCQuantitative and Qualitative analysis of HPLC and GC
Quantitative and Qualitative analysis of HPLC and GC
 
Overview of the glossary related to pcr
Overview of the glossary related to pcrOverview of the glossary related to pcr
Overview of the glossary related to pcr
 
Thesis Intro for LinkedIn
Thesis Intro for LinkedInThesis Intro for LinkedIn
Thesis Intro for LinkedIn
 
Real time pcr
Real time pcrReal time pcr
Real time pcr
 
Q pcr symposium2007-pcrarray
Q pcr symposium2007-pcrarrayQ pcr symposium2007-pcrarray
Q pcr symposium2007-pcrarray
 
Validation of Analytical Procedures.pdf
Validation of Analytical Procedures.pdfValidation of Analytical Procedures.pdf
Validation of Analytical Procedures.pdf
 
Real Time PCR
Real Time PCRReal Time PCR
Real Time PCR
 
Quantitation techniques used in chromatography
Quantitation techniques used in chromatographyQuantitation techniques used in chromatography
Quantitation techniques used in chromatography
 
Development and Validation of RP HPLC Method for Estimation of Vortioxetine i...
Development and Validation of RP HPLC Method for Estimation of Vortioxetine i...Development and Validation of RP HPLC Method for Estimation of Vortioxetine i...
Development and Validation of RP HPLC Method for Estimation of Vortioxetine i...
 
BME 302 Cellular Engineering Common Cell & Molecu.docx
BME 302 Cellular Engineering  Common Cell & Molecu.docxBME 302 Cellular Engineering  Common Cell & Molecu.docx
BME 302 Cellular Engineering Common Cell & Molecu.docx
 
hplc
 hplc hplc
hplc
 
Analytical control strategy 3
Analytical control strategy 3Analytical control strategy 3
Analytical control strategy 3
 
LASSO MODELING AS AN ALTERNATIVE TO PCA BASED MULTIVARIATE MODELS TO SYSTEM W...
LASSO MODELING AS AN ALTERNATIVE TO PCA BASED MULTIVARIATE MODELS TO SYSTEM W...LASSO MODELING AS AN ALTERNATIVE TO PCA BASED MULTIVARIATE MODELS TO SYSTEM W...
LASSO MODELING AS AN ALTERNATIVE TO PCA BASED MULTIVARIATE MODELS TO SYSTEM W...
 
LASSO MODELING AS AN ALTERNATIVE TO PCA BASED MULTIVARIATE MODELS TO SYSTEM W...
LASSO MODELING AS AN ALTERNATIVE TO PCA BASED MULTIVARIATE MODELS TO SYSTEM W...LASSO MODELING AS AN ALTERNATIVE TO PCA BASED MULTIVARIATE MODELS TO SYSTEM W...
LASSO MODELING AS AN ALTERNATIVE TO PCA BASED MULTIVARIATE MODELS TO SYSTEM W...
 
Chap3 1
Chap3 1Chap3 1
Chap3 1
 
2014 IIAG Imputation Assessments
2014 IIAG Imputation Assessments2014 IIAG Imputation Assessments
2014 IIAG Imputation Assessments
 
Parameter Estimation using Experimental Bifurcation Diagrams
Parameter Estimation using Experimental Bifurcation DiagramsParameter Estimation using Experimental Bifurcation Diagrams
Parameter Estimation using Experimental Bifurcation Diagrams
 
First paper with the NITheCS affiliation
First paper with the NITheCS affiliationFirst paper with the NITheCS affiliation
First paper with the NITheCS affiliation
 
LASSO MODELING AS AN ALTERNATIVE TO PCA BASED MULTIVARIATE MODELS TO SYSTEM W...
LASSO MODELING AS AN ALTERNATIVE TO PCA BASED MULTIVARIATE MODELS TO SYSTEM W...LASSO MODELING AS AN ALTERNATIVE TO PCA BASED MULTIVARIATE MODELS TO SYSTEM W...
LASSO MODELING AS AN ALTERNATIVE TO PCA BASED MULTIVARIATE MODELS TO SYSTEM W...
 

Más de accounting2010

People as prophets liberation theology and accounting
People as prophets liberation theology and accountingPeople as prophets liberation theology and accounting
People as prophets liberation theology and accountingaccounting2010
 
Neoliberalism, deregulation and sabannes oxley
Neoliberalism, deregulation and sabannes oxleyNeoliberalism, deregulation and sabannes oxley
Neoliberalism, deregulation and sabannes oxleyaccounting2010
 
International accounting regulation by the united nations a
International accounting regulation by the united nations a International accounting regulation by the united nations a
International accounting regulation by the united nations a accounting2010
 
Intellectual capital and the capital market
Intellectual capital and the capital marketIntellectual capital and the capital market
Intellectual capital and the capital marketaccounting2010
 
Improving the communication of accounting information throug
Improving the communication of accounting information througImproving the communication of accounting information throug
Improving the communication of accounting information througaccounting2010
 
Factors explaining the innefficient valuation of intangibles
Factors explaining the innefficient valuation of intangiblesFactors explaining the innefficient valuation of intangibles
Factors explaining the innefficient valuation of intangiblesaccounting2010
 
Economics and accounting a comparison between philosophical
Economics and accounting a comparison between philosophical Economics and accounting a comparison between philosophical
Economics and accounting a comparison between philosophical accounting2010
 
Current development in human resource costing and accounting
Current development in human resource costing and accountingCurrent development in human resource costing and accounting
Current development in human resource costing and accountingaccounting2010
 
Gaap perspectives from philosophy of law
Gaap perspectives from philosophy of lawGaap perspectives from philosophy of law
Gaap perspectives from philosophy of lawaccounting2010
 
Accounting studies of women
Accounting studies of womenAccounting studies of women
Accounting studies of womenaccounting2010
 
The time consistency of economic policy and the driving forces behind busines...
The time consistency of economic policy and the driving forces behind busines...The time consistency of economic policy and the driving forces behind busines...
The time consistency of economic policy and the driving forces behind busines...accounting2010
 
Time mastery clemens[1]
Time mastery clemens[1]Time mastery clemens[1]
Time mastery clemens[1]accounting2010
 
Moral reasoning and moral atmosphere in the domain of accoun
Moral reasoning and moral atmosphere in the domain of accounMoral reasoning and moral atmosphere in the domain of accoun
Moral reasoning and moral atmosphere in the domain of accounaccounting2010
 
A critique of the descriptive power of the private interest
A critique of the descriptive power of the private interest A critique of the descriptive power of the private interest
A critique of the descriptive power of the private interest accounting2010
 

Más de accounting2010 (15)

People as prophets liberation theology and accounting
People as prophets liberation theology and accountingPeople as prophets liberation theology and accounting
People as prophets liberation theology and accounting
 
Neoliberalism, deregulation and sabannes oxley
Neoliberalism, deregulation and sabannes oxleyNeoliberalism, deregulation and sabannes oxley
Neoliberalism, deregulation and sabannes oxley
 
International accounting regulation by the united nations a
International accounting regulation by the united nations a International accounting regulation by the united nations a
International accounting regulation by the united nations a
 
Intellectual capital and the capital market
Intellectual capital and the capital marketIntellectual capital and the capital market
Intellectual capital and the capital market
 
Improving the communication of accounting information throug
Improving the communication of accounting information througImproving the communication of accounting information throug
Improving the communication of accounting information throug
 
Factors explaining the innefficient valuation of intangibles
Factors explaining the innefficient valuation of intangiblesFactors explaining the innefficient valuation of intangibles
Factors explaining the innefficient valuation of intangibles
 
Economics and accounting a comparison between philosophical
Economics and accounting a comparison between philosophical Economics and accounting a comparison between philosophical
Economics and accounting a comparison between philosophical
 
Current development in human resource costing and accounting
Current development in human resource costing and accountingCurrent development in human resource costing and accounting
Current development in human resource costing and accounting
 
Gaap perspectives from philosophy of law
Gaap perspectives from philosophy of lawGaap perspectives from philosophy of law
Gaap perspectives from philosophy of law
 
Accounting studies of women
Accounting studies of womenAccounting studies of women
Accounting studies of women
 
Lectura2
Lectura2Lectura2
Lectura2
 
The time consistency of economic policy and the driving forces behind busines...
The time consistency of economic policy and the driving forces behind busines...The time consistency of economic policy and the driving forces behind busines...
The time consistency of economic policy and the driving forces behind busines...
 
Time mastery clemens[1]
Time mastery clemens[1]Time mastery clemens[1]
Time mastery clemens[1]
 
Moral reasoning and moral atmosphere in the domain of accoun
Moral reasoning and moral atmosphere in the domain of accounMoral reasoning and moral atmosphere in the domain of accoun
Moral reasoning and moral atmosphere in the domain of accoun
 
A critique of the descriptive power of the private interest
A critique of the descriptive power of the private interest A critique of the descriptive power of the private interest
A critique of the descriptive power of the private interest
 

Último

PROCESS RECORDING FORMAT.docx
PROCESS      RECORDING        FORMAT.docxPROCESS      RECORDING        FORMAT.docx
PROCESS RECORDING FORMAT.docxPoojaSen20
 
On National Teacher Day, meet the 2024-25 Kenan Fellows
On National Teacher Day, meet the 2024-25 Kenan FellowsOn National Teacher Day, meet the 2024-25 Kenan Fellows
On National Teacher Day, meet the 2024-25 Kenan FellowsMebane Rash
 
psychiatric nursing HISTORY COLLECTION .docx
psychiatric  nursing HISTORY  COLLECTION  .docxpsychiatric  nursing HISTORY  COLLECTION  .docx
psychiatric nursing HISTORY COLLECTION .docxPoojaSen20
 
Understanding Accommodations and Modifications
Understanding  Accommodations and ModificationsUnderstanding  Accommodations and Modifications
Understanding Accommodations and ModificationsMJDuyan
 
Unit-IV- Pharma. Marketing Channels.pptx
Unit-IV- Pharma. Marketing Channels.pptxUnit-IV- Pharma. Marketing Channels.pptx
Unit-IV- Pharma. Marketing Channels.pptxVishalSingh1417
 
1029 - Danh muc Sach Giao Khoa 10 . pdf
1029 -  Danh muc Sach Giao Khoa 10 . pdf1029 -  Danh muc Sach Giao Khoa 10 . pdf
1029 - Danh muc Sach Giao Khoa 10 . pdfQucHHunhnh
 
ICT role in 21st century education and it's challenges.
ICT role in 21st century education and it's challenges.ICT role in 21st century education and it's challenges.
ICT role in 21st century education and it's challenges.MaryamAhmad92
 
SOC 101 Demonstration of Learning Presentation
SOC 101 Demonstration of Learning PresentationSOC 101 Demonstration of Learning Presentation
SOC 101 Demonstration of Learning Presentationcamerronhm
 
UGC NET Paper 1 Mathematical Reasoning & Aptitude.pdf
UGC NET Paper 1 Mathematical Reasoning & Aptitude.pdfUGC NET Paper 1 Mathematical Reasoning & Aptitude.pdf
UGC NET Paper 1 Mathematical Reasoning & Aptitude.pdfNirmal Dwivedi
 
ICT Role in 21st Century Education & its Challenges.pptx
ICT Role in 21st Century Education & its Challenges.pptxICT Role in 21st Century Education & its Challenges.pptx
ICT Role in 21st Century Education & its Challenges.pptxAreebaZafar22
 
Seal of Good Local Governance (SGLG) 2024Final.pptx
Seal of Good Local Governance (SGLG) 2024Final.pptxSeal of Good Local Governance (SGLG) 2024Final.pptx
Seal of Good Local Governance (SGLG) 2024Final.pptxnegromaestrong
 
Dyslexia AI Workshop for Slideshare.pptx
Dyslexia AI Workshop for Slideshare.pptxDyslexia AI Workshop for Slideshare.pptx
Dyslexia AI Workshop for Slideshare.pptxcallscotland1987
 
Third Battle of Panipat detailed notes.pptx
Third Battle of Panipat detailed notes.pptxThird Battle of Panipat detailed notes.pptx
Third Battle of Panipat detailed notes.pptxAmita Gupta
 
This PowerPoint helps students to consider the concept of infinity.
This PowerPoint helps students to consider the concept of infinity.This PowerPoint helps students to consider the concept of infinity.
This PowerPoint helps students to consider the concept of infinity.christianmathematics
 
Python Notes for mca i year students osmania university.docx
Python Notes for mca i year students osmania university.docxPython Notes for mca i year students osmania university.docx
Python Notes for mca i year students osmania university.docxRamakrishna Reddy Bijjam
 
TỔNG ÔN TẬP THI VÀO LỚP 10 MÔN TIẾNG ANH NĂM HỌC 2023 - 2024 CÓ ĐÁP ÁN (NGỮ Â...
TỔNG ÔN TẬP THI VÀO LỚP 10 MÔN TIẾNG ANH NĂM HỌC 2023 - 2024 CÓ ĐÁP ÁN (NGỮ Â...TỔNG ÔN TẬP THI VÀO LỚP 10 MÔN TIẾNG ANH NĂM HỌC 2023 - 2024 CÓ ĐÁP ÁN (NGỮ Â...
TỔNG ÔN TẬP THI VÀO LỚP 10 MÔN TIẾNG ANH NĂM HỌC 2023 - 2024 CÓ ĐÁP ÁN (NGỮ Â...Nguyen Thanh Tu Collection
 
Unit-V; Pricing (Pharma Marketing Management).pptx
Unit-V; Pricing (Pharma Marketing Management).pptxUnit-V; Pricing (Pharma Marketing Management).pptx
Unit-V; Pricing (Pharma Marketing Management).pptxVishalSingh1417
 
microwave assisted reaction. General introduction
microwave assisted reaction. General introductionmicrowave assisted reaction. General introduction
microwave assisted reaction. General introductionMaksud Ahmed
 

Último (20)

PROCESS RECORDING FORMAT.docx
PROCESS      RECORDING        FORMAT.docxPROCESS      RECORDING        FORMAT.docx
PROCESS RECORDING FORMAT.docx
 
Spatium Project Simulation student brief
Spatium Project Simulation student briefSpatium Project Simulation student brief
Spatium Project Simulation student brief
 
On National Teacher Day, meet the 2024-25 Kenan Fellows
On National Teacher Day, meet the 2024-25 Kenan FellowsOn National Teacher Day, meet the 2024-25 Kenan Fellows
On National Teacher Day, meet the 2024-25 Kenan Fellows
 
psychiatric nursing HISTORY COLLECTION .docx
psychiatric  nursing HISTORY  COLLECTION  .docxpsychiatric  nursing HISTORY  COLLECTION  .docx
psychiatric nursing HISTORY COLLECTION .docx
 
Understanding Accommodations and Modifications
Understanding  Accommodations and ModificationsUnderstanding  Accommodations and Modifications
Understanding Accommodations and Modifications
 
Unit-IV- Pharma. Marketing Channels.pptx
Unit-IV- Pharma. Marketing Channels.pptxUnit-IV- Pharma. Marketing Channels.pptx
Unit-IV- Pharma. Marketing Channels.pptx
 
1029 - Danh muc Sach Giao Khoa 10 . pdf
1029 -  Danh muc Sach Giao Khoa 10 . pdf1029 -  Danh muc Sach Giao Khoa 10 . pdf
1029 - Danh muc Sach Giao Khoa 10 . pdf
 
Mehran University Newsletter Vol-X, Issue-I, 2024
Mehran University Newsletter Vol-X, Issue-I, 2024Mehran University Newsletter Vol-X, Issue-I, 2024
Mehran University Newsletter Vol-X, Issue-I, 2024
 
ICT role in 21st century education and it's challenges.
ICT role in 21st century education and it's challenges.ICT role in 21st century education and it's challenges.
ICT role in 21st century education and it's challenges.
 
SOC 101 Demonstration of Learning Presentation
SOC 101 Demonstration of Learning PresentationSOC 101 Demonstration of Learning Presentation
SOC 101 Demonstration of Learning Presentation
 
UGC NET Paper 1 Mathematical Reasoning & Aptitude.pdf
UGC NET Paper 1 Mathematical Reasoning & Aptitude.pdfUGC NET Paper 1 Mathematical Reasoning & Aptitude.pdf
UGC NET Paper 1 Mathematical Reasoning & Aptitude.pdf
 
ICT Role in 21st Century Education & its Challenges.pptx
ICT Role in 21st Century Education & its Challenges.pptxICT Role in 21st Century Education & its Challenges.pptx
ICT Role in 21st Century Education & its Challenges.pptx
 
Seal of Good Local Governance (SGLG) 2024Final.pptx
Seal of Good Local Governance (SGLG) 2024Final.pptxSeal of Good Local Governance (SGLG) 2024Final.pptx
Seal of Good Local Governance (SGLG) 2024Final.pptx
 
Dyslexia AI Workshop for Slideshare.pptx
Dyslexia AI Workshop for Slideshare.pptxDyslexia AI Workshop for Slideshare.pptx
Dyslexia AI Workshop for Slideshare.pptx
 
Third Battle of Panipat detailed notes.pptx
Third Battle of Panipat detailed notes.pptxThird Battle of Panipat detailed notes.pptx
Third Battle of Panipat detailed notes.pptx
 
This PowerPoint helps students to consider the concept of infinity.
This PowerPoint helps students to consider the concept of infinity.This PowerPoint helps students to consider the concept of infinity.
This PowerPoint helps students to consider the concept of infinity.
 
Python Notes for mca i year students osmania university.docx
Python Notes for mca i year students osmania university.docxPython Notes for mca i year students osmania university.docx
Python Notes for mca i year students osmania university.docx
 
TỔNG ÔN TẬP THI VÀO LỚP 10 MÔN TIẾNG ANH NĂM HỌC 2023 - 2024 CÓ ĐÁP ÁN (NGỮ Â...
TỔNG ÔN TẬP THI VÀO LỚP 10 MÔN TIẾNG ANH NĂM HỌC 2023 - 2024 CÓ ĐÁP ÁN (NGỮ Â...TỔNG ÔN TẬP THI VÀO LỚP 10 MÔN TIẾNG ANH NĂM HỌC 2023 - 2024 CÓ ĐÁP ÁN (NGỮ Â...
TỔNG ÔN TẬP THI VÀO LỚP 10 MÔN TIẾNG ANH NĂM HỌC 2023 - 2024 CÓ ĐÁP ÁN (NGỮ Â...
 
Unit-V; Pricing (Pharma Marketing Management).pptx
Unit-V; Pricing (Pharma Marketing Management).pptxUnit-V; Pricing (Pharma Marketing Management).pptx
Unit-V; Pricing (Pharma Marketing Management).pptx
 
microwave assisted reaction. General introduction
microwave assisted reaction. General introductionmicrowave assisted reaction. General introduction
microwave assisted reaction. General introduction
 

Lectura1

  • 1. Published online 4 July 2008 Nucleic Acids Research, 2008, Vol. 36, No. 14 e91 doi:10.1093/nar/gkn408 A new method for robust quantitative and qualitative analysis of real-time PCR Eric B. Shain* and John M. Clemens Abbott Molecular Inc., 1300 E. Touhy Avenue, Des Plaines, IL 60018, USA Received February 25, 2008; Revised June 3, 2008; Accepted June 10, 2008 ABSTRACT An automated data analysis method for real-time PCR needs to exhibit robustness to the factors that routinely impact the measurement and analysis of real-time PCR data. Robust analysis is paramount to providing the same interpretation for results regardless of the skill of the operator performing or reviewing the work. We present a new method for analysis of real-time PCR data, the maxRatio method, which identifies a consistent point within or very near the exponential region of the PCR signal without requiring user intervention. Com- pared to other analytical techniques that generate only a cycle number, maxRatio generates several measurements of amplification including cycle num- bers and relative measures of amplification effi- ciency and curve shape. By using these values, the maxRatio method can make highly reliable reactive/ nonreactive determination along with quantitative evaluation. Application of the maxRatio method to the analysis of quantitative and qualitative real-time PCR assays is shown along with examples of method robustness to, and detection of, amplifica- tion response anomalies. INTRODUCTION Real-time PCR has become a widely used methodology for both qualitative and quantitative determination of molecular targets. The power of real-time PCR is that the fluorescence response observed is a direct measure of the dynamics of the amplification reaction process. The real-time PCR curve is a fluorescence response with a roughly sigmoidal shape that correlates to the growth of amplified product during the PCR amplification process. The shape of the PCR amplification curve reflects the dynamics of the PCR reaction for an individual sample that is controlled by the assay design, which includes reac- tive components (primer and probe designs and concen- trations, concentrations of enzymes, activators, buffers, dNTPs, etc.) and cycling conditions for the reaction. Current analytical methods primarily concentrate on quantitative responses that involve cycle number determi- nation. These approaches provide a quantitative assess- ment by focusing on one portion of the amplification growth curve, namely the region of observed exponential growth. The cycle threshold (Ct) method (1) determines a cycle number based on the point where the fluorescence response grows above the background level to cross a predetermined fluorescence threshold value. The critical steps involved in Ct determination include defining the baseline, establishing a suitable threshold for quantifica- tion of the target and using either an external calibration curve or an internal quantitation standard (2) for quanti- tation. The Ct method is an excellent method for provid- ing quantitative PCR analysis because of the consistency in signal intensity during the exponential growth phase of the PCR. However, it is susceptible to baselining error when challenged with signal anomalies such as spectral crosstalk or transients due to bubbles in the reaction or noise. For example, to generate a Ct value within the exponential growth region of the PCR curve, a low thresh- old may be required. With a low threshold, there is a potential for a threshold crossing due to an anomalous signal, e.g. spectral crosstalk rather than true amplifica- tion. It is difficult to discriminate between a Ct value caused by a false threshold crossing and one generated by a valid reactive response. In such cases, analysis can require some measure of interpretation on the part of the data reviewer to assess whether a particular response is truly an amplification or not. In addition, it is difficult to determine the true Ct value in the presence of such signal anomalies. Even small errors in the baselining pro- cess can cause negative reactions to cross the threshold or reactive signals to cross early or late. An alternate method for determination of cycle numbers is the use of derivative methods, such as the second derivative maximum method (3), which do not require baselining. Both Ct and deriva- tive methods provide a cycle number response for the PCR reaction, but do not provide any means for assessing the efficiency of the individual reaction or suitability of the PCR curve for quantitative analysis. We present here a new method for analysis of real-time PCR data, the maxRatio method, which identifies a *To whom correspondence should be addressed. Tel: +1 224 361 7251; Fax: +1 224 361 7505; Email: eric.shain@abbott.com ß 2008 The Author(s) This is an Open Access article distributed under the terms of the Creative Commons Attribution Non-Commercial License (http://creativecommons.org/licenses/ by-nc/2.0/uk/) which permits unrestricted non-commercial use, distribution, and reproduction in any medium, provided the original work is properly cited.
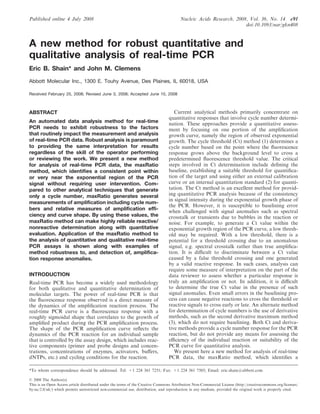
  • 2. consistent point within or very near the exponential region of the PCR signal without requiring user intervention. Compared to other analysis techniques that generate only a cycle number, maxRatio generates several measure- ments of amplification including cycle numbers and rela- tive measures of amplification efficiency and curve shape. By using these values, the maxRatio method can achieve highly reliable reactive/nonreactive determination along with quantitative evaluation. MATERIALS AND METHODS maxRatio method description The maxRatio method takes a PCR amplification signal and calculates a ratio at each cycle using Equation (1). Ration ¼ Signaln SignalnÀ1 À 1 1 where Signaln is the measured real-time PCR fluorescence response for the target of interest at cycle n. Because Equation (1) has the signal in the numerator and denomi- nator, the ratio is a self-normalizing, dimensionless expression. The effect of normalization by a nearly con- stant reference signal divides out and either raw or nor- malized fluorescence may be used. This self normalizing characteristic also provides the ratio transformation with an inherent insensitivity to variability in signal intensity such as might occur from well-to-well within an instru- ment or between instruments. The ratio calculation transforms the roughly sigmoidal shaped amplification curve to a ratio curve with a well- defined peak. Figure 1 illustrates this transformation. The ratio curve exhibits several well-defined features. The maximum value of the ratio curve defines two values. The magnitude of the ratio curve at the maximum is defined as the MR (maxRatio) value. The cycle number at which the maximum occurs is defined as the FCN value or fractional cycle number. The ratio curve is based on a cycle-by-cycle ratio of signal intensities, which differs from the first or second derivative maximum methods (3) as the derivative calculation is a difference measurement. The FCN value generated by the maxRatio method is conse- quently not the same value as the cycle number generated by either derivative method. The ratio curve has a char- acteristic width, measured as the half width at half max- imum, referred to as the width parameter. The ratio curve is a relative measure of the fluorescence signal growth throughout the PCR reaction. The early cycle ratio curve near zero represents the baseline region of the PCR curve and the late cycle region corresponds to the plateau phase. The ascending part of the ratio curve corresponds to the exponential growth phase; the descend- ing part of the ratio curve is the transition from the expo- nential to the plateau phase in the PCR curve. Nonreactive responses have ratio curves that are nearly flat with an MR value near zero. A ratio threshold can be established, which separates reactive versus nonreactive responses based on MR values. The signal value, Signaln, in the ratio Equation (1) includes the PCR signal intensity and the inherent back- ground fluorescence level. As such, MR values are a rela- tive measure of reaction efficiency. The magnitude of the MR value even for a perfectly efficient reaction is always less than one because of the inherent level of background fluorescence incorporated in the ratio equation. By includ- ing the background fluorescence in the ratio equation, the resulting ratio curve avoids the problem of division by zero and is highly insensitive to even moderate baseline slope variation. Different probe designs and dye/quencher combinations can exhibit different levels of quenching. An assay with higher background fluorescence will typically have lower MR values. Many efforts have been made to estimate absolute PCR reaction efficiency from individual responses (4–7). Although an absolute measurement of reaction efficiency would be ideal, it has been reported that even nominal variations in baseline determination can make calculation of absolute amplification efficiency from individual responses unreliable. Calculating initial starting concen- tration using such an absolute efficiency measure is diffi- cult. In any case, all such methods rely on precise removal of background fluorescence level and slope, and generally require curve fitting functions to relatively few points. It should be noted that the relative efficiency measure MR value generated by the maxRatio method is not used to directly estimate reaction efficiency or to calculate initial sample concentration. Instead, MR is used to deter- mine if a response is reactive or nonreactive and for reac- tive responses if it is a normal amplification for that assay. It has been found that for some assays, low target amplification curves exhibit suppressed signal levels, for example due to competition with nonspecific amplification products. As a result, the exponential growth portion of the amplification curve is reduced. This causes the ratio peak and therefore the FCN value to shift slightly earlier. The result is a slight overquantitation for low copy sam- ples. At the same time, these suppressed signals exhibit reduced MR responses. We can take advantage of this 0 5 10 15 20 25 30 35 40 0 5 10 15 20 Fluorescence 0 5 10 15 20 25 30 35 40 0 5 10 15 20 Fluorescence 0 0.1 0.2 0.3 0.4 Cycle Ratio 0 0.1 0.2 0.3 0.4 Cycle Ratio FCNRatio Curve Ratio Curve MR FCN PCR Response PCR Response Ratio Threshold MR/2 Ratio Threshold Width A B Figure 1. MR, FCN and width definition. (A) PCR response and ratio curve for a positive reaction with definition of MR, FCN and width. (B) PCR response and ratio curve for a negative reaction. e91 Nucleic Acids Research, 2008, Vol. 36, No. 14 PAGE 2 OF 7
  • 3. correlated behavior between the FCN and MR response values for these samples to create an adjusted FCN value (FCNA) that uses the MR value to compensate for the earlier FCN determination. The FCNA is defined in Equation (2). FCNA ¼ FCN À Log2ðMRÞ 2 Use of FCNA may provide more linear quantitation to the lowest detectable responses for some assays. Ratio threshold use The ratio threshold is used to separate populations of responses based on relative reaction efficiency (MR) values. Setting of the ratio threshold is determined by characterization of the assay and is determined primarily by analysis of negatives. One method might be to deter- mine the mean and SD of the MR values for negative reactions and then set the ratio threshold to a level of the mean plus some number of SDs (typically 5 to 10 SD). Other considerations when setting the ratio threshold include the presence of spectral crosstalk in multiplex assays and signal anomalies such as initial transients. Although shown in Figure 1 as a straight line, the ratio threshold can be set with different levels at different cycles. The setting of the ratio threshold is determined during assay development and typically does not need to be changed even for different instruments or reagent lots. Unlike the threshold used for Ct analysis, the ratio thresh- old is only used to determine reactivity of the response. It has no effect on the FCN value used for quantification of positive reactions. More than one ratio threshold can be established. While one ratio threshold can be set on the basis of separating nonreactive from reactive responses, a second threshold can be applied based on separating normal reactive responses from abnormal reactive responses. Use of response shifting Because the ratio transformation is inherently self- compensating for reaction signal intensity, it can be applied to a reaction’s raw fluorescence signal. When a reference dye is available, the normalized fluorescence signal is typically analyzed. It should be noted that the fluorescence signal naturally has a background level of unquenched fluorescence. Because of the division in the ratio transformation, it is necessary to maintain this back- ground fluorescence level to avoid division by zero. As an alternative to utilizing the raw or normalized fluorescence response directly, the response may be shifted to fixed positive background fluorescence level. The advantage of this response shifting is to eliminate sensitivity to factors that can change the level of background fluorescence, such as variability in probe manufacture or fluorescence con- tamination in the thermal cycler block. The disadvantage of shifting the response is that it removes the inherent insensitivity to signal intensity and can introduce some instrument-to-instrument variability. For this reason, if response shifting is implemented, using a shift value near the natural level of background fluorescence is recom- mended. It should be noted that shifting will directly affect the magnitude of the MR value. Shifting to a low value will increase both the MR value of positive reactions as well as the mean and SD of the MR for negative reac- tions. In terms of statistical separation of populations, this rarely makes significant difference. Shifting to a low level can also reduce robustness to spectral crosstalk, initial signal transients and other anomalies in the baseline por- tion of the amplification response. It is important there- fore when developing the assay, to focus on statistical separation of reactive from nonreactive populations by MR, not on maximizing the MR value. Method implementation The maxRatio method has been implemented as part of the Abbott m2000TM system. The m2000 system consists of two instruments: the Abbott m2000sp and the m2000rt. The m2000sp automates the extraction, purification and preparation of DNA and RNA from patient samples. The m2000rt real-time PCR instrument amplifies and detects real-time PCR assays. Because the m2000 system has an effective automatic baselining algorithm, baseline slope correction (but not offset) is applied. Although normal- ization and baseline slope correction are not required by the maxRatio method, a small improvement in perfor- mance may be achieved using them. In addition, the signal has a smoothing filter applied. It is a feature of the maxRatio method that a much more aggressive noise filter can be applied without significantly affecting the cycle number compared to the Ct method. The m2000rt instrument implements a fourth order, zero-phase noise filter. In order to obtain 0.01 cycle resolution, a cubic spline interpolation is applied to the ratio curve. Example data sets The PCR data used to illustrate attributes of the maxRatio analysis method consist of actual and modified data derived from Abbott RealTime PCR assays pro- cessed on the m2000 system. Modified data is used as noted to demonstrate the performance of different algo- rithms to anomolous responses that may occur periodi- cally in the course of normal processing. RESULTS AND DISCUSSION Assay quantification using maxRatio A comparison of quantification using the maxRatio algo- rithm was made using an Abbott RealTime HIV-1 linear- ity panel (8). A dilution series of Armored HIV-1 RNA ranging from 7.44 log10 copies/ml to 1.56 log10 copies/ml (27.5 million copies/ml to 36 copies/ml) was analyzed. Three runs were performed with four replicates per run at each concentration. All 12 replicates were detected for the highest seven dilutions, while 11 out of 12 replicates were detected at 36 copies/ml. The maxRatio method was implemented with response shifting set to 0.7. FCN and FCNA cycle numbers were used for quantitation by the maxRatio method. Figure 2 illustrates HIV-1 normalized FAM (6-carboxy- fluorescein) fluorescence for one of the runs processed PAGE 3 OF 7 Nucleic Acids Research, 2008, Vol. 36, No. 14 e91
  • 4. with the maxRatio algorithm. Plotting the MR versus FCN values generates the characteristic MR–FCN plot for this data. The only negative response is from the negative control, which is identified in the MR versus FCN plot with an MR value near zero. Since there is no signal growth in reactions without target, the ratio curve is nearly equal to zero throughout the amplification process. The MR value of approximately zero easily distinguishes the negative response from the reactive samples. Comparable quantification performance using either Ct, FCN or FCNA values was observed as shown in Figure 3. Ct values were generated using m2000rt soft- ware. This system uses an automatic baselining algorithm, which determines the optimum background regression region on an individual responses basis. Qualititative data analysis An Abbott RealTime Chlamydia trachomatis/Neisseria gonorrhoeae (CT/NG) assay (not available in the US) was used to test 623 patient specimens collected with the Abbott multi-Collect Specimen Collection Kit. The sam- ples included male and female urine specimens, male urethral swab specimens and female endocervical and vaginal swab specimens. A total of 15 Abbott RealTime CT/NG runs were performed using three m2000sp and two m2000rt instruments. The maxRatio method was implemented without response shifting. Figure 4 shows the MR–FCN plots for a representative subset of the data. As can be seen, negative sample MR values are exceptionally low for C. trachomatis responses. Neisseria gonorrhoeae negative sample MR values are slightly ele- vated and have FCN values between 35 and 40 showing the effect of modest spectral crosstalk from the internal control responses. Detection of suppressed amplification The MR value consistently identifies efficient from ineffi- cient amplifications even in the presence of factors such as baseline anomalies. As discussed earlier, multiple ratio thresholds can be established to partition responses into categories such as nonreactive, normally reactive and abnormally reactive. Figure 5 demonstrates this approach using a RealTime HIV-1 example. A single well (C1) from this run had a suppressed amplification. The signal in this well starts rising above background as early as cycle 12, 0 5 10 15 20 25 30 35 40 0 5 10 15 20 Cycle NormalizedFAM 0 5 10 15 20 25 30 35 40 0 0.1 0.2 0.3 0.4 Cycle Ratio 0 5 10 15 20 25 30 35 40 0 0.1 0.2 0.3 0.4 FCN MR A B C Ratio Threshold Figure 2. Analysis by maxRatio of RealTime HIV-1 assay amplification plots. HIV-1 RNA ranging from 7.44 log10 copies/ml to 1.56 log10 copies/ml were tested in replicates of four using the m2000sp and m2000rt instruments. (A) Amplification plots of the HIV-1 normalized FAM fluorescence versus cycle number. (B) Corresponding plots after applying the ratio transformation. (C) Plot of MR versus FCN values derived from the peaks of the ratio responses. 0 1 2 3 4 5 6 7 8 0 2 4 6 8 ConcentrationbyCt (Log10copies/ml) y = 0.9243*x + 0.3003 R2 = 0.9977, N = 95 0 1 2 3 4 5 6 7 8 0 2 4 6 8 ConcentrationbyFCN (Log10copies/ml) y = 0.9598*x + 0.2231 R2 = 0.9982, N = 95 0 1 2 3 4 5 6 7 8 0 2 4 6 8 Assigned Concentration (Log10 copies/ml) Assigned Concentration (Log10 copies/ml) Assigned Concentration (Log10 copies/ml) ConcentrationbyFCNA (Log10copies/ml) y = 0.9694*x + 0.1814 R2 = 0.9979, N = 95 A C B Figure 3. Analysis by maxRatio of a RealTime HIV-1 linearity panel. HIV-1 RNA ranging from 7.44 log10 copies/ml to 1.56 log10 copies/ml were tested using the m2000sp and m2000rt instruments. (A) Observed versus assigned concentration calculated using Ct values. (B) Observed versus assigned concentration calculated using FCN values. (C) Observed versus assigned concentration calculated using FCNA values. e91 Nucleic Acids Research, 2008, Vol. 36, No. 14 PAGE 4 OF 7
  • 5. but clearly is not amplifying as strongly as the other reac- tive samples on the plate. The response for well C1 rises above the Ct threshold, but the accuracy of quantification would be in doubt. Final fluorescence level cannot be used to invalidate this well in that it is comparable to the final fluorescence from the wells with low viral load samples. Figure 5C shows the clear partitioning of this abnormal response from both the nonreactive and normal reactive responses using two ratio thresholds. This approach allows the ability to differentiate and invalidate such sup- pressed amplifications without requiring visual inspection by the operator. The Kinetic Outlier Detection (KOD) method presented by Bar et al. (9) presents an approach to detecting anomalous amplification using an absolute efficiency estimate. While a very attractive approach, this method shares the issues common to other methods which attempt to determine absolute efficiency from individual responses. In particular, sensitivity to the background sub- traction process, difficulty of identifying the exponential region and complexity of implementation. Primer dimers and other sources of nonspecific amplifi- cation can have a deleterious effect on assay signal. Nonspecific products can compete for resources and thereby interfere with specific amplifications. Alterna- tively, with SYBR assays, nonspecific amplification products can be falsely interpreted as positive reactions. Nonspecific reactions are usually inefficient with corres- pondingly low MR values. To the extent that nonspecific products affect the PCR response shape, then maxRatio should provide tools with which to identify compromised assay results. Both suppressed amplification and false positives can be handled using maxRatio analysis with careful selection of parameters. Internal control evaluation Real-time PCR assays commonly include an internal con- trol. In Abbott RealTime assays, the internal control pro- vides confirmation of the successful processing of the sample from sample preparation through amplification. For the Abbott RealTime HIV-1 assay, PCR amplification of the internal control (IC) is accomplished with a differ- ent set of primers than those used to amplify HIV-1. The IC primers target a sequence of 136 nt that is derived from the hydroxypyruvate reductase (HPR) gene from the pumpkin plant. The IC Probe is labeled with VIC dye. Because the IC is noncompetitive with the target reaction, the IC MR and cycle number values are expected to be consistent across all reactions independent of target con- centration. Standard Ct analysis can only evaluate the internal control based on cycle number. The maxRatio analysis method may be used to provide a 2D evaluation of the internal control. When setting the ratio threshold 0 5 10 15 20 25 30 35 40 45 0 0.05 0.1 0.15 0.2 FCN CTMR 0 5 10 15 20 25 30 35 40 45 0 0.05 0.1 0.15 0.2 FCN NGMR 0 5 10 15 20 25 30 35 40 45 0 0.05 0.1 0.15 0.2 0.25 FCN ICMR A B C Figure 4. Analysis by maxRatio of RealTime CTNG results. Representative MR–FCN plots of (A) C. trachomatis responses (B) N. gonorrhoeae responses and (C) IC responses. Each plot represents collated responses from three out of the 15 runs. Reactive samples are denoted with a plus plot symbol and nonreactive with a circle plot symbol. 0 5 10 15 BaselinedFAM 0 5 10 15 20 25 30 35 40 −1 0 1 2 3 BaselinedFAM 0 5 10 15 20 25 30 35 40 0 0.1 0.2 0.3 0.4 0.5 FCN MR Normal Reactive Abnormal Reactive Nonreactive A B C Well C1 Well C1 Cycle 0 5 10 15 20 25 30 35 40 Cycle Figure 5. Detection of suppressed amplification by maxRatio analysis of RealTime HIV-1 assay amplification plots. Single PCR run contain- ing 72 samples processed using the m1000 and m2000rt instruments. (A) Amplification plots of the HIV-1 baselined FAM fluorescence versus cycle number. (B) Same responses plotted with a narrowed fluor- escence range to highlight well C1 response. (C) Plot of MR versus FCN values for the assay responses showing partitioning of samples into nonreactive, normal reactive and abnormal reactive populations. PAGE 5 OF 7 Nucleic Acids Research, 2008, Vol. 36, No. 14 e91
  • 6. for an internal control, the objective is not to distinguish reactive from nonreactive responses, but rather to distin- guish normal reactive from unacceptable reactive responses. Using this 2D analysis, one can potentially dis- tinguish between concentration and inhibition-related problems. Figure 6 illustrates this evaluation. The IC data from the same assay run used for Figure 5 is shown. As can be seen, the response from well C1 crosses the threshold at a comparable point to other reactions, but is significantly suppressed. This is reflected in the lower plot with a corresponding suppressed MR value. This response would not be deemed invalid by inspecting cycle number alone. Also present are several late rising internal control responses whose MR values are normal, but cycle numbers are delayed. Robustness to spectral crosstalk The broad, overlapping fluorescence spectra of dyes used in multiplex assays presents a challenge to accurately determine the contribution of each dye response to the measured signal. Although dye calibration procedures are in general very effective, several issues limit the ability to perfectly calibrate a system. These include variable read temperatures for different assays, differences in mastermix components compared to the dye calibration solution, quencher used and even the probe oligo sequence (10). As an example of the robustness of the maxRatio method to spectral crosstalk, the response from a single well (C6) in the HIV-1 data set shown in Figure 2 was modified by taking a fraction of the signal from the FAM response and adding it to the VIC response. This simulates the effect of spectral crosstalk commonly observed with multiplex assays. The FAM response in this reaction represents a typical 6.68 log copies/ml sample and the VIC response a typical internal control. From –1.4% to 1.4% of the FAM response was added to the VIC response in increments of 0.2%. Figure 7 shows the effect of spectral crosstalk on VIC Ct and FCN values. From nominal, over the range of spectral crosstalk tested, Ct values varied from –1.50 to 0.47. From nominal, FCN values varied only from –0.07 to 0.09 cycles. Detection of Ct validity By using both maxRatio and Ct methods simultaneously, an enhancement to analysis validity can be obtained. As shown in Figure 3, FCN, FCNA and Ct values closely correlate to log sample concentration. Because of this close correlation, they can be used to detect and invalidate responses with baselining errors. The cycle difference between the FCN or FCNA value and the Ct value tends to be nearly constant across the dynamic range for any particular assay. This cycle difference (FCNA – CT) can be monitored as a parameter to assess validity of the cycle number determination. An example of how this FCNA – CT cycle difference is used to detect invalid responses is provided in Figure 8. The figure shows an anomalous assay response from an Abbott RealTime HCV (11) (not available in the US) run on the m2000rt with a manually prepared PCR plate. The response exhibits a discontinuity in the background region that caused an errant Ct determination. The exact source of the anomaly is unknown, but it is possibly due to a bubble in the PCR well or a similar transient event. The anomaly resulted in the baselining process tilting the response up causing it to cross the threshold early. To evaluate the impact of this tilt on the analysis, the response fluorescence data was manually corrected and reanalyzed. It should be noted that this manual correction is not part of the maxRatio analysis algorithm, but only used here to illustrate the ability to detect incorrect base- lining. The Ct value of the original response was 24.16 and 0 5 10 15 20 25 30 35 40 −0.5 0 0.5 1 1.5 2 Cycle dRn 0 5 10 15 20 25 30 35 40 0 0.1 0.2 0.3 0.4 0.5 Ct MR A B Amplicon Contamination Lack of Recovery Invalid Response Inadequate Reaction Efficiency or Inhibition Well C1 Well C1 Figure 6. IC evaluation by maxRatio. IC MR value versus Ct value corresponding to HIV-1 responses displayed in Figure 5. 0 5 10 15 20 25 30 35 40 0.5 1 1.5 2 2.5 3 3.5 NormalizedVIC −1.5 −1 −0.5 0 0.5 1 1.5 −2 −1.5 −1 −0.5 0 0.5 1 CycleNumberChange Delta Ct Delta FCN A B % FAM Crosstalk into VIC Cycle Figure 7. Spectral crosstalk analysis of an IC response from a 6.86 log10 copy/ml RealTime HIV-1 sample. (A) Amplification plots of the modified VIC IC reactions. (B) Plot of the difference in Ct and FCN cycle numbers from an unmodified response shown. Ct values calcu- lated based on a threshold of 0.3 and FCN values calculated from normalized VIC responses. e91 Nucleic Acids Research, 2008, Vol. 36, No. 14 PAGE 6 OF 7
  • 7. the FCNA value was 35.34. The corrected response Ct value was 30.48 and the FCNA value was 35.39. The base- line anomaly caused a 6.32 cycle Ct change with only a 0.05 cycle FCNA change. The cycle difference (FCNA – Ct) was 11.18 cycles for the uncorrected response and 4.91 cycles for the corrected response. Figure 8C displays the cycle difference for the 28 positive assay responses from the same PCR run. As can be seen, well G1 is clearly an outlier. CONCLUSION The maxRatio method for analysis of real-time PCR reac- tions provides a measure of concentration (FCN or FCNA) together with a relative measure of reaction effi- ciency (MR) that are not present in other commonly used data analysis algorithms. These measures are consistently determined even in the presence of systematic and nonsys- tematic errors in amplification signals that can cause errors in interpretation for other methods. The relative reaction efficiency measurement by MR values provides an effective and reliable method for reactive/nonreactive determinations as well as discrimination of normal versus inhibited responses. Quantitative evaluation using maxRatio generated cycle numbers is comparable in linearity and precision to analysis based on Ct values. Although examples in this article utilize probes for signal generation, the method has been successfully applied to SYBR green assays as well and should work for any ampli- fication signal that exhibits a roughly sigmoidal shape. While maxRatio analysis can be used by itself to anal- yze PCR reactions, it may also be used to complement traditional Ct analysis. The maxRatio analysis technique can be used to determine assay reactivity so that Ct anal- ysis is only applied to reactive signals. In addition, the Ct value can be compared to the maxRatio FCN or FCNA value to determine cycle number validity. In the clinical laboratory setting, the data analysis method needs to be robust to common sources of variance which include multiple lots of assay reagents, the variability of a large instrument population and differences in oper- ator skill and training. The robustness of the maxRatio method, along with the validity metrics it generates, pro- vides the objective analysis necessary for an automated data analysis method for a clinical real-time PCR system. ACKNOWLEDGEMENTS Funding to pay the Open Access publication charges for this article was provided by Abbott Molecular, Inc., Des Plaines, IL. Conflict of interest statement. None declared. REFERENCES 1. Heid,C., Stevens,J., Livak,K. and Williams,P. (1996) Real time quantitative PCR. Genome Res., 6, 986–994. 2. Livak,K. and Schmittgen,T. (2001) Analysis of relative gene expression data using real-time quantitative PCR and the 2ÀÁÁCT method. Methods, 25, 402–408. 3. Rasmussen,R. (2001) Quantification on the LightCycler instrument. In Meuer S., Wittwer,C. and Nakagawara,K. Rapid Cycle Real-Time PCR: Methods and Applications. Springer Press, Heidelberg. pp. 21–34. 4. Tichopad,A., Dilger,M., Schwarz,G. and Pfaffl,M. (2003) Standardized determination of real-time PCR efficiency from a single reaction set-up. Nucleic Acids Res., 31, e122. 5. Swillens,S., Goffard,J., Marechal,Y., de Kerchove d’Exaerde,A. and El Housni,H. (2004) Instant evaluation of the absolute initial number of cDNA copies from a single real-time PCR curve. Nucleic Acids Res., 32, e56. 6. Ramakers,C., Ruijter,J.M., Lekanne Deprez,R.H. and Moorman,A. (2003) Assumption-free analysis of quantitative real-time polymer- ase chain reaction (PCR) data. Neurosci. Lett., 339, 62–66. 7. Peirson,S.N., Butler,J.N. and Foster,R.G. (2003) Experimental validation of novel and conventional approaches to quantitative real-time PCR data analysis. Nucleic Acids Res., 31, e73. 8. Tang,N., Huang,S., Salituro,J., Mak,W., Cloherty,G., Johanson,J., Yu,H.L., Schneider,G., Robinson,J., Hackett,J.Jr et al. (2007) A real time HIV-1 viral load assay for automated quantitation of HIV-1 RNA in genetically diverse group M subtypes A-H, group 0 and group N samples. J. Virol. Methods [Epub ahead of print, doi:10.1016/j.jviromet.2007.07.003]. 9. Bar,T., Stahlberg,A., Muszta,A. and Kubista,M. (2003) Kinetic out- lier detection (KOD) in real-time PCR. Nucleic Acids Res., 31, e105. 10. Marras,S., Kramer,F. and Tyagi,S. (2002) Efficiencies of fluores- cence resonance energy transfer and contact-mediated quenching in oligonucleotide probes. Nucleic Acids Res., 30, e122. 11. Michelin,B., Muller,Z., Stelzl,E., Marth,E. and Kessler,H. (2007) Evaluation of the Abbott real time HCV assay for quantitative detection of hepatitis C virus RNA. J. Clin. Virol., 38, 96–100. 2.2 2.4 2.6 2.8 3 3.2 NormalizedFAM 0 5 10 15 20 25 30 35 40 −0.2 0 0.2 0.4 0.6 0.8 BaselinedFAM 0 5 10 15 20 25 30 35 40 2 4 6 8 10 12 Ct FCNA–Ct A B C Well G1 Well G1 Well G1 Cycle 0 5 10 15 20 25 30 35 40 Cycle Figure 8. Baseline anomaly of a RealTime HCV assay response. (A) Amplification plots of the HCV normalized FAM fluorescence versus cycle number. Solid line is actual response of well G1. Dashed line represents the same response with discontinuity removed. (B) Corresponding plots after Savitsky–Golay smoothing and baselin- ing. (C) Plot of FCNA – Ct cycle difference versus Ct value for the 28 positive responses in the same PCR run. PAGE 7 OF 7 Nucleic Acids Research, 2008, Vol. 36, No. 14 e91
  • 8. Reproduced with permission of the copyright owner. Further reproduction prohibited without permission.