SlideShare una empresa de Scribd logo
1 de 1
Descargar para leer sin conexión
220
                                     France
I: Country/Economy Profiles


                                     Key indicators                                                                                                                                4.2     Investment................................................................................43.6       27
                                     Population (millions) .................................................................................. 63.2                                 4.2.1   Ease of protecting investors*.........................................................46.7           60
                                     GDP per capita, PPP$ ........................................................................... 35,048.8                                     4.2.2   Market capitalization, % GDP.........................................................75.3            29
                                                                                                                                                                                   4.2.3   Total value of stocks traded, % GDP ..........................................32.3                   29
                                     GDP (US$ billions) .................................................................................. 2,808.3
                                                                                                                                                                                   4.2.4   Venture capital deals/tr PPP$ GDP ..........................................102.4                    12
                                                                                                                                                    Score (0–100)                  4.3     Trade & competition ..............................................................64.1 66
                                                                                                                                              or value (hard data)          Rank   4.3.1   Applied tariff rate, weighted mean, % ........................................1.6 11
                                     Global Innovation Index 2012 (out of 141)......................... 51.8                                                                24     4.3.2   Non-agricultural mkt access weighted tariff, % ....................2.0 92
                                     Innovation Output Sub-Index ........................................................................................... 44.4            26    4.3.3   Imports of goods & services, % GDP ........................................27.8 114
                                     Innovation Input Sub-Index .............................................................................................. 59.1          22    4.3.4   Exports of goods & services, % GDP .........................................25.5 107
                                     Innovation Efficiency Index ................................................................................................. 0.8         64    4.3.5   Intensity of local competition† ....................................................78.5 11
                                     Global Innovation Index 2011 (out of 125) ..............................................................................                22
                                     GII 2012 rank among GII 2011 economies (125) ......................................................................                     23    5       Business sophistication ..............................51.3 26
                                                                                                                                                                                   5.1     Knowledge workers ................................................................75.5                15
                                     1               Institutions ....................................................82.7 20                                                      5.1.1   Knowledge-intensive employment, % ....................................40.8                            16
                                     1.1             Political environment ............................................................82.6                                  22    5.1.2   Firms offering formal training, % firms ......................................n/a                      n/a
                                     1.1.1           Political stability*....................................................................................82.2            31    5.1.3   R&D performed by business, % ....................................................61.9                 21
                                     1.1.2           Government effectiveness* ............................................................78.8                               20    5.1.4   R&D financed by business, % ........................................................50.7               21
                                     1.1.3           Press freedom*........................................................................................86.8              34    5.1.5   GMAT mean score..............................................................................562.5    25
                                     1.2             Regulatory environment.......................................................89.7                                       20    5.1.6   GMAT test takers/mn pop. 20–34 ............................................356.2                      13
                                     1.2.1           Regulatory quality* ..............................................................................85.7                  22    5.2     Innovation linkages ...............................................................36.7              63
                                     1.2.2           Rule of law* ...............................................................................................88.2        19    5.2.1   University/industry research collaboration† ........................54.0                             34
                                     1.2.3           Cost of redundancy dismissal, salary weeks ........................11.8                                                 50    5.2.2   State of cluster development† .....................................................54.9              25
                                     1.3             Business environment ...........................................................76.0                                    22    5.2.3   R&D financed by abroad, % ...............................................................8.0          42
                                     1.3.1           Ease of starting a business* ............................................................86.3                           20    5.2.4   JV–strategic alliance deals/tr PPP$ GDP .................................32.5                        47
                                     1.3.2           Ease of resolving insolvency* ........................................................71.9                              40    5.2.5   PCT patent filings with foreign inventor, % ..........................26.1                            70
                                     1.3.3           Ease of paying taxes* ..........................................................................69.7                    43    5.3     Knowledge absorption ..........................................................41.6 47
                                                                                                                                                                                   5.3.1   Royalty & license fees payments/th GDP ..................................2.2 46
                                     2               Human capital & research ..........................55.1 17                                                                    5.3.2   High-tech imports less re-imports, % ......................................14.8 22
                                     2.1             Education..................................................................................63.0                         26
                                                                                                                                                                                   5.3.3   Computer & comm. service imports, % ..................................42.0 32
                                     2.1.1           Current expenditure on education, % GNI ..............................5.0                                               39
                                                                                                                                                                                   5.3.4   FDI net inflows, % GDP .........................................................................1.3 101
                                     2.1.2           Public expenditure/pupil, % GDP/cap .....................................24.4                                           30
                                     2.1.3           School life expectancy, years .........................................................16.1                             17    6       Knowledge & technology outputs ...........45.5 23
                                     2.1.4           PISA scales in reading, maths, & science .............................496.9                                             22    6.1     Knowledge creation ...............................................................45.5               30
                                     2.1.5           Pupil-teacher ratio, secondary ......................................................12.5                               55    6.1.1   Domestic resident patent ap/bn PPP$ GDP ........................11.4                                 17
                                     2.2             Tertiary education ..................................................................49.2                               19    6.1.2   PCT resident patent ap/bn PPP$ GDP ........................................3.5                       13
                                     2.2.1           Tertiary enrolment, % gross ............................................................54.5                            38    6.1.3   Domestic res utility model ap/bn PPP$ GDP .........................0.1                               59
                                     2.2.2           Graduates in science & engineering, % ..................................26.2                                            20    6.1.4   Scientific & technical articles/bn PPP$ GDP.........................15.3                              25
                                     2.2.3           Tertiary inbound mobility, %..........................................................11.5                              14    6.2     Knowledge impact .................................................................40.4               42
                                     2.2.4           Gross tertiary outbound enrolment, % ......................................1.3                                          65    6.2.1   Growth rate of PPP$ GDP/worker, % ...........................................1.6                     83
                                     2.3             Research & development (R&D) ..........................................53.0                                             18    6.2.2   New businesses/th pop. 15–64.......................................................3.1               32
                                     2.3.1           Researchers, headcounts/mn pop. ..................................... 4,661.6                                           19    6.2.3   Computer software spending, % GDP........................................0.6                         16
                                     2.3.2           Gross expenditure on R&D, % GDP ...............................................2.2                                      14    6.2.4   ISO 9001 quality certificates/bn PPP$ GDP ..........................13.9                              37
                                     2.3.3           Quality of scientific research institutions† ............................72.5                                            15    6.3     Knowledge diffusion ..............................................................50.7                21
                                                                                                                                                                                   6.3.1   Royalty & license fees receipts/th GDP.......................................4.1                     16
                                     3               Infrastructure................................................54.5 20                                                         6.3.2   High-tech exports less re-exports, %........................................20.6                      8
                                     3.1             Information & communication technologies (ICT) ........70.1                                                             15
                                                                                                                                                                                   6.3.3   Computer & comm. service exports, % ..................................40.8                           39
                                     3.1.1           ICT access*.................................................................................................77.5        13
                                                                                                                                                                                   6.3.4   FDI net outflows, % GDP .....................................................................3.3      18
                                     3.1.2           ICT use* .......................................................................................................57.4    18
                                     3.1.3           Government’s online service* .......................................................87.6                                 8    7       Creative outputs ..........................................43.3 30
                                     3.1.4           E-participation*.......................................................................................57.9             25    7.1     Creative intangibles ...............................................................42.1             62
                                     3.2             General infrastructure ...........................................................51.8                                  21    7.1.1   Domestic res trademark reg/bn PPP$ GDP ..........................11.2                                76
                                     3.2.1           Electricity output, kWh/cap ..................................................... 9,015.8                               15    7.1.2   Madrid resident trademark reg/bn PPP$ GDP.......................1.7                                  10
                                     3.2.2           Electricity consumption, kWh/cap ...................................... 7,893.8                                         21    7.1.3   ICT & business model creation† ..................................................70.2                14
                                     3.2.3           Quality of trade & transport infrastructure* .........................75.0                                              13    7.1.4   ICT & organizational model creation† .....................................55.8                       39
                                     3.2.4           Gross capital formation, % GDP ...................................................19.4                                  98    7.2     Creative goods & services .....................................................36.2                  30
                                     3.3             Ecological sustainability .......................................................41.6                                   36    7.2.1   Recreation & culture consumption, % ........................................9.2                      19
  THE GLOBAL INNOVATION INDEX 2012


                                     3.3.1           GDP/unit of energy use, 2000 PPP$/kg oil eq .......................6.5                                                  44    7.2.2   National feature films/mn pop. 15–69........................................4.8                       21
                                     3.3.2           Environmental performance*........................................................69.0                                   6    7.2.3   Paid-for dailies, circulation/th pop. 15–69 ..........................170.9                          29
                                     3.3.3           ISO 14001 environmental certificates/bn PPP$ GDP ........2.5                                                             38    7.2.4   Creative goods exports, %..................................................................3.0       26
                                                                                                                                                                                   7.2.5   Creative services exports, % ..............................................................2.1       59
                                     4               Market sophistication .................................52.0 29                                                                7.3     Online creativity ......................................................................52.7         23
                                     4.1             Credit .........................................................................................48.2                    29
                                                                                                                                                                                   7.3.1   Generic top-level domains (TLDs)/th pop. 15–69............39.9                                       20
                                     4.1.1           Ease of getting credit* .......................................................................57.7                     43
                                                                                                                                                                                   7.3.2   Country-code TLDs/th pop. 15–69 ............................................55.3                     30
                                     4.1.2           Domestic credit to private sector, % GDP ..........................114.4                                                26
                                                                                                                                                                                   7.3.3   Wikipedia monthly edits/mn pop. 15–69....................... 8,893.1                                 11
                                     4.1.3           Microfinance gross loans, % GDP .................................................n/a                                    n/a
                                                                                                                                                                                   7.3.4   Video uploads on YouTube/pop. 15–69 .................................70.6                            22

Más contenido relacionado

La actualidad más candente (13)

Store pub app_toc
Store pub app_tocStore pub app_toc
Store pub app_toc
 
Financial crisis manual
Financial crisis manualFinancial crisis manual
Financial crisis manual
 
Us gaap v_ifrs_comparison_document-june08
Us gaap v_ifrs_comparison_document-june08Us gaap v_ifrs_comparison_document-june08
Us gaap v_ifrs_comparison_document-june08
 
07/27/06 GNW Q2/06
07/27/06 GNW Q2/0607/27/06 GNW Q2/06
07/27/06 GNW Q2/06
 
Summary report
Summary reportSummary report
Summary report
 
Development Policy Review 2014 Indonesia: Avoiding The Trap
Development Policy Review 2014  Indonesia: Avoiding The TrapDevelopment Policy Review 2014  Indonesia: Avoiding The Trap
Development Policy Review 2014 Indonesia: Avoiding The Trap
 
GNW Q2-07_Financial_Supplement
GNW Q2-07_Financial_SupplementGNW Q2-07_Financial_Supplement
GNW Q2-07_Financial_Supplement
 
Infrastructure financing-india
Infrastructure financing-indiaInfrastructure financing-india
Infrastructure financing-india
 
morgan stanley Proxy Statements
morgan stanley Proxy Statementsmorgan stanley Proxy Statements
morgan stanley Proxy Statements
 
Mind the Gap Report Overview
Mind the Gap Report OverviewMind the Gap Report Overview
Mind the Gap Report Overview
 
1 financial markets
1 financial markets1 financial markets
1 financial markets
 
Financial Markets
Financial MarketsFinancial Markets
Financial Markets
 
Forex India
Forex IndiaForex India
Forex India
 

Similar a Gii 2012 france innovation profile

The informal sector in waste recycling in egypt2
The informal sector in waste recycling in egypt2The informal sector in waste recycling in egypt2
The informal sector in waste recycling in egypt2
ACORN International
 
The informal sector in waste recycling in egypt2
The informal sector in waste recycling in egypt2The informal sector in waste recycling in egypt2
The informal sector in waste recycling in egypt2
ACORN International
 
Forecasting, Financing & Fast Tracking Your Business Growth
Forecasting, Financing & Fast Tracking Your Business GrowthForecasting, Financing & Fast Tracking Your Business Growth
Forecasting, Financing & Fast Tracking Your Business Growth
Venugopal Rao Pendyala
 
Biz Plan Smart Solution
Biz Plan Smart SolutionBiz Plan Smart Solution
Biz Plan Smart Solution
Vinh Nguyen
 
20090712 commodities in the if study undp exeuctive summarywith covers
20090712 commodities in the if study undp exeuctive summarywith covers20090712 commodities in the if study undp exeuctive summarywith covers
20090712 commodities in the if study undp exeuctive summarywith covers
Lichia Saner-Yiu
 
Yellowhead Brewery FINAL (2)
Yellowhead Brewery FINAL (2)Yellowhead Brewery FINAL (2)
Yellowhead Brewery FINAL (2)
Alastair Lillico
 
Reinventing the City
Reinventing the CityReinventing the City
Reinventing the City
Dean Pallen
 
Business proposal coffee shop in Canada
Business proposal coffee shop in CanadaBusiness proposal coffee shop in Canada
Business proposal coffee shop in Canada
NewGate India
 

Similar a Gii 2012 france innovation profile (20)

The informal sector in waste recycling in egypt2
The informal sector in waste recycling in egypt2The informal sector in waste recycling in egypt2
The informal sector in waste recycling in egypt2
 
The informal sector in waste recycling in egypt2
The informal sector in waste recycling in egypt2The informal sector in waste recycling in egypt2
The informal sector in waste recycling in egypt2
 
Forecasting, Financing & Fast Tracking Your Business Growth
Forecasting, Financing & Fast Tracking Your Business GrowthForecasting, Financing & Fast Tracking Your Business Growth
Forecasting, Financing & Fast Tracking Your Business Growth
 
Buisness Plan V1
Buisness Plan V1Buisness Plan V1
Buisness Plan V1
 
WEF Puerto Rico 2011
WEF Puerto Rico 2011WEF Puerto Rico 2011
WEF Puerto Rico 2011
 
Biz Plan Smart Solution
Biz Plan Smart SolutionBiz Plan Smart Solution
Biz Plan Smart Solution
 
The Economics of Sustainability in the Comemrcial Real Estate Sector
The Economics of Sustainability in the Comemrcial Real Estate SectorThe Economics of Sustainability in the Comemrcial Real Estate Sector
The Economics of Sustainability in the Comemrcial Real Estate Sector
 
20090712 commodities in the if study undp exeuctive summarywith covers
20090712 commodities in the if study undp exeuctive summarywith covers20090712 commodities in the if study undp exeuctive summarywith covers
20090712 commodities in the if study undp exeuctive summarywith covers
 
Evr2008
Evr2008Evr2008
Evr2008
 
Doing business in india
Doing business in indiaDoing business in india
Doing business in india
 
Yellowhead Brewery FINAL (2)
Yellowhead Brewery FINAL (2)Yellowhead Brewery FINAL (2)
Yellowhead Brewery FINAL (2)
 
Coinaid earth pilot
Coinaid earth pilotCoinaid earth pilot
Coinaid earth pilot
 
Reinventing the City
Reinventing the CityReinventing the City
Reinventing the City
 
Sample Global Boil in Bag Market R
Sample Global Boil in Bag Market R Sample Global Boil in Bag Market R
Sample Global Boil in Bag Market R
 
Bioteksa Model For Technology And Innovation Management
Bioteksa Model For Technology And Innovation ManagementBioteksa Model For Technology And Innovation Management
Bioteksa Model For Technology And Innovation Management
 
Business proposal coffee shop in Canada
Business proposal coffee shop in CanadaBusiness proposal coffee shop in Canada
Business proposal coffee shop in Canada
 
6461 1
6461 16461 1
6461 1
 
6461 1
6461 16461 1
6461 1
 
Sample Global Jump Starter Market
Sample Global Jump Starter Market  Sample Global Jump Starter Market
Sample Global Jump Starter Market
 
Sample Global Jump Starter
Sample Global Jump Starter  Sample Global Jump Starter
Sample Global Jump Starter
 

Más de Amaury de Buchet

JustMapIt! Days : Atelier cartographie grand public
JustMapIt! Days : Atelier cartographie grand publicJustMapIt! Days : Atelier cartographie grand public
JustMapIt! Days : Atelier cartographie grand public
Amaury de Buchet
 

Más de Amaury de Buchet (20)

161006 web intelligence how to evaluate information
161006 web intelligence   how to evaluate information161006 web intelligence   how to evaluate information
161006 web intelligence how to evaluate information
 
Options d hebergement a Paris pour entrepreneurs startups freelances et agenc...
Options d hebergement a Paris pour entrepreneurs startups freelances et agenc...Options d hebergement a Paris pour entrepreneurs startups freelances et agenc...
Options d hebergement a Paris pour entrepreneurs startups freelances et agenc...
 
140211 Atelier start up ou et comment heberger sa startup a moindre frais bur...
140211 Atelier start up ou et comment heberger sa startup a moindre frais bur...140211 Atelier start up ou et comment heberger sa startup a moindre frais bur...
140211 Atelier start up ou et comment heberger sa startup a moindre frais bur...
 
130220 how to_search_online_to_validate_a_business_opportunity.pptx
130220 how to_search_online_to_validate_a_business_opportunity.pptx130220 how to_search_online_to_validate_a_business_opportunity.pptx
130220 how to_search_online_to_validate_a_business_opportunity.pptx
 
121213 intracnf olivier basso sabine henrichfreise
121213 intracnf olivier basso sabine henrichfreise121213 intracnf olivier basso sabine henrichfreise
121213 intracnf olivier basso sabine henrichfreise
 
121213 intracnf e diplomacy richard boly
121213 intracnf e diplomacy richard boly121213 intracnf e diplomacy richard boly
121213 intracnf e diplomacy richard boly
 
121213 intracnf ketan makwana
121213 intracnf ketan makwana121213 intracnf ketan makwana
121213 intracnf ketan makwana
 
121213 intracnf team academy nl
121213 intracnf team academy nl121213 intracnf team academy nl
121213 intracnf team academy nl
 
121213 intracnf mondragon
121213 intracnf mondragon121213 intracnf mondragon
121213 intracnf mondragon
 
121213 intracnf stefan lindegaard
121213 intracnf stefan lindegaard121213 intracnf stefan lindegaard
121213 intracnf stefan lindegaard
 
121213 intracnf heather dietz social entrepreneurship
121213 intracnf heather dietz social entrepreneurship121213 intracnf heather dietz social entrepreneurship
121213 intracnf heather dietz social entrepreneurship
 
121213 intracnf makerstreet joris van heukelom
121213 intracnf makerstreet joris van heukelom121213 intracnf makerstreet joris van heukelom
121213 intracnf makerstreet joris van heukelom
 
121213 intracnf microsoft garage dirk junghanns
121213 intracnf microsoft garage dirk junghanns121213 intracnf microsoft garage dirk junghanns
121213 intracnf microsoft garage dirk junghanns
 
Presentation barcamp.pptx
Presentation barcamp.pptxPresentation barcamp.pptx
Presentation barcamp.pptx
 
120330 ignite paris 16 quantified self adb
120330 ignite paris 16 quantified self adb120330 ignite paris 16 quantified self adb
120330 ignite paris 16 quantified self adb
 
120208 e20 s open innovation workshop.ppt
120208 e20 s open innovation workshop.ppt120208 e20 s open innovation workshop.ppt
120208 e20 s open innovation workshop.ppt
 
JustMapIt! Days : Atelier cartographie grand public
JustMapIt! Days : Atelier cartographie grand publicJustMapIt! Days : Atelier cartographie grand public
JustMapIt! Days : Atelier cartographie grand public
 
Customer Experience Lifecycle
Customer Experience LifecycleCustomer Experience Lifecycle
Customer Experience Lifecycle
 
Useo Etude Rse Tome2 V1 100126
Useo Etude Rse Tome2 V1 100126Useo Etude Rse Tome2 V1 100126
Useo Etude Rse Tome2 V1 100126
 
Le gratuit une utopie ?
Le gratuit une utopie ?Le gratuit une utopie ?
Le gratuit une utopie ?
 

Gii 2012 france innovation profile

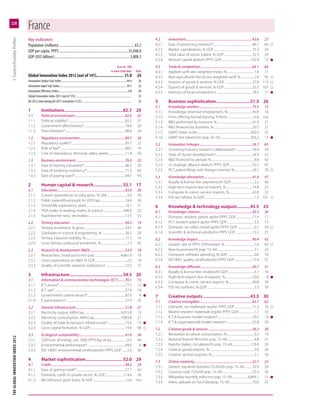
  • 1. 220 France I: Country/Economy Profiles Key indicators 4.2 Investment................................................................................43.6 27 Population (millions) .................................................................................. 63.2 4.2.1 Ease of protecting investors*.........................................................46.7 60 GDP per capita, PPP$ ........................................................................... 35,048.8 4.2.2 Market capitalization, % GDP.........................................................75.3 29 4.2.3 Total value of stocks traded, % GDP ..........................................32.3 29 GDP (US$ billions) .................................................................................. 2,808.3 4.2.4 Venture capital deals/tr PPP$ GDP ..........................................102.4 12 Score (0–100) 4.3 Trade & competition ..............................................................64.1 66 or value (hard data) Rank 4.3.1 Applied tariff rate, weighted mean, % ........................................1.6 11 Global Innovation Index 2012 (out of 141)......................... 51.8 24 4.3.2 Non-agricultural mkt access weighted tariff, % ....................2.0 92 Innovation Output Sub-Index ........................................................................................... 44.4 26 4.3.3 Imports of goods & services, % GDP ........................................27.8 114 Innovation Input Sub-Index .............................................................................................. 59.1 22 4.3.4 Exports of goods & services, % GDP .........................................25.5 107 Innovation Efficiency Index ................................................................................................. 0.8 64 4.3.5 Intensity of local competition† ....................................................78.5 11 Global Innovation Index 2011 (out of 125) .............................................................................. 22 GII 2012 rank among GII 2011 economies (125) ...................................................................... 23 5 Business sophistication ..............................51.3 26 5.1 Knowledge workers ................................................................75.5 15 1 Institutions ....................................................82.7 20 5.1.1 Knowledge-intensive employment, % ....................................40.8 16 1.1 Political environment ............................................................82.6 22 5.1.2 Firms offering formal training, % firms ......................................n/a n/a 1.1.1 Political stability*....................................................................................82.2 31 5.1.3 R&D performed by business, % ....................................................61.9 21 1.1.2 Government effectiveness* ............................................................78.8 20 5.1.4 R&D financed by business, % ........................................................50.7 21 1.1.3 Press freedom*........................................................................................86.8 34 5.1.5 GMAT mean score..............................................................................562.5 25 1.2 Regulatory environment.......................................................89.7 20 5.1.6 GMAT test takers/mn pop. 20–34 ............................................356.2 13 1.2.1 Regulatory quality* ..............................................................................85.7 22 5.2 Innovation linkages ...............................................................36.7 63 1.2.2 Rule of law* ...............................................................................................88.2 19 5.2.1 University/industry research collaboration† ........................54.0 34 1.2.3 Cost of redundancy dismissal, salary weeks ........................11.8 50 5.2.2 State of cluster development† .....................................................54.9 25 1.3 Business environment ...........................................................76.0 22 5.2.3 R&D financed by abroad, % ...............................................................8.0 42 1.3.1 Ease of starting a business* ............................................................86.3 20 5.2.4 JV–strategic alliance deals/tr PPP$ GDP .................................32.5 47 1.3.2 Ease of resolving insolvency* ........................................................71.9 40 5.2.5 PCT patent filings with foreign inventor, % ..........................26.1 70 1.3.3 Ease of paying taxes* ..........................................................................69.7 43 5.3 Knowledge absorption ..........................................................41.6 47 5.3.1 Royalty & license fees payments/th GDP ..................................2.2 46 2 Human capital & research ..........................55.1 17 5.3.2 High-tech imports less re-imports, % ......................................14.8 22 2.1 Education..................................................................................63.0 26 5.3.3 Computer & comm. service imports, % ..................................42.0 32 2.1.1 Current expenditure on education, % GNI ..............................5.0 39 5.3.4 FDI net inflows, % GDP .........................................................................1.3 101 2.1.2 Public expenditure/pupil, % GDP/cap .....................................24.4 30 2.1.3 School life expectancy, years .........................................................16.1 17 6 Knowledge & technology outputs ...........45.5 23 2.1.4 PISA scales in reading, maths, & science .............................496.9 22 6.1 Knowledge creation ...............................................................45.5 30 2.1.5 Pupil-teacher ratio, secondary ......................................................12.5 55 6.1.1 Domestic resident patent ap/bn PPP$ GDP ........................11.4 17 2.2 Tertiary education ..................................................................49.2 19 6.1.2 PCT resident patent ap/bn PPP$ GDP ........................................3.5 13 2.2.1 Tertiary enrolment, % gross ............................................................54.5 38 6.1.3 Domestic res utility model ap/bn PPP$ GDP .........................0.1 59 2.2.2 Graduates in science & engineering, % ..................................26.2 20 6.1.4 Scientific & technical articles/bn PPP$ GDP.........................15.3 25 2.2.3 Tertiary inbound mobility, %..........................................................11.5 14 6.2 Knowledge impact .................................................................40.4 42 2.2.4 Gross tertiary outbound enrolment, % ......................................1.3 65 6.2.1 Growth rate of PPP$ GDP/worker, % ...........................................1.6 83 2.3 Research & development (R&D) ..........................................53.0 18 6.2.2 New businesses/th pop. 15–64.......................................................3.1 32 2.3.1 Researchers, headcounts/mn pop. ..................................... 4,661.6 19 6.2.3 Computer software spending, % GDP........................................0.6 16 2.3.2 Gross expenditure on R&D, % GDP ...............................................2.2 14 6.2.4 ISO 9001 quality certificates/bn PPP$ GDP ..........................13.9 37 2.3.3 Quality of scientific research institutions† ............................72.5 15 6.3 Knowledge diffusion ..............................................................50.7 21 6.3.1 Royalty & license fees receipts/th GDP.......................................4.1 16 3 Infrastructure................................................54.5 20 6.3.2 High-tech exports less re-exports, %........................................20.6 8 3.1 Information & communication technologies (ICT) ........70.1 15 6.3.3 Computer & comm. service exports, % ..................................40.8 39 3.1.1 ICT access*.................................................................................................77.5 13 6.3.4 FDI net outflows, % GDP .....................................................................3.3 18 3.1.2 ICT use* .......................................................................................................57.4 18 3.1.3 Government’s online service* .......................................................87.6 8 7 Creative outputs ..........................................43.3 30 3.1.4 E-participation*.......................................................................................57.9 25 7.1 Creative intangibles ...............................................................42.1 62 3.2 General infrastructure ...........................................................51.8 21 7.1.1 Domestic res trademark reg/bn PPP$ GDP ..........................11.2 76 3.2.1 Electricity output, kWh/cap ..................................................... 9,015.8 15 7.1.2 Madrid resident trademark reg/bn PPP$ GDP.......................1.7 10 3.2.2 Electricity consumption, kWh/cap ...................................... 7,893.8 21 7.1.3 ICT & business model creation† ..................................................70.2 14 3.2.3 Quality of trade & transport infrastructure* .........................75.0 13 7.1.4 ICT & organizational model creation† .....................................55.8 39 3.2.4 Gross capital formation, % GDP ...................................................19.4 98 7.2 Creative goods & services .....................................................36.2 30 3.3 Ecological sustainability .......................................................41.6 36 7.2.1 Recreation & culture consumption, % ........................................9.2 19 THE GLOBAL INNOVATION INDEX 2012 3.3.1 GDP/unit of energy use, 2000 PPP$/kg oil eq .......................6.5 44 7.2.2 National feature films/mn pop. 15–69........................................4.8 21 3.3.2 Environmental performance*........................................................69.0 6 7.2.3 Paid-for dailies, circulation/th pop. 15–69 ..........................170.9 29 3.3.3 ISO 14001 environmental certificates/bn PPP$ GDP ........2.5 38 7.2.4 Creative goods exports, %..................................................................3.0 26 7.2.5 Creative services exports, % ..............................................................2.1 59 4 Market sophistication .................................52.0 29 7.3 Online creativity ......................................................................52.7 23 4.1 Credit .........................................................................................48.2 29 7.3.1 Generic top-level domains (TLDs)/th pop. 15–69............39.9 20 4.1.1 Ease of getting credit* .......................................................................57.7 43 7.3.2 Country-code TLDs/th pop. 15–69 ............................................55.3 30 4.1.2 Domestic credit to private sector, % GDP ..........................114.4 26 7.3.3 Wikipedia monthly edits/mn pop. 15–69....................... 8,893.1 11 4.1.3 Microfinance gross loans, % GDP .................................................n/a n/a 7.3.4 Video uploads on YouTube/pop. 15–69 .................................70.6 22