Korepatentistaitsitkleri
•Descargar como XLS, PDF•
0 recomendaciones•296 vistas

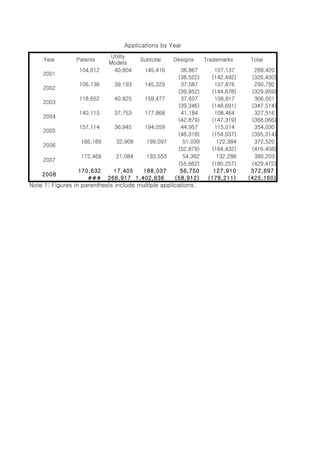
The document provides statistics on patent, utility model, design, and trademark applications filed in Korea from 1947 to 2008. Some key details: - Patent applications by Koreans increased from 236 in 1947 to over 127,000 in 2008, while foreign patent applications in Korea increased from 0 to over 43,000. - In 2007, most patent applications were filed online (97.2%), while utility model applications were mostly filed online (82.7%) and design applications were mostly filed in other formats than online or paper (90.1%). - The proportion of Korean patent applications decreased from 100% in early years to 74.5% in 2008, while foreign applications increased from 0% to 25.5

Recomendados
Más contenido relacionado
La actualidad más candente
La actualidad más candente (18)
Similar a Korepatentistaitsitkleri
Similar a Korepatentistaitsitkleri (20)
Más de Ali CAVUSOGLU
Más de Ali CAVUSOGLU (20)
Último
Último (20)
Korepatentistaitsitkleri
- 1. Applications by Year Utility Year Patents Subtotal Designs Trademarks Total Models 104,612 40,804 145,416 36,867 107,137 289,420 2001 (38,522) (142,492) (326,430) 106,136 39,193 145,329 37,587 107,876 290,792 2002 (39,952) (144,678) (329,959) 118,652 40,825 159,477 37,607 108,917 306,001 2003 (39,346) (148,691) (347,514) 140,115 37,753 177,868 41,184 108,464 327,516 2004 (42,879) (147,319) (368,066) 157,114 36,945 194,059 44,957 115,014 354,030 2005 (46,318) (154,937) (395,314) 166,189 32,908 199,097 51,039 122,384 372,520 2006 (52,879) (164,432) (416,408) 172,469 21,084 193,553 54,362 132,288 380,203 2007 (55,662) (180,257) (429,472) 170,632 17,405 188,037 56,750 127,910 372,697 2008 ### 266,917 1,402,836 (58,912) (178,211) (425,160) Note 1: Figures in parenthesis include multiple applications.
- 2. Applications in 2007 by type of media Patents Utility Models Designs Month Floppy Floppy Paper On-line Paper On-line Paper Disk Disk 1 399 12,468 345 1,468 557 2 429 1 12,347 289 1,287 565 3 446 13,443 319 1,568 485 4 435 12,073 302 1,505 439 5 403 13,369 292 1,584 481 6 445 14,611 258 1,542 376 7 406 1 13,482 654 1,450 531 8 416 13,276 392 1,324 326 9 312 11,798 203 1,145 328 10 385 14,697 215 1,442 443 11 387 15,637 186 1,475 492 12 317 20,486 183 1,656 383 Total 4,780 2 167,687 3,638 17,446 5,406 Proportion 2.8% 0.0% 97.2% 17.3% 0.0% 82.7% 9.9%
- 3. Designs Trademarks Others On-line Paper Others On-line 4,056 1,199 11,154 3,773 997 1 9,428 4,543 1,069 10,102 4,411 1,093 10,493 4,202 1,153 10,227 4,420 1,003 10,082 4,160 1,073 10,734 3,894 994 9,550 3,164 763 7,716 4,164 1,192 10,037 3,866 926 10,808 4,303 778 9,716 48,956 12,240 1 120,047 0.0% 90.1% 9.3% 0.0% 90.7%
- 4. Applications by origin Korean Foreign Classification Year Total Applications Proportion Applications Proportion 1947 236 100.0% 0.0% 236 1948 169 100.0% 0.0% 169 1949 233 100.0% 0.0% 233 1950 126 100.0% 0.0% 126 1951 30 100.0% 0.0% 30 1952 91 100.0% 0.0% 91 1953 68 89.5% 8 10.5% 76 1954 127 96.2% 5 3.8% 132 1955 144 92.3% 12 7.7% 156 1956 275 95.8% 12 4.2% 287 1957 443 94.5% 26 5.5% 469 1958 510 91.9% 45 8.1% 555 1959 634 90.2% 69 9.8% 703 1960 545 89.2% 66 10.8% 611 1961 800 93.2% 58 6.8% 858 1962 714 91.3% 68 8.7% 782 1963 670 86.9% 101 13.1% 771 1964 744 81.9% 164 18.1% 908 1965 858 84.3% 160 15.7% 1,018 1966 883 83.3% 177 16.7% 1,060 1967 855 72.6% 322 27.4% 1,177 1968 1,086 74.2% 377 25.8% 1,463 1969 1,154 67.8% 547 32.2% 1,701 1970 1,207 65.4% 639 34.6% 1,846 1971 1,283 67.3% 623 32.7% 1,906 1972 1,377 69.0% 618 31.0% 1,995 1973 1,622 67.6% 776 32.4% 2,398 1974 1,093 24.5% 3,362 75.5% 4,455 1975 1,326 45.5% 1,588 54.5% 2,914 1976 1,436 44.0% 1,825 56.0% 3,261 1977 1,177 37.5% 1,962 62.5% 3,139 Patents 1978 994 24.8% 3,021 75.2% 4,015 1979 1,034 21.9% 3,688 78.1% 4,722 1980 1,241 24.5% 3,829 75.5% 5,070 1981 1,319 24.9% 3,984 75.1% 5,303 1982 1,556 26.3% 4,368 73.7% 5,924 1983 1,599 25.0% 4,795 75.0% 6,394 1984 2,014 23.3% 6,619 76.7% 8,633 1985 2,703 25.5% 7,884 74.5% 10,587 1986 3,641 28.5% 9,118 71.5% 12,759 1987 4,871 28.5% 12,191 71.5% 17,062 1988 5,696 28.4% 14,355 71.6% 20,051 1989 7,021 30.1% 16,294 69.9% 23,315 1990 9,082 35.2% 16,738 64.8% 25,820 1991 13,253 47.1% 14,879 52.9% 28,132 1992 15,952 51.3% 15,121 48.7% 31,073
- 5. 1993 21,459 58.8% 15,032 41.2% 36,491 1994 28,564 62.5% 17,148 37.5% 45,712 1995 59,236 75.5% 19,263 24.5% 78,499 1996 68,413 75.7% 21,913 24.3% 90,326 1997 67,346 72.6% 25,388 27.4% 92,734 1998 50,596 67.3% 24,592 32.7% 75,188 1999 55,970 69.4% 24,672 30.6% 80,642 2000 72,831 71.4% 29,179 28.6% 102,010 2001 73,714 70.5% 30,898 29.5% 104,612 2002 76,570 72.1% 29,566 27.9% 106,136 2003 90,313 76.1% 28,339 23.9% 118,652 2004 105,250 75.1% 34,865 24.9% 140,115 2005 122,188 75.9% 38,733 24.1% 160,921 2006 125,476 75.5% 40,713 24.5% 166,189 2007 128,701 74.6% 43,768 25.4% 172,469 2008 127,114 74.5% 43,518 25.5% 170,632 계 1,367,633 68.9% 618,081 31.1% 1,985,714 1947 237 100.0% 0.0% 237 1948 166 100.0% 0.0% 166 1949 229 100.0% 0.0% 229 1950 123 100.0% 0.0% 123 1951 29 100.0% 0.0% 29 1952 69 100.0% 0.0% 69 1953 152 100.0% 0.0% 152 1954 175 100.0% 0.0% 175 1955 281 100.0% 0.0% 281 1956 494 100.0% 0.0% 494 1957 758 100.0% 0.0% 758 1958 1,105 100.0% 0.0% 1,105 1959 1,395 100.0% 0.0% 1,395 1960 1,207 100.0% 0.0% 1,207 1961 1,683 100.0% 0.0% 1,683 1962 1,791 99.9% 2 0.1% 1,793 1963 1,788 99.9% 2 0.1% 1,790 1964 2,244 100.0% 0.0% 2,244 1965 2,818 98.9% 31 1.1% 2,849 1966 3,237 99.5% 15 0.5% 3,252 1967 3,585 99.7% 9 0.3% 3,594 1968 5,114 99.7% 15 0.3% 5,129 1969 5,562 99.8% 11 0.2% 5,573 1970 6,143 99.6% 24 0.4% 6,167 1971 6,789 99.7% 21 0.3% 6,810 1972 7,736 99.9% 11 0.1% 7,747 1973 7,536 99.7% 25 0.3% 7,561 1974 5,817 85.1% 1,016 14.9% 6,833 1975 7,052 96.7% 238 3.3% 7,290 1976 8,117 96.9% 261 3.1% 8,378 1977 7,199 94.7% 402 5.3% 7,601 Utility Models 1978 6,212 93.5% 433 6.5% 6,645 1979 7,215 90.7% 742 9.3% 7,957 1980 7,936 92.7% 622 7.3% 8,558 1981 8,519 94.0% 545 6.0% 9,064
- 6. Utility Models 1982 9,500 89.0% 1,169 11.0% 10,669 1983 10,345 90.1% 1,140 9.9% 11,485 1984 13,814 93.6% 951 6.4% 14,765 1985 17,615 95.0% 933 5.0% 18,548 1986 21,434 95.7% 967 4.3% 22,401 1987 23,684 95.6% 1,089 4.4% 24,773 1988 21,666 95.5% 1,011 4.5% 22,677 1989 20,655 95.9% 875 4.1% 21,530 1990 21,661 95.6% 993 4.4% 22,654 1991 25,125 97.0% 770 3.0% 25,895 1992 27,923 97.4% 742 2.6% 28,665 1993 31,505 97.8% 713 2.2% 32,218 1994 39,232 98.6% 574 1.4% 39,806 1995 59,362 99.2% 504 0.8% 59,866 1996 68,462 99.5% 360 0.5% 68,822 1997 45,450 99.2% 359 0.8% 45,809 1998 28,604 99.0% 292 1.0% 28,896 1999 30,344 99.0% 306 1.0% 30,650 2000 36,817 99.1% 346 0.9% 37,163 2001 40,389 99.0% 415 1.0% 40,804 2002 38,662 98.6% 531 1.4% 39,193 2003 40,174 98.4% 651 1.6% 40,825 2004 37,167 98.4% 586 1.6% 37,753 2005 36,534 98.3% 641 1.7% 37,175 2006 32,193 97.8% 715 2.2% 32,908 2007 20,632 97.9% 452 2.1% 21,084 2008 16,971 97.5% 434 2.5% 17,405 계 936,433 97.6% 22,944 2.4% 959,377 1947 23 100.0% 0.0% 23 1948 38 100.0% 0.0% 38 1949 46 100.0% 0.0% 46 1950 30 100.0% 0.0% 30 1951 3 100.0% 0.0% 3 1952 19 100.0% 0.0% 19 1953 62 100.0% 0.0% 62 1954 76 100.0% 0.0% 76 1955 216 100.0% 0.0% 216 1956 179 100.0% 0.0% 179 1957 276 100.0% 0.0% 276 1958 358 100.0% 0.0% 358 1959 361 99.7% 1 0.3% 362 1960 328 99.7% 1 0.3% 329 1961 465 98.9% 5 1.1% 470 1962 565 99.1% 5 0.9% 570 1963 726 99.6% 3 0.4% 729 1964 801 99.6% 3 0.4% 804 1965 824 99.9% 1 0.1% 825 1966 1,328 99.3% 10 0.7% 1,338 1967 1,901 99.1% 18 0.9% 1,919 1968 3,237 98.8% 40 1.2% 3,277 1969 4,509 99.4% 27 0.6% 4,536 1970 4,499 99.5% 23 0.5% 4,522
- 7. 1971 5,320 99.5% 28 0.5% 5,348 1972 5,980 99.8% 11 0.2% 5,991 1973 6,313 99.7% 20 0.3% 6,333 1974 6,193 99.6% 27 0.4% 6,220 1975 6,674 99.5% 33 0.5% 6,707 1976 5,995 99.6% 23 0.4% 6,018 1977 5,404 97.9% 116 2.1% 5,520 1978 6,148 98.1% 117 1.9% 6,265 1979 8,132 97.1% 239 2.9% 8,371 1980 9,736 96.6% 339 3.4% 10,075 1981 9,946 95.7% 448 4.3% 10,394 1982 11,231 94.4% 671 5.6% 11,902 1983 13,173 94.7% 744 5.3% 13,917 Designs 1984 14,951 94.2% 919 5.8% 15,870 1985 18,113 95.6% 836 4.4% 18,949 1986 17,735 94.7% 996 5.3% 18,731 1987 18,902 93.4% 1,329 6.6% 20,231 1988 16,737 92.2% 1,425 7.8% 18,162 1989 16,509 90.7% 1,687 9.3% 18,196 1990 17,406 92.7% 1,363 7.3% 18,769 1991 18,813 93.6% 1,284 6.4% 20,097 1992 21,760 94.8% 1,188 5.2% 22,948 1993 26,200 95.0% 1,368 5.0% 27,568 1994 27,664 95.3% 1,369 4.7% 29,033 1995 28,382 94.7% 1,596 5.3% 29,978 1996 28,091 94.1% 1,768 5.9% 29,859 1997 26,675 93.6% 1,816 6.4% 28,491 1998 22,144 93.3% 1,588 6.7% 23,732 (23,524) (93.5%) (1,631) (6.5%) (25,155) 1999 30,871 95.3% 1,533 4.7% 32,404 (33,011) (95.4%) (1,578) (4.6%) (34,589) 2000 32,110 94.9% 1,731 5.1% 33,841 (33,894) (95.0%) (1,784) (5.0%) (35,678) 2001 35,074 95.1% 1,793 4.9% 36,867 (36,657) (95.2%) (1,865) (4.8%) (38,522) 2002 35,399 94.2% 2,188 5.8% 37,587 (37,729) (94.4%) (2,223) (5.6%) (39,952) 2003 34,994 93.1% 2,613 6.9% 37,607 (36,689) (93.2%) (2,657) (6.8%) (39,346) 2004 38,041 92.4% 3,143 7.6% 41,184 (39,656) (92.5%) (3,223) (7.5%) (42,879) 2005 41,918 92.7% 3,304 7.3% 45,222 (43,247) (92.8%) (3,368) (7.2%) (46,615) 2006 48,018 94.1% 3,021 5.9% 51,039 (49,766) (94.1%) (3,113) (5.9%) (52,879) 2007 50,868 93.6% 3,494 6.4% 54,362 (52,055) (93.5%) (3,607) (6.5%) (55,662) 2008 52,786 93.0% 3,964 7.0% 56,750 (54,278) 92.1% (4,634) 7.9% 58,912 계 1,751,034 96.1% 71,397 3.9% 1,822,431 (859,559) (94.3%) (51,580) (5.7%) (911,139) 1947
- 8. 1948 1949 1950 599 100.0% 0.0% 599 1951 40 100.0% 0.0% 40 1952 151 100.0% 0.0% 151 1953 221 96.5% 8 3.5% 229 1954 225 60.0% 150 40.0% 375 1955 271 58.3% 194 41.7% 465 1956 869 79.9% 218 20.1% 1,087 1957 1,201 81.8% 268 18.2% 1,469 1958 1,129 78.5% 310 21.5% 1,439 1959 1,072 82.0% 235 18.0% 1,307 1960 916 75.8% 293 24.2% 1,209 1961 1,363 81.9% 302 18.1% 1,665 1962 1,554 82.2% 336 17.8% 1,890 1963 992 76.6% 303 23.4% 1,295 1964 1,435 77.8% 410 22.2% 1,845 1965 1,547 75.4% 506 24.6% 2,053 1966 1,869 67.9% 883 32.1% 2,752 1967 2,085 64.6% 1,143 35.4% 3,228 1968 2,704 40.9% 3,915 59.1% 6,619 1969 3,014 33.1% 6,097 66.9% 9,111 1970 3,105 60.6% 2,019 39.4% 5,124 1971 3,910 67.2% 1,906 32.8% 5,816 1972 4,804 69.8% 2,074 30.2% 6,878 1973 6,210 64.9% 3,352 35.1% 9,562 1974 6,265 69.2% 2,788 30.8% 9,053 1975 7,232 76.3% 2,244 23.7% 9,476 1976 8,381 75.9% 2,656 24.1% 11,037 1977 6,682 71.0% 2,733 29.0% 9,415 1978 7,913 65.7% 4,127 34.3% 12,040 1979 9,123 66.2% 4,666 33.8% 13,789 1980 8,785 64.8% 4,773 35.2% 13,558 1981 9,292 59.0% 6,463 41.0% 15,755 1982 12,238 62.6% 7,299 37.4% 19,537 1983 15,617 65.1% 8,365 34.9% 23,982 Trademarks 1984 15,924 64.3% 8,840 35.7% 24,764 1985 18,962 72.7% 7,107 27.3% 26,069 1986 20,446 72.9% 7,585 27.1% 28,031 1987 22,175 72.1% 8,587 27.9% 30,762 1988 24,201 69.8% 10,480 30.2% 34,681 1989 26,918 67.6% 12,914 32.4% 39,832 1990 33,564 71.7% 13,262 28.3% 46,826 1991 33,468 71.8% 13,144 28.2% 46,612 1992 33,163 73.5% 11,961 26.5% 45,124 1993 46,559 78.1% 13,034 21.9% 59,593 1994 56,319 77.6% 16,262 22.4% 72,581 1995 55,218 76.8% 16,634 23.2% 71,852 1996 66,441 78.1% 18,621 21.9% 85,062 1997 66,222 76.1% 20,843 23.9% 87,065 1998 42,901 74.7% 14,492 25.3% 57,393 (54,078) (72.9%) (20,136) (27.1%) (74,214)
- 9. 1999 71,262 81.6% 16,070 18.4% 87,332 (92,780) (79.1%) (24,505) (20.9%) (117,285) 2000 90,596 82.3% 19,477 17.7% 110,073 (120,419) (79.6%) (30,792) (20.4%) (151,211) 2001 86,408 80.7% 20,729 19.3% 107,137 (111,105) (78.0%) (31,387) (22.0%) (142,492) 2002 90,014 83.4% 17,862 16.6% 107,876 (116,760) (80.7%) (27,918) (19.3%) (144,678) 2003 92,368 84.8% 16,549 15.2% 108,917 (122,080) (82.1%) (26,611) (17.9%) (148,691) 2004 91,935 84.8% 16,529 15.2% 108,464 (119,836) (81.3%) (27,483) (18.7%) (147,319) 2005 99,435 85.8% 16,454 14.2% 115,889 (129,635) (83.0%) (26,635) (17.0%) (156,270) 2006 105,544 86.2% 16,840 13.8% 122,384 (136,590) (83.1%) (27,842) (16.9%) (164,432) 2007 112,157 (84.8%) 20,131 (15.2%) 132,288 (147,489) (81.8%) (32,768) (18.2%) (180,257) 2008 107,487 (84.0%) 20,423 (16.0%) (127,910) (144,920) (81.3%) (33,291) (18.7%) (178,211) 계 1,642,501 78.7% 445,866 21.3% 2,088,367 ### (77.6%) (574,162) (22.4%) ### Note 1: Figures in parenthesis include multiple applications.
- 10. Applications in 2008 by country of origin Utility Classification Patents Designs Trademarks models Japan 17,552 41 1,688 (1,728) 4,563 (8,254) U.S.A. 12,389 27 1,073 (1,637) 7,623 (12,015) Germany 3,603 4 261 (261) 1,113 (1,715) Netherlands 1,283 2 94 (94) 470 (711) France 1,486 1 117 (118) 926 (1,383) Taiwan 550 299 58 (58) 378 (434) Switzerland 1,230 99 (129) 851 (1,386) United Kingdom 753 104 (125) 892 (1,657) Italy 328 5 50 (50) 612 (1,017) Sweden 730 2 90 (94) 123 (200) Finland 575 1 67 (67) 50 (83) China 481 39 53 (53) 533 (699) Canada 387 1 12 (12) 276 (515) Australia 230 19 (19) 184 (307) Singapore 163 22 (22) 133 (201) Belgium 288 22 (22) 72 (106) Hong Kong 9 1 3 (3) 86 (116) Israel 294 8 (8) 60 (79) Denmark 194 11 (11) 71 (98) Spain 95 8 (8) 144 (232) Virgin Islands 28 3 5 (5) 105 (203) Austria 147 1 7 (7) 46 (56) Luxembourg 60 154 (314) India 108 1 (1) 40 (80) New Zealand 27 1 6 (6) 63 (87) Norway 68 4 (4) 16 (39) Ireland 70 1 (1) 77 (104) Malaysia 14 1 (1) 65 (99) Liechtenstein 13 46 (49) 16 (51) Brazil 26 6 (13) 56 (70) Mexico 4 28 (30) Bermuda 5 16 (34) Chile 3 46 (52) South Africa 33 1 (1) 28 (34) Tailand 7 1 (1) 45 (61) Rusia 36 4 3 (3) 18 (18) United Arab Emirates 28 (54) Monaco 12 (16) Hungary 14 1 1 (1) 21 (38) Turkey 16 9 (18) Saudi Arabia 12 25 (46) Indonesia 35 (43) Cayman Islands 7 36 (51) Portugal 11 6 (6) 17 (23) Philippines 27 (41) Greece 19 21 (47)
- 11. Barbados 41 11 (11) 9 (11) Cyprus 12 26 (51) Argentina 3 1 19 (24) Antilles 3 (6) Viet Nam 9 (9) Bahamas 6 16 (42) Czech Republic 14 2 (2) 8 (11) Colombia 5 (8) Cuba 20 16 (19) seychelles 1 4 (4) Slovenia 4 1 (1) Poland 3 3 (5) Puerto Rico 3 7 (7) Bulgaria 2 San Marino 1 3 (3) Panama 5 6 (13) Belarus 4 Sri Lanka 6 (12) Lebanon 1 (1) Macao 3 (7) Mauritius 8 2 (5) Aruba Iran 1 (1) Belize 4 (9) Slovakia 1 (1) Jordan 2 1 (1) Uruguay Egypt 4 (4) Kuwait 10 (56) Croatia 1 Pakistan 1 (1) Niue Malta 1 11 (14) Venezuela Western Samoa 2 (2) 2 (2) Andorra Yemen 1 (1) Oman 2 (2) Ukraine 1 6 (6) Kazakhstan 2 Peru Fiji Iceland 5 2 (2) Others 31 1 (1) 20 (35) 계 Total 43,518 434 3,964 (4,634) 20,423 (33,291) Note 1: Figures in parenthesis include multiple applications.
- 12. in Total 23,844 (27,575) 21,112 (26,068) 4,981 (5,583) 1,849 (2,090) 2,530 (2,988) 1,285 (1,341) 2,180 (2,745) 1,749 (2,535) 995 (1,400) 945 (1,026) 693 (726) 1,106 (1,272) 676 (915) 433 (556) 318 (386) 382 (416) 99 (129) 362 (381) 276 (303) 247 (335) 141 (239) 201 (211) 214 (374) 149 (189) 97 (121) 88 (111) 148 (175) 80 (114) 75 (113) 88 (109) 32 (34) 21 (39) 49 (55) 62 (68) 53 (69) 61 (61) 28 (54) 12 (16) 37 (54) 25 (34) 37 (58) 35 (43) 43 (58) 34 (40) 27 (41) 40 (66)
- 13. 61 (63) 38 (63) 23 (28) 3 (6) 9 (9) 22 (48) 24 (27) 5 (8) 36 (39) 5 (5) 5 (5) 6 (8) 10 (10) 2 (2) 4 (4) 11 (18) 4 (4) 6 (12) 1 (1) 3 (7) 10 (13) () 1 (1) 4 (9) 1 (1) 3 (3) () 4 (4) 10 (56) 1 (1) 1 (1) () 12 (15) () 4 (4) () 1 (1) 2 (2) 7 (7) 2 (2) () () 7 (7) 52 (67) 68,339 (81,877)
- 14. International patent applications under the PCT Receiving Office Designated Office Year Application language Translation for national phase Increasing rate Utility Korean English Japanese Total Patents Total models 1984 6 4 10 1985 11 12 23 130.0% 418 1 419 1986 15 5 20 -13.0% 976 4 980 1987 12 3 15 -25.0% 1,272 5 1,277 1988 22 1 23 53.3% 1,797 3 1,800 1989 12 1 13 -43.5% 2,522 1 2,523 1990 21 3 24 84.6% 2,713 8 2,721 1991 30 6 36 50.0% 2,028 14 2,042 1992 75 9 84 133.3% 3,439 6 3,445 1993 117 10 127 51.2% 4,134 13 4,147 1994 177 11 188 48.0% 4,889 16 4,905 1995 182 7 189 0.5% 6,074 10 6,084 1996 275 6 281 48.7% 7,639 8 7,647 1997 280 8 288 2.5% 10,019 13 10,032 1998 479 16 495 71.9% 11,016 16 11,032 1999 57 780 18 855 72.7% 12,639 10 12,649 2000 703 870 1,573 84.0% 15,124 9 15,133 2001 1,485 828 1 2,314 47.1% 16,686 4 16,690 2002 1,663 847 1 2,511 8.5% 17,868 6 17,874 2003 1,764 1,176 2 2,942 17.2% 16,974 7 16,981 2004 2,088 1,475 2 3,565 21.2% 21,168 15 21,183 2005 2,856 1,833 1 4,690 31.6% 24,473 9 24,482 2006 3,714 2,204 1 5,919 26.2% 26,635 14 26,649 2007 4,558 2,505 7,063 50.6% 29,023 22 29,045 2008 4,982 2,926 3 7,911 33.7% 30,030 18 30,048
- 15. ed Office Increasing rate 133.9% 30.3% 41.0% 40.2% 7.8% -25.0% 68.7% 20.4% 18.3% 24.0% 25.7% 31.2% 10.0% 14.7% 19.6% 10.3% 7.1% -5.0% 24.7% 15.6% 8.9% 18.6% 12.8%
- 16. Number of international trademark applications under Madrid Protocol Office of the Designated Year Office of Origin total Contracting Party 2003 108 1,548 1,656 2004 141 4,874 5,015 2005 154 6,699 6,853 2006 208 8,483 8,691 2007 283 9,072 9,355 2008 216 9,745 9,961