http://www.pet.hw.ac.uk/icgh7/papers/icgh2011Final00005.pdf
•
0 recomendaciones•279 vistas

Poster presented during the 7ªICGH (Edimburgh-UK)
Recomendados

Recomendados
Más contenido relacionado
Más de Fernando Freire
Más de Fernando Freire (11)
http://www.pet.hw.ac.uk/icgh7/papers/icgh2011Final00005.pdf
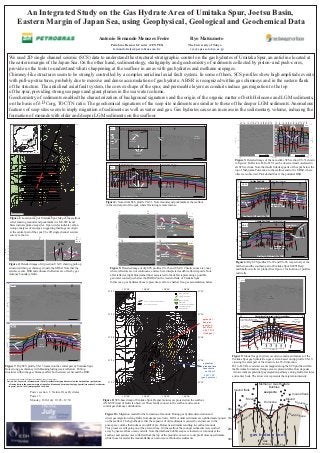
- 1. An Integrated Study on the Gas Hydrate Area of Umitaka Spur, Joetsu Basin, Eastern Margin of Japan Sea, using Geophysical, Geological and Geochemical Data Antonio Fernando Menezes Freire Ryo Matsumoto Petrobras Research Center (CENPES) The University of Tokyo fernandofreire@petrobras.com.br ryo@eps.s.u-tokyo.ac.jp We used 2D single channel seismic (SCS) data to understand the structural-stratigraphic control on the gas hydrates of Umitaka Spur, an anticline located at the eastern margin of the Japan Sea. On the other hand, sedimentology, stratigraphy and geochemistry of sediments collected by piston- and push-cores, provide us the tools to understand what is happening at the seafloor in areas with gas hydrates and methane seepages. Chimney-like structures seem to be strongly controlled by a complex anticlinal axial fault system. In some of them, SCS profiles show high amplitude events with pull-up structures, probably due to massive and dense accumulation of gas hydrate. A BSR is recognized within gas chimneys and in the eastern flank of the structure. The anticlinal axial fault system, the convex shape of the spur, and permeable layers as conduits induce gas migration to the top of the spur, providing strong seepages and giant plumes in the sea water column. Geochemistry of sediments enabled the characterization of background signatures and the origin of the organic matter of both Holocene and LGM sediments, on the basis of δ13Corg, TOC/TN ratio. The geochemical signatures of the seep site sediments are similar to those of the deeper LGM sediments. Anomalous features of seep sites seem to imply migration of sediments as well as water and gas. Gas hydrates cause an increase in the sedimentary volume, inducing the formation of mounds with older and deeper LGM sediments on the seafloor. 10 11 13 15 16 17 18 19 20 22 23 25 10 11 13 15 16 17 18 19 20 22 23 25 801 37°32' 1.2 - mound 44°N JAPAN S METI DEEP WELL (Proj.) METI SHALLOW WELL (Proj.) N seep site pockmark US-51 - 1.2 Hokkaido 1.0 Sapporo US-51 03 04 05 06 07 08 09 10 11 13 15 16 17 18 19 20 22 23 25 54 26 27 28 29 108 CHINA H-I 42°N 1.2 Mound (seep) Depression (pockmark) H-II 1.4 - ? BSR - 1.4 500 km H-I BSR H-III 40°N Japan Sea ? -99‰ δ13C Akita 1.4 H-II CH4 H-III Debris Flow Seafloor H-IV Sakata Sado Island Enhanced TWT (s) Haizume Fm. TWT (s) H-IV Sendai 38°N Umitaka Spur Niigata 00 m 1.6 Debris Flow Enhanced Reflectors Joetsu -11 1.6 - - 1.6 TWT (s) Joestu Basin H-V Reflectors H-V 36°N KOREA Kanazawa H-VI Gas e Honshu Tokyo a 37°30' 1.8 H-VI Chimney -11 Hiroshima 00 34°N Shikoku e 2.0 Zoom area for fig. 3 1.8 - - 1.8 Pacific Ocean m Kyushu Nishiyama Fm. Top of JK Gas Nishiyama Fm. i Nagazaki 32°N 0 100 km -1000m /U Gas Gas 128°E 130°E 132°E 134°E 136°E 138°E 140°E 142°E S- 2.2 Chimney Chimney Chimney 10 8 Umitaka Spur Umitaka Spur Umitaka Spur 2.0 - 0 500m 0 500m - 2.0 -1100m 2.4 South Central Northl -89‰ δ13C 0 1Km SW NE SW NE CH4 UMITAKA SPUR METI_S well NORTH (2b) Figure 3: Detailed image of the near-strike SCS section US-51 shown US-29 37°28' S METI DEEP WELL (Proj.) METI SHALLOW WELL (Proj.) N in figure 2. Reflectors H-I to H-VI can be observed and correlated in Steep 1.0 US-28 Slope -54‰ δ13C CH4 Gentle US-51 03 04 05 06 07 08 09 10 11 13 15 16 17 18 19 20 22 23 25 54 26 27 28 29 108 all SCS sections. Note that faults link deep parts of the spur below the US-27 Mound (seep) Depression (pockmark) US-26 US-25 Mound (seep) FIG. 05a Slope 1.2 top of Nishiyama Formation to the seafloor and to the GHSZ, where BSR US-23 H-I offsets are observed. Pink dashed line is the potential BSR. . 03 US-22 1.4 H-II Depression (pockmark) H-III Seafloor FIG US-20 Debris Flow US-19 H-IV Haizume Fm. US-18 FIG. 04 1.6 Debris Flow Enhanced -10 TWT (s) US-17 H-V Reflectors -47‰ δ13C 00 US-16 CH4 H-VI W Umitaka Spur North METI SHALLOW WELL E m US-15 1.8 1.0 US-13 Mound (seep) Nishiyama Fm. US-29 54 51 53 37°26' US-11 364 mbsf (~1.3 Ma) UMITAKA SPUR 2.0 Nishiyama Fm. Zoom area for fig. 3 US-10 1.2 Gas Depression (pockmark) CENTER 622 mbsf (~1.3 Ma) Chimney Water Depth: 971 m -900 US-09 -67‰ δ13C US-08 CH4 FIG. 05b 2.2 1.4 BSR Debris Flow H-I m US-07 Umitaka Spur Umitaka Spur Seafloor -1000m Umitaka Spur -900m H-II US-06 2.4 South Central Northl Haizume Fm. 0m 3 US-05 0 0 1Km 1.6 G 11 Final Depth: 2088 mbsf (3.3 s TWT) Final Depth: 1027 mbsf ( 2.5 s TWT) H-III US-5 - TWT (s) W US-04 (2b) Enhanced UMITAKA SPUR H-IV US-03 Reflectors Fluid Contact SOUTH METI_D well Figure 2: Near-strike SCS profile US-51. Note mounds and pockmarks at the seafloor 1.8 (Flat-Spot) H-V US-54 51 Debris Flow Nishiyama Fm. US- 37°24' in the central part of the spur, where fracturing is more intense. 2.0 364 mbsf (~1.3 Ma) H-VI e tal slop t inen 2.2 con km (a) 53 53 Contour interval = 5m 0 1 2 W E W E 2.4 0 1Km 137°58' 138°00' 138°02' 138°04' US-23 Final Depth: 1027 mbsf (2.5 s TWT) Figure 1: Location map of Umitaka Spur. Map of the seafloor 1.5 BSR Cahotic H-II (3a) Zones relief showing mounds and pockmarks in a NE-SW trend. Free Gas? 1.0 W Umitaka Spur South METI DEEP WELL E 1.6 Debris Flo 51 54 53 tal Stars indicate plume/seep sites. Open circles indicate carbon ws US-03 Water Depth: n TWT (s) Enhanced Water H-III ine 885 m nt isotope analyses of mud-gas, suggesting thermogenic origin 1.7 Reflectors Fluid Contact Debris Flo ws 1.2 H-I co pe slo at the central part of the spur. The 2D single channel seismic (Flat-Spot) 1.4 Seafloor H-II H-III survey is shown. 0 500m 0 H-IV 500m 1.6 Haizume Fm. H-IV 54 54 1.8 TWT (s) H-V Debris-Flow W E W E (b) 53 53 ? H-VI US-19 1.8 ? W E W E mounds seep site H-II US-08 1.5 Cahotic Zones Debris Flo 1.2 - ws 2.0 Nishiyama Fm. ? 622 mbsf (~1.3 Ma) 1.3 - H-III TWT (s) offset Debris Flo ws 2.2 1.4 - 1.6 “pull-up” BSR BSR TWT (s) ? Enhanced 1.5 - 2.4 0 1Km Enhanced H-IV Reflectors Cahotic Final Depth: 2088 mbsf (3.3 s TWT) 1.6 - gas Reflectors 1.7 Zone (3b) Debris Flo 0 500m 0 500m ws chimney H-V Fluid Contact Figure 6: Dip SCS profiles US-29 and US-03, respectively at the Figure 4: Detailed image of dip section US-19 showing pull-up 1.8 0 500m 0 (Flat-Spot) 500m northern and the southern part of Umitaka Spur. METI Deep structure within gas chimneys inside the GHSZ. Note that the Figure 5: Detailed image of dip SCS profiles US-23 and US-08. Chaotic zones are zones and Shallow wells are plotted. See figure 1 for location of profiles seismic events, BSR and enhanced reflectors are offset by gas where reflectors are not continuous, and are here interpreted as debris-flow deposits. Note and wells. chimney boundary faults. a flat reflector (light blue dashed line) associated to the debris representing a possible gas/water contact just below the BGHSZ on the western flank of Umitaka Spur. 1.0 US-19 E In this case, gas hydrates above represent a seal for a shallow free-gas accumulation below. 1.2 W US-013 51 54 53 1.4 1.2 - 137°58' 138°00' 138°02' 138°04' 37°32' 801 37°32' 1.6 1.4 - Transfer Zone Mound Seep Sites JOETSU KNOLL Seafloor Lineaments 1.8 Gas TWT (s) 1.6 - SOUTH Assimetrical Anticline Axis Chimney BSR Area (projected) Normal or Vertical Faults (seafloor) 2.0 1.8 - Debris-Flow TWT (s) 1 Gas Chimney (seafloor) Occurrence Area (projected) 2.2 2.0 - Free-Gas Occurrence Gas Hydrate Target (projected on the seafloor) Area (projected) 2.4 2.2 - GH -11 37°30' 37°30' OU 00 2.4 - W Structural and Stratigraphic Gas Focused Model E m TR Giant Plumes potential Mud Gas Analysis KA 0 1Km Concentration of Methane Seeps 13 and Gas Hydrate Seafloor Outcrops δ CCH4 > -60‰ Seafloor TA Mud Gas Analysis free-gas Mound Depression (pockmark) MI