Morphological variation in Balanites aegyptiaca fruits and seeds within and among parkland agroforests in eastern Niger
•
0 recomendaciones•590 vistas

Presentation during ICRAF Science Forum meeting 6-8 September 2010, Nairobi, Kenya. 1p.

Recomendados
Más contenido relacionado
Más de World Agroforestry (ICRAF)
Más de World Agroforestry (ICRAF) (20)
Último
Último (20)
Morphological variation in Balanites aegyptiaca fruits and seeds within and among parkland agroforests in eastern Niger
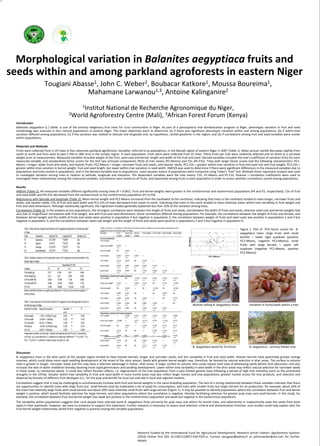
- 1. Morphological variation in Balanites aegyptiaca fruits and seeds within and among parkland agroforests in eastern Niger Tougiani Abasse1, John C. Weber2, Boubacar Katkore1, Moussa Boureima1, Mahamane Larwanou1,3, Antoine Kalinganire2 1Institut National de Recherche Agronomique du Niger, 2World Agroforestry Centre (Mali), 3African Forest Forum (Kenya) Introduction Balanites aegyptiaca (L.) Delile. is one of the priority indigenous fruit trees for rural communities in Niger. As part of a participatory tree domestication program in Niger, phenotypic variation in fruit and seed morphology was assessed in four natural populations in eastern Niger. The major objectives were to determine (a) if there was significant phenotypic variation within and among populations; (b) if within‐tree variation differed among populations; (c) if the variation was related to latitude and longitude and, by hypothesis, rainfall gradients in the region; and (d) if correlations among fruit and seed variables were similar within populations. Materials and Methods Fruits were collected from in 25 trees in four extensive parkland agroforests, hereafter referred to as populations, in the Maradi region of eastern Niger in 2007 (Table 1). Mean annual rainfall decreases slightly from south to north and from west to east (~450 to 400 mm) in the sample region. In each population, fruits were were collected from 25 trees. Thirty fruits per tree were randomly selected and air‐dried to a constant weight prior to measurement. Measured variables included weight of the fruit, seed coat and kernel; length and width of the fruit and seed. Derived variables included the tree’s coefficient of variation (CVs) for each measured variable, and standardized factor scores for the first two principal components (PCA) of tree means (PC‐Means) and CVs (PC‐CVs). Trees with larger factor scores had the following characteristics: PC1‐ Means = longer, wider fruits and seeds, and heavier fruits; PC2‐Means = longer, narrower fruits and seeds, and heavier seeds; PC1‐CVs = greater within‐tree variation in fruit and seed size and fruit weight; PC2‐CVs = greater within‐tree variation in kernel weight, fruit and seed length, but lower within‐tree variation in seed width. ANOVA was used to determine if there were significant differences in the measured variables due to populations and trees nested in populations, and in the derived variables due to populations. Least‐squares means of populations were compared using Tukey’s “hsd” test. Multiple linear regression analysis was used to investigate variation among trees in relation to latitude, longitude and elevation. The dependent variables were the tree means, CVs, PC‐Means and PC‐CVs. Pearson r correlation coefficients were used to investigate linear relationships among the measured variables. Correlations were based on all fruits, and separately among fruits in each population in order to assess whether correlations varied among populations. Results ANOVA (Table 2): All measured variables differed significantly among trees (P < 0.001). Fruit and kernel weights were greater in the northernmost and easternmost populations (P4 and P2, respectively). CVs of fruit and seed width and PCI‐CVs decreased from the southernmost to the northernmost population (P1 to P4). Regressions with latitude and longitude (Table 3): Mean kernel weight and PC2‐Means increased from the southwest to the northeast, indicating that trees in the northeast tended to have longer, narrower fruits and seeds, and heavier seeds. CVs of fruit and seed width and PC1‐CVs of trees decreased from south to north, indicating that trees in the north tended to have relatively lower within‐tree variability in fruit weight and fruit and seed dimensions. Although statistically significant, the regression models generally explained less than 10% of the variation among trees. Correlations (Table 3): In the analysis across populations, the strongest correlations were between the length of fruits and seeds, and between the width of fruits and seeds; whereas seed coat and kernel weights had very low or insignificant correlations with fruit weight, and with fruit and seed dimensions. Some correlations differed among populations. For example, the correlations between the weight of fruits and kernels, and between kernel weight and the width of fruits and seeds were positive in population 4 but negative in population 2; the correlation between weight of fruits and seed coats was positive in populations 1 and 4 but negative in population 3; and the correlations between seed coat weight and the length of fruits and seeds were positive in populations 1 and 2 but negative in population 4. Table 1. Mean latitude, longitude and elevation of B. aegyptiaca populations in the Maradi region Table 4. Pearson r correlation coefficients among fruit/seed variables across and within populations of B. aegyptiaca from the Maradi region of Niger. 3 Figure 1. Plot of PCA factor scores for B. o f Niger. Variable Fruit Seed coat Kernel Fruit length Fruit width Seed length Seed width 2 aegyptiaca trees: large fruits with small Code Population Latitude (°N) Longitude (°E) Elevation (m) weight weight weight kernels = lower right quadrate (positive PC2‐Means 1 Across populations P1 Sajamanja 13°12’58” 7°28’48” 423 Fruit weight ‐‐‐ 0 PC1‐Means, negative PC2‐Means); small P2 Elgueza 13°16’6” 7°32’22” 403 Seed coat weight 0.076 ‐‐‐ fruits with large kernels = upper left P3 Dansaga 13°24’49” 7°26’57” 413 -1 *** quadrate (negative PC1‐Means, positive P4 Kanambakache 13°27’53” 7°25’22” 400 Kernel weight NS 0.332 ‐‐‐ -2 *** -3 PC2‐Means). Fruit length 0.462 0.077 0.038 ‐‐‐ -3 -2 -1 0 PC1‐Means 1 2 3 Table 2. Multiple comparison test of population means of B. aegyptiaca fruit/seed variables in the *** *** * Maradi region of Niger. Fruit width 0.613 0.044 NS 0.219 ‐‐‐ *** * *** Populations (P1‐P4) Seed length 0.449 0.081 0.048 0.836 0.172 ‐‐‐ Variable P1 P2 P3 P4 *** *** ** *** *** Seed width 0.628 0.044 NS 0.159 0.682 0.140 ‐‐‐ Fruit weight (g) 5.97 6.78a 5.60 6.80a *** * *** *** *** Kernel weight (g) 0.53 0.63 0.59a 0.60a Populations 1 below and 2 above diagonal Fruit weight ‐‐‐ NS –0.160 0.338 0.656 0.319 0.763 CV‐fruit width (%) 9.00a 7.97ab 7.13b 6.85b *** *** *** *** *** CV‐seed width (%) 8.84a 7.81ab 7.44ab 7.12b Seed coat weight 0.145 ‐‐‐ 0.360 0.131 NS 0.114 –0.104 *** *** *** ** ** PC1‐CVs 0.48a 0.08ab ‐0.21ab ‐0.35b Kernel weight NS 0.228 ‐‐‐ NS –0.138 NS –0.183 Means with different letters are significantly different (P < 0.001 for fruit and kernel weights, P < *** *** *** Fruit length 0.484 0.267 NS ‐‐‐ NS 0.904 NS 0.05 for others). *** *** *** Fruit width 0.584 0.104 NS 0.446 ‐‐‐ NS 0.774 *** ** *** *** Table 3. Linear regression of fruit/seed variables of B. aegyptiaca trees with geographic location in Seed length 0.484 0.282 NS 0.805 0.428 ‐‐‐ NS the Maradi region of Niger. *** *** *** *** Woman selling B. aegyptiaca fruits Variation in fruits/seeds within a tree Dependent variable Regression equation Standard P R2 Seed width 0.463 0.081 NS 0.269 0.561 0.275 ‐‐‐ *** * *** *** *** error Populations 3 below and 4 above diagonal Kernel weight –7.183 + 0.078(Lat*Long) 0.024 ** 0.094 Fruit weight ‐‐‐ 0.100 0.203 0.450 0.538 0.502 0.680 *** *** *** *** *** *** CV‐fruit width 113.640 – 7.938(Lat) 2.322 *** 0.107 Seed coat weight –0.086 ‐‐‐ 0.277 –0.131 0.074 –0.163 0.112 CV‐seed width 85.164 – 5.799(Lat) 2.204 ** 0.067 * *** *** * *** ** PC2‐Means –54.269 + 0.544(Lat*Long) 0.193 ** 0.075 Kernel weight NS 0.497 ‐‐‐ 0.122 0.125 0.123 0.171 *** *** *** *** *** PC1‐CVs 40.297 – 3.021(Lat) 0.935 * 0.096 Fruit length 0.513 NS NS ‐‐‐ 0.184 0.745 0.111 Independent variables: Lat and Long = latitude and longitude (decimal °N and °E, respectively), *** *** *** ** Fruit width Probability of Pearson r: *** P < 0.001, ** P <0.074 < 0.05, NS P > 0.05; N = 3000 across and 750 0.689 NS 0.01, * P 0.186 ‐‐‐ 0.151 0.644 Lat*Long = Lat x Long interaction. P = significance of regression coefficients: *** P < 0.001, ** P < within populations *** * *** *** *** 0.01, * P < 0.05. R2 = coefficient of determination of model. N = 100. Seed length 0.470 NS NS 0.895 0.162 ‐‐‐ 0.130 *** *** *** *** Seed width 0.654 NS NS 0.213 0.757 0.182 ‐‐‐ *** *** *** *** B. aegyptiaca wood for furniture B. aegyptiaca – priority fodder tree Discussion B. aegyptiaca trees in the drier parts of the sample region tended to have heavier kernels, longer and narrower seeds, and less variability in fruit and seed width. Heavier kernels have potentially greater energy reserves, which could allow more rapid seedling development at the onset of the rainy season. Seeds with greater kernel weight may, therefore, be favored by natural selection in drier areas. The surface to volume ratio is greater in longer, narrower seeds and this may have a selective advantage in hotter, drier areas. A larger surface to volume ratio could reduce heat load of developing seeds before fruit abscission, and also increase the rate of water imbibition thereby favoring more rapid germination and seedling development. Lower within‐tree variability in seed width in the drier areas may reflect natural selection for narrower seeds in these areas, as mentioned above. It could also reflect founder effects, i.e. regeneration of the tree population from a very limited genetic base following a period of high tree mortality (such as the protracted droughts in the 1970s). Greater within‐tree variability in fruit and seed width in more humid areas may also reflect larger human and tree populations, greater market access for tree products, and selection and dispersal by humans of different fruit ideotypes (i.e., for the pulp and kernel) for local use and sale in local and regional markets. Correlations suggest that it may be challenging to simultaneously increase both fruit and kernel weights in the same breeding population. The lack of a strong relationship between these variables indicates that there are opportunities to identify trees with large fruits but small kernels (and by implication a lot of pulp) for consumption, and trees with smaller fruits but larger kernels for oil production: for example, about 20% of the trees had relatively large fruits with small kernels and about 20% have relatively small fruits with large kernels (Figure 1). It may be possible to identify populations where the correlation between fruit and kernel weight is positive, which would facilitate selection for large kernels, and other populations where the correlation is negative, thereby facilitating selection for greater pulp mass and small kernels. In this study, for example, the correlation between fruit and kernel weight was weak but positive in the northernmost population and weak but negative in the easternmost population. The variability within populations suggests that rural people have selected some B. aegyptiaca fruits primarily for pulp mass and others for kernel mass, and advertently or inadvertently sown the seeds from both types in their parklands. However, we have no evidence to support this statement. Further research is necessary to assess local selection criteria and domestication histories: such studies could help explain why the fruit‐kernel weight relationship varied from negative to positive among the sampled populations. Research funded by the International Fund for Agricultural Development. Research article citation: Agroforestry Systems (2010) Online first DOI 10.1007/s10457‐010‐9323‐x. Contact atougiani@yahoo.fr or johncrweber@aol.com for further details.