Trade policies-sustainable iintensification-birungi-kilimotrust-aasw
•
0 recomendaciones•1,271 vistas

Analysis of regional trade policies and impact on sustainable intensification (WaLeTS) (Presented by Birungi Korutaro of The Kilimo Trust)
Recomendados

Recomendados
Más contenido relacionado
La actualidad más candente
La actualidad más candente (20)
Similar a Trade policies-sustainable iintensification-birungi-kilimotrust-aasw
Similar a Trade policies-sustainable iintensification-birungi-kilimotrust-aasw (20)
Más de World Agroforestry (ICRAF)
Más de World Agroforestry (ICRAF) (20)
Último
Último (20)
Trade policies-sustainable iintensification-birungi-kilimotrust-aasw
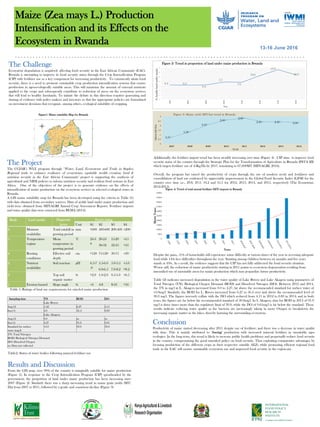
- 1. Maize (Zea mays L.) Production Intensification and its Effects on the Ecosystem in Rwanda The Challenge Ecosystem degradation is negatively affecting food security in the East African Community (EAC). Rwanda is attempting to improve its food security status through the Crop Intensification Program (CIP) with fertilizer use as a key component for increasing productivity. To consistently attain food security, there is a need to promote sustainable crop production intensification systems that ensure production in agro-ecologically suitable areas. This will minimize the amount of external nutrients applied to the crops and subsequently contribute to reduction of stress on the ecosystem services that will lead to healthy farmlands. To initiate the debate in this direction requires generating and sharing of evidence with policy makers and investors so that the appropriate policies are formulated on investment decisions that recognize, among others, ecological suitability of cropping. Pi ct u re s 13-16 June 2016 The Project The CGIAR’s WLE program through ‘Water, Land, Ecosystems and Trade in Staples: Regional trade to enhance resilience of ecosystems; equitable wealth creation; food & nutrition security in the East African Community’ project is supporting the synthesis of agricultural and NRM policies to inform nutrition security and resilient food systems in East Africa. One of the objectives of the project is to generate evidence on the effects of intensification of maize production on the ecosystem services in selected ecological zones in Rwanda. A GIS maize suitability map for Rwanda has been developed using the criteria in Table (1) with data obtained from secondary sources. Data of arable land under maize production and yield were obtained from MINAGRI Annual Crop Assessment Reports. Fertilizer imports and water quality data were extracted from REMA (2014). Conclusion Productivity of maize started decreasing after 2011 despite use of fertilizer; and there was a decrease in water quality with time. This is mainly attributed to ‘forcing’ production with increased mineral fertilizer in unsuitable agro ecologies. In the long term, this trend is likely to increase public health problems and perpetually reduce food security in the country, compromising the good intended policy on food security. Thus exploiting comparative advantages by focusing production of the different crops in their respective suitable AEZs while promoting efficient regional food trade in the EAC will ensure sustainable ecosystem use and improved food security in the region.am on Water, Land and Ecosystems in the Volta and Niger Additionally, the fertilizer import trend has been steadily increasing over time (Figure 4). CIP aims to improve food security status of the country through the Strategic Plan for the Transformation of Agriculture in Rwanda (PSTA III) which targets fertilizer use of 45Kg/Ha by 2017, translating to 67,600MT (MINAGRI, 2016). Overall, the program has raised the productivity of crops through the use of modern seeds and fertilizers and consolidation of land use evidenced by appreciable improvement in the Global Food Security Index (GFSI) for the country over time i.e., 29.8, 29.3, 34.2 and 35.1 for 2012, 2013, 2014, and 2015, respectively (The Economist, 2012-2015). Despite the gains, 51% of households still experience some difficulty at various times of the year in accessing adequate food while 14% face difficulties throughout the year. Stunting among children between six months and five years stands at 43%. As a result, the evidence suggests that the CIP has not fully addressed the food security situation. Worse still, the reduction of maize productivity starting in 2011 points to ecosystem degeneration resulting from intensified use of unsuitable areas for maize production which may jeopardize future productivity. Table (2) indicates increased degradation in the water quality of Lake Rweru and Lake Akagera using parameters of Total Nitrogen (TN), Biological Oxygen Demand (BOD) and Dissolved Nitrogen (DO). Between 2012 and 2014, the TN in mg/l in L. Akagera increased from 0.0 to 4.27, far above the recommended standard for surface water of <3.0mg/l. Similarly, the BOD for L. Rweru increased from 6.27 to 56.4 over and above the recommended level of 30.0 mg/l. The figures inversely collate with the DO which reduced from 4.11 in 2012 to 0.83 in 2014; and in both years, the figures are far below the recommended standard of 30.0mg/l. In L Akagera, data for BOD in 2014 of 91.9 mg/l is three times more than the regulatory limit of 30.0, while the DO of 0.61mg/l is far below the standard. These results indicate reducing water quality as the bacteria are increasingly taking in more Oxygen to breakdown the increasing organic matter in the lakes, thereby harming the surrounding ecosystem. Table 1: Ratings of land use requirements for rain-fed maize production 6.4 6.3 6.4 7.7 7.6 10.6 13.2 10.9 0 2 4 6 8 10 12 14 2007 2008 2009 2010 2011 2012 2013 2014 %Arablelandundermaize Year Figure 2: Trend in proportion of land under maize production in Rwanda 0.70 1.30 2.10 2.60 2.80 2.40 2.40 2.30 0 0.5 1 1.5 2 2.5 3 2007 2008 2009 2010 2011 2012 2013 2014 YIELD(MT/HA) YEAR Figure 3: Maize yield (MT/ha) trend in Rwanda Table2: Status of water bodies following mineral fertilizer use Sampling time TN BOD DO Lake Rweru Aug-12 5.42 6.27 4.11 Jun-14 4.0 56.4 0.83 Lake Akagera Aug-12 0.0 xx xx Jun-14 4.27 91.9 0.61 Standard for surface water (mg/l) <3.0 30.0 30.0 TN: Total Nitrogen BOD: Biological Nitrogen Demand DO: Dissolved Oxygen xx: Data not collected 0 5000 10000 15000 20000 25000 30000 35000 40000 45000 50000 MetricTones Years Figure 4: Trend of total annual fertilizer (MT) imports in Rwanda Results and Discussion From the GIS map, over 90% of the country is marginally suitable for maize production (Figure 1). In response to the Crop Intensification Program (CIP) spearheaded by the government, the proportion of land under maize production has been increasing since 2007 (Figure 2). Similarly there was a sharp increasing trend in maize grain yields (MT/ Ha) from 2007 to 2011, followed by a gentle and consistent decline (Figure 3). Rank Land quality Diagnostic factor Factor rating Unit S1 S2 S3 S4 6 Moisture availability Total rainfall in growing period mm >600 400-600 200-400 <200 5 Temperature regime Mean temperature in growing period °C 24-3 0 20-24 30-32 15-20 32-35 <15 >35 4 Rooting conditions Effective soil depth cm >120 75-120 30-75 <30 2 Nutrient availability Soil reaction pH 6.5-7 .0 5.5-6.0 6.0-6.5 5.0-5.5 7.0-8.2 <5.0 >8.2 3 Top soil organic matter % >2.0 1.0-2.0 0.5-1.0 <0.5 1 Erosion hazard Slope angle % <4 4-8 8-16 >16 Figure1: Maize suitability Map for Rwanda