1. SKF Half-year report 2010
Tom Johnstone, President and CEO:
"Our sales developed positively in the quarter driven primarily by a continued strong
automotive business and an improvement in the industrial business. The very good sales
development and higher manufacturing level combined with the cost reduction activities
undertaken resulted in a strong result for the SKF Group, a record in terms of operating
profit and operating margin.
In the third quarter we expect a continued good level of sales for the Group being
significantly higher than last year. All regions and divisions will see good growth even if we
expect lower sales to the car industry in Europe. Manufacturing will be kept at the same
level as the second quarter which means it will be significantly higher than last year.”
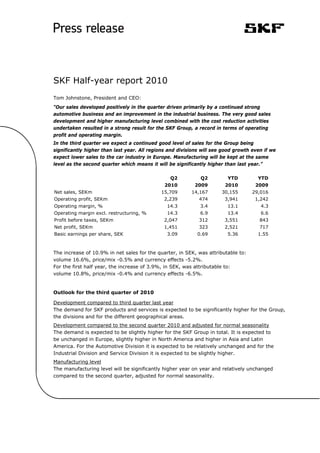
Q2 Q2 YTD YTD
2010 2009 2010 2009
Net sales, SEKm 15,709 14,167 30,155 29,016
Operating profit, SEKm 2,239 474 3,941 1,242
Operating margin, % 14.3 3.4 13.1 4.3
Operating margin excl. restructuring, % 14.3 6.9 13.4 6.6
Profit before taxes, SEKm 2,047 312 3,551 843
Net profit, SEKm 1,451 323 2,521 717
Basic earnings per share, SEK 3.09 0.69 5.36 1.55
The increase of 10.9% in net sales for the quarter, in SEK, was attributable to:
volume 16.6%, price/mix -0.5% and currency effects -5.2%.
For the first half year, the increase of 3.9%, in SEK, was attributable to:
volume 10.8%, price/mix -0.4% and currency effects -6.5%.
Outlook for the third quarter of 2010
Development compared to third quarter last year
The demand for SKF products and services is expected to be significantly higher for the Group,
the divisions and for the different geographical areas.
Development compared to the second quarter 2010 and adjusted for normal seasonality
The demand is expected to be slightly higher for the SKF Group in total. It is expected to
be unchanged in Europe, slightly higher in North America and higher in Asia and Latin
America. For the Automotive Division it is expected to be relatively unchanged and for the
Industrial Division and Service Division it is expected to be slightly higher.
Manufacturing level
The manufacturing level will be significantly higher year on year and relatively unchanged
compared to the second quarter, adjusted for normal seasonality.
2. Page 2 of 15
Sales performance in the second quarter
Sales in local currencies were significantly higher for the Group, and for all the different
geographical areas. Sales were significantly higher for Automotive Division and for Service
Division. For Industrial Division they were higher.
The manufacturing level was higher than in the first quarter and significantly higher than
the same quarter last year.
Financial
30 June 31 March 30 June
Key figures 2010 2010 2009
Inventories, % of annual sales 22.2 21.0 22.9
ROCE for the 12-month period, % 16.8 11.9 13.4
ROE for the 12-month period, % 19.3 13.0 14.7
Equity/assets ratio, % 36.0 36.2 34.6
Gearing, % 47.4 48.3 51.1
Net debt/equity, % 70.8 65.5 80.4
Registered number of employees 41,644 41,055 42,422
Cash flow, after investments and before financing, was SEK 1,160 million (2,425) for the
second quarter and SEK 1,192 million (2,948) for the first half year 2010. In the quarter,
SEK 1,594 million was paid out to AB SKF’s shareholders in the form of dividends.
Inventories versus Q1 2010, in local currencies, were increased by around SEK 700
million.
The financial net in the second quarter of 2010 was SEK -192 million (-162), for the first
half year it was SEK -390 million (-399).
Exchange rates, the effects of translation and transaction flows, had a negative effect of
SEK 150 million on SKF’s operating profit in the second quarter and a negative effect of
around SEK 350 million for the half year compared to the corresponding period last year.
It is estimated that there will be a limited effect on operating profit in the third quarter
and for the full year a negative effect of SEK 250 million, based on current assumptions
and exchange rates and compared to the corresponding period last year.
Highlights
• SKF inaugurated its new factory in Tver, Russia where the new generation of SKF's
sealed and pre-lubricated compact tapered bearing units will be produced for the
Russian and international railway customers. The factory will be one of the first in
Russia and in Europe with LEED certification. The investment amounts to around SEK
235 million and the factory will employ 100 people.
• SKF inaugurated a Global Technical Centre China in Shanghai. The centre will be an
integral part of SKF’s global network of technical centres and will enable SKF to
develop products and solutions for local and global customers in a faster and more
cost effective way.
• SKF was awarded an agreement with ZF Sachs Italy to supply 140,000 oil seals and
wiper seals for motorcycle forks.
• SKF signed a three-year contract worth around SEK 34 million with Valeo to supply
SKF Rotor Positioning Bearings for the new i-StARS, Valeos stop-start system. i-StARS
3. Page 3 of 15
automatically cuts off the vehicle's engine when slowing down under 8 km/h, e.g when
stopping for a red light. The system enables further reduction in CO2 emissions.
• SKF signed a framework agreement with the State Forestry Administration in China to
plant new forests, in remote areas of the country. The project is expected to run for
five years.
• SKF received the “Golden Mousetrap” award in the 2010 “Best products awards”
announced by the magazine Design News. This was in the Electronics / Test and
Measurement category and for the new SKF Machine Condition Advisor, a handheld
instrument which simplifies machine monitoring and provides early warning of
potential failures. Design News annual Golden Mousetrap Awards recognize
engineering innovation and creativity in product design.
Divisions
Comments on sales are based on local currencies and compared to the corresponding
period for 2009. The operating margin has been calculated on sales including intra-Group
sales.
Industrial Division
The operating profit for the second quarter amounted to SEK 909 million (344), resulting
in an operating margin of 12.1% (4.8) on sales including intra-Group sales. The operating
profit for the first half year amounted to SEK 1,622 million (979), resulting in an operating
margin of 11.1% (6.4). Sales including intra-Group sales for the quarter were SEK 7,514
million (7,120), and for the half year SEK 14,619 million (15,307).
Net sales for the second quarter amounted to SEK 4,873 million (4,844) and for the first
half year SEK 9,568 million (10,646). The increase of 0.6% for the quarter was
attributable to: organic growth 7.1% and currency effects -6.5%.
For the half year the decrease of -10.1% was attributable to:
organic growth -3.3% and currency effects -6.8%.
Sales in local currency for the second quarter were lower in Europe, higher in North
America and significantly higher in Asia. For the half-year they were significantly lower in
Europe slightly lower in North America and significantly higher in Asia. There was a
positive trend in sales to segments such as construction equipment, fluid power, industrial
gearboxes, agriculture and pulp and paper. Sales to the renewable energy segment
globally have stabilized at a lower level than last year. The decline in sales to the
aerospace business shows signs of levelling out.
Service Division
The operating profit for the second quarter amounted to SEK 745 million (636), resulting
in an operating margin of 13.0% (12.7). The operating profit for the first half year
amounted to SEK 1,392 million (1,234), resulting in an operating margin of 12.8% (12.2).
Sales including intra-Group sales for the quarter were SEK 5,725 million (5,028), and for
the half year SEK 10,906 million (10,146).
Net sales for the second quarter amounted to SEK 5,635 million (4,944) and for the first
half year SEK 10,728 million (9,955). The increase of 14.0% for the quarter was
attributable to: organic growth 17.0% and currency effects -3.0%.
For the half year the increase of 7.8% was attributable to:
organic growth 12.6% and currency effects -4.8%.
4. Page 4 of 15
Sales in local currencies for the second quarter and for the half-year were significantly
higher in Europe, Asia, Latin America and Middle East and Africa. In North America, as a
consequence of ongoing destocking at distributors they were significantly lower for the
second quarter and lower for the half-year.
SKF has assisted S-OIL, a large South Korean oil refinery, to increase productivity and
reduce potential production downtime. The project resulted in a payback for S-OIL in less
than 11 months. The SKF solution included the development of asset strategy, defect
eliminations and operator driven reliability.
Three new SKF Solution Factories were inaugurated, one in Schweinfurt, Germany, one in
Montigny-le-Bretonneux, France and one in Moscow, Russia.
Automotive Division
The operating profit for the second quarter amounted to SEK 570 million (-468), resulting
in an operating margin of 9.8% (-9.6). The operating profit for the first half year
amounted to SEK 944 million (-905), resulting in an operating margin of 8.5% (-9.6).
Sales including intra-Group sales for the quarter were SEK 5,825 million (4,884), and for
the half year SEK 11,055 million (9,439).
Net sales for the second quarter amounted to SEK 4,850 million (4,126) and for the first
half year SEK 9,212 million (7,873). The increase of 17.6% for the quarter was
attributable to: organic growth 23.6% and currency effects -6.0%.
For the half year the increase of 17.0% was attributable to:
organic growth 24.8% and currency effects -7.8%.
Sales in local currencies to the car and light truck industries in Europe were higher for the
quarter and significantly higher for the half year. In North America, Asia and Latin America
sales were significantly higher both in the quarter and for the half year.
Sales to the heavy truck industries in Europe, North America and Asia were significantly
higher both for the quarter and for the half year.
Sales to the vehicle service market in Europe were significantly higher in the quarter and
for the half year. In North America sales were relatively unchanged in the quarter and
slightly lower for the half year. In Asia sales were higher in the quarter and significantly
higher for the half year.
Sales to the electrical industry in Europe as well as sales to the two-wheeler industry in
Asia were significantly higher both for the quarter and for the half year.
Parent company
For the first half year of 2010, profit before taxes was SEK 1,098 million (1,858), net sales
was 797 (779) and investments were SEK 0 million (0). Current financial assets were SEK
0.2 million (0.2) on 30 June and were SEK 0.2 million on 1 January. The average number
of employees was 220 (227) on 30 June.
5. Page 5 of 15
Previous outlook statement
Outlook for the second quarter of 2010
Sales development compared to second quarter last year
The demand for SKF products and services is expected to be significantly higher for the
Group in total. In Europe and North America it is expected to be higher and in Asia and Latin
America significantly higher. It is expected to be slightly higher for the Industrial Division
and significantly higher both for the Service Division and Automotive Division.
Sales development compared to the first quarter 2010
The demand is expected to be slightly higher for the SKF Group in total. In Europe and
North America it is expected to be slightly higher and in Asia and Latin America higher. For
both the Industrial Division and Service Division it is expected to be slightly higher and for
the Automotive Division higher.
Manufacturing level
The manufacturing level will be significantly higher year on year and higher compared to
the average of the first quarter 2010.
Highlights in the previous quarter
• SKF inaugurated two new factories in India. The factory in Haridwar will manufacture
deep groove ball bearings and the Ahmedabad factory will manufacture medium to
large size bearings of various types.
• A programme was concluded in March for adjusting the manufacturing capacity in
Gothenburg, Sweden. The total cost of these activities, around SEK 90 million, mainly
impacted the Industrial Division and has been charged to the income statement in the
first quarter. The benefit of these actions will be around SEK 50 million per year when
fully implemented by the third quarter.
• The ninth SKF Solution Factory was inaugurated in Houston, USA.
Risks and uncertainties in the business
The SKF Group operates in many different industrial, automotive and geographical
segments that are at different stages of the economic cycle. A general economic downturn
at global level, or in one of the world’s leading economies, could reduce the demand for
the Group’s products, solutions and services for a period of time. In addition, terrorism
and other hostilities, as well as disturbances in worldwide financial markets, could have a
negative effect on the demand for the Group’s products and services. There are also
political and regulatory risks associated with the wide geographical presence. Regulatory
requirements, taxes, tariffs and other trade barriers, price or exchange controls or other
governmental policies could limit the SKF Groups operations.
The SKF Group is subject to both transaction and translation of currency exposure. For
commercial flows the SKF Group is primarily exposed to the USD and to US dollar-related
currencies. As the major part of the profit is made outside Sweden, the Group is also
exposed to translational risks in all the major currencies. The parent company performs
services of a common Group character. The financial position of the parent company is
dependent on the financial position and development of the subsidiaries. A general decline
in the demand for the products and services provided by the Group could mean lower
dividend income for the parent company, as well as a need for writing down values of the
shares in the subsidiaries.
6. Page 6 of 15
Cautionary statement
This report contains forward-looking statements that are based on the current
expectations of the management of SKF. Although management believes that the
expectations reflected in such forward-looking statements are reasonable, no assurance
can be given that such expectations will prove to have been correct. Accordingly, results
could differ materially from those implied in the forward-looking statements as a result of,
among other factors, changes in economic, market and competitive conditions, changes in
the regulatory environment and other government actions, fluctuations in exchange rates
and other factors mentioned in SKF's latest annual report (available on www.skf.com)
under the Administration Report; "Important factors influencing the financial results",
"Financial risks" and "Sensitivity analysis", and in this full-year report under "Risks and
uncertainties in the business."
The Board of Directors and the CEO declare that the half-year report gives a fair view of
the performance of the business, position and profit or loss of the company and the
Group, and describes the principal risks and uncertainties that the company and the
companies in the Group face.
Göteborg, 14 July 2010
Aktiebolaget SKF
(publ.)
Tom Johnstone
President and CEO, Board member
Leif Östling Ulla Litzén Winnie Fok
Chairman Board member Board member
Hans-Olov Olsson Lena Treschow Torell Peter Grafoner
Board member Board member Board member
Lars Wedenborn Joe Loughrey Jouko Karvinen
Board member Board member Board member
Lennart Larsson Kennet Carlsson
Board member Board member
7. Page 7 of 15
Presentation
On SKF’s website http://investors.skf.com/ (click on Presentations).
Teleconference
On 15 July at 09.00 (CET), 08.00 (UK):
+46 (0)8 5052 0110 Swedish participants
+44 (0)20 7162 0077 European participants
Please note that the use of a loudspeaker when taking part in the teleconference has a
negative influence on the quality of the sound, which affects all participants.
It is also possible just to listen to the teleconference on http://investors.skf.com/
AB SKF may be required to disclose the information provided herein
according to the Securities Markets Act and/or the Financial Instruments
Trading Act. The information was submitted for publication at 8.00 (CEST)
on 15 July 2010.
Auditors' Review report
Introduction
We have reviewed the interim report for AB SKF (publ), reg. no 556007-3495, for the period 1
January – 30 June 2010. The board of directors and the CEO are responsible for the preparation and
presentation of this interim report in accordance with IAS 34 and the Annual Accounts Act. Our
responsibility is to express a conclusion on this interim report based on our review.
Scope of review
We conducted our review in accordance with the Standard on Review Engagements SÖG 2410,
Review of Interim Financial Information Performed by the Independent Auditor of the Entity issued by
FAR/SRS. A review of interim financial information consists of making inquiries, primarily of persons
responsible for financial and accounting matters, and applying analytical and other review procedures.
A review is substantially less in scope than an audit conducted in accordance with the Standards on
Auditing in Sweden RS and other generally accepted auditing practices. The procedures performed in
a review do not enable us to obtain a level of assurance that would make us aware of all significant
matters that might be identified in an audit. Therefore, the conclusion expressed based on a review
does not give the same level of assurance as a conclusion expressed based on an audit.
Conclusion
Based on our review, nothing has come to our attention that causes us to believe that the
accompanying interim report is not prepared, in all material respects, in accordance with IAS 34, the
Annual Accounts Act.
Stockholm, 14 July 2010
KPMG AB
Thomas Thiel
Authorized Public Accountant
8. Page 8 of 15
Enclosures:
Financial statements
1. Consolidated income statements
2. Consolidated statements of comprehensive income and consolidated statements of changes in
shareholders’ equity
3. Consolidated balance sheets
4. Consolidated statements of cash flow
Other financial statements
5. Consolidated financial information - yearly and quarterly comparisons
6. Segment information - yearly and quarterly comparisons
7. Parent company income statements, statements of comprehensive income, balance sheets and
footnotes.
The consolidated financial statements of the SKF Group are prepared in accordance with International
Financial Reporting Standards as adopted by EU. The SKF Group applies the same accounting policies
and methods of computation in the interim financial statements as compared with the Annual Report
2009 including Sustainability Report. No new or amended IFRS effective 2010 had any significant
impact on the Group.
The consolidated quarterly report has been prepared in accordance with IAS34. The report for the
parent company has been prepared in accordance with the Annual Accounts Act and RFR 2.2. The
report has been reviewed by the company’s auditors.
The SKF Nine-month report 2010 will be published on Tuesday, 19 October 2010.
Further information can be obtained from:
Ingalill Östman, Group Communication
tel: +46-31-3373260, mobile: +46-706-973260, e-mail: ingalill.ostman@skf.com
Marita Björk, Investor Relations
tel: +46-31-3371994, mobile: +46-705-181994, e-mail: marita.bjork@skf.com
Aktiebolaget SKF, SE-415 50 Göteborg, Sweden, Company reg.no. 556007-3495,
Tel: +46-31-3371000, fax: +46-31-3372832, www.skf.com
9. Page 9 of 15
Enclosure 1
CONSOLIDATED INCOME STATEMENTS (SEKm)
April-June April-June Jan-June Jan-June
2010 2009 2010 2009
Net sales 15,709 14,167 30,155 29,016
Cost of goods sold -11,336 -11,656 -22,037 -23,500
Gross profit 4,373 2,511 8,118 5,516
Selling and administrative expenses -2,128 -2,007 -4,160 -4,226
Other operating income/expenses - net -7 -25 -14 -39
Profit/loss from jointly controlled and
associated companies 1 -5 -3 -9
Operating profit 2,239 474 3,941 1,242
Operating margin, % 14.3 3.4 13.1 4.3
Financial income and expense - net -192 -162 -390 -399
Profit before taxes 2,047 312 3,551 843
Taxes -596 11 -1,030 -126
Net profit 1,451 323 2,521 717
Net profit attributable to
Shareholders of the parent 1,405 314 2,438 704
Non-controlling interests 46 9 83 13
Basic earnings per share, SEK* 3.09 0.69 5.36 1.55
Diluted earnings per share, SEK* 3.09 0.69 5.36 1.55
Additions to property, plant and equipment 433 442 822 936
Number of employees registered 41,644 42,422 41,644 42,422
Return on capital employed for the
12-month period ended 30 June, % 16.8 13.4 16.8 13.4
* Basic and diluted earnings per share are based on net profit attributable to shareholders of the parent.
NUMBER OF SHARES
Total number of shares 455,351,068 455,351,068 455,351,068 455,351,068
- whereof A shares 45,166,004 45,721,004 45,166,004 45,721,004
- whereof B shares 410,185,064 409,630,064 410,185,064 409,630,064
Total number of diluted shares outstanding 455,351,068 455,351,068 455,351,068 455,351,068
Total weighted average number of diluted
shares 455,351,068 455,351,068 455,351,068 455,380,005
10. Page 10 of 15
Enclosure 2
CONSOLIDATED STATEMENTS OF COMPREHENSIVE INCOME (SEKm)
April-June April-June Jan-June Jan-June
2010 2009 2010 2009
Net profit 1,451 323 2,521 717
Other comprehensive income
Exchange differences arising on translation of
foreign operations 426 -348 -105 150
Available-for-sale assets -26 15 -29 102
Cash flow hedges -77 216 -174 160
Actuarial gains and losses -560 -238 -861 -57
Income tax relating to components of other
comprehensive income 196 -32 240 -53
Other comprehensive income, net of tax -41 -387 -929 302
Total comprehensive income 1,410 -64 1,592 1,019
Total comprehensive income attributable to
Shareholders of AB SKF 1,320 -34 1,439 1,005
Non-controlling interests 90 -30 153 14
CONSOLIDATED STATEMENTS OF CHANGES IN SHAREHOLDERS’ EQUITY (SEKm)
June 2010 June 2009
Opening balance 1 January 18,280 19,689
Total comprehensive income 1,592 1,019
Exercise of options and cost for share programmes, net 15 -7
Other, including transactions with non-controlling interests - -189
Total cash dividends -1,611 -1,628
Closing balance 18,276 18,884
11. Page 11 of 15
Enclosure 3
CONSOLIDATED BALANCE SHEETS (SEKm)
June 2010 December 2009
Goodwill 2,685 2,759
Other intangible assets 1,177 1,255
Property, plant and equipment 13,717 13,933
Deferred tax assets 1,893 1,665
Other non-current assets 1,414 1,502
Non-current assets 20,886 21,114
Inventories 12,722 11,771
Trade receivables 10,639 8,800
Other current assets 2,689 3,590
Other current financial assets 3,855 5,740
Current assets 29,905 29,901
TOTAL ASSETS 50,791 51,015
Equity attributable to shareholders of AB SKF 17,271 17,411
Equity attributable to non-controlling interests 1,005 869
Long-term financial liabilities 7,763 8,987
Provisions for post-employment benefits 7,811 7,020
Provisions for deferred taxes 658 754
Other long-term liabilities and provisions 1,675 1,599
Non-current liabilities 17,907 18,360
Trade payables 4,802 3,989
Short-term financial liabilities 1,420 2,018
Other short-term liabilities and provisions 8,386 8,368
Current liabilities 14,608 14,375
TOTAL EQUITY AND LIABILITIES 50,791 51,015
12. Page 12 of 15
Enclosure 4
CONSOLIDATED STATEMENTS OF CASH FLOW (SEKm)
April-June April-June Jan-June Jan-June
2010 2009 2010 2009
Operating activities:
Operating profit 2,239 474 3,941 1,242
Depreciation, amortization and impairment 515 496 979 1,077
Net loss/gain (-) on sales of intangible assets, PPE,
equity securities, businesses and assets held for sale 21 6 33 9
Taxes -334 -291 -850 -560
Other including financial and non-cash items -586 854 -1,254 725
Changes in working capital -273 1,544 -890 1,617
Net cash flow from operations 1,582 3,083 1,959 4,110
Investing activities:
Payments in intangible assets, PPE, businesses and
equity securities -429 -666 -829 -1,174
Sales of intangible assets, PPE, businesses, assets held
for sale and equity securities 7 8 62 12
Net cash flow used in investing activities -422 -658 -767 -1,162
Net cash flow after investments before financing 1,160 2,425 1,192 2,948
Financing activities:
Change in short- and long-term loans -1,294 -987 -1,299 12
Payment of finance lease liabilities -2 3 -8 1
Cash dividends -1,610 -1,627 -1,611 -1,628
Investments in short-term financial assets -65 -1,233 -107 -1,506
Sales of short-term financial assets 93 53 227 228
Net cash flow used in financing activities -2,878 -3,791 -2,798 -2,893
NET CASH FLOW -1,718 -1,366 -1,606 55
Change in cash and cash equivalents:
Cash and cash equivalents at 1 April/1 January 4,550 4,278 4,430 2,793
Cash effect excl. acquired businesses -1,718 -1,366 -1,606 55
Exchange rate effect 78 -60 86 4
Cash and cash equivalents at 30 June 2,910 2,852 2,910 2,852
Change in net interest- Opening Translation Cash Businesses Other non Closing
bearing liabilities balance effect change acquired/ cash balance
1 Jan 2010 sold changes 30 June
2010
Loans, long- and short-term 10,750 -745 -1,299 - -14 8,692
Post-employment benefits, net 6,993 -158 -227 - 1,177 7,785
Financial assets, others -1,512 -26 120 - 75 -1,343
Cash and cash equivalents -4,430 -86 1,606 - - -2,910
Net interest-bearing
liabilities 11,801 -1,015 200 - 1,238 12,224
13. Page 13 of 15
Enclosure 5
CONSOLIDATED FINANCIAL INFORMATION –
YEARLY AND QUARTERLY COMPARISONS
(SEKm unless otherwise stated)
Full Half
year year
1/09 2/09 3/09 4/09 2009 1/10 2/10 2010
Net sales 14,849 14,167 13,324 13,887 56,227 14,446 15,709 30,155
Cost of goods sold -11,844 -11,656 -10,475 -11,049 -45,024 -10,701 -11,336 -22,037
Gross profit 3,005 2,511 2,849 2,838 11,203 3,745 4,373 8,118
Gross margin, % 20.2 17.7 21.4 20.4 19.9 25.9 27.8 26.9
Selling and administrative
expenses -2,219 -2,007 -1,851 -1,838 -7,915 -2,032 -2,128 -4,160
Other operating income/
expenses - net -14 -25 -37 2 -74 -7 -7 -14
Profit/loss from jointly
controlled and associated
companies -4 -5 -4 2 -11 -4 1 -3
Operating profit 768 474 957 1,004 3,203 1,702 2,239 3,941
Operating margin, % 5.2 3.4 7.2 7.2 5.7 11.8 14.3 13.1
Financial income and
expense - net -237 -162 -268 -239 -906 -198 -192 -390
Profit before taxes 531 312 689 765 2,297 1,504 2,047 3,551
Profit margin before taxes,% 3.6 2.2 5.2 5.5 4.1 10.4 13.0 11.8
Taxes -137 11 -206 -260 -592 -434 -596 -1,030
Net profit 394 323 483 505 1,705 1,070 1,451 2,521
Net profit attributable to
Shareholders of the parent 390 314 462 476 1,642 1,033 1,405 2,438
Non-controlling interests 4 9 21 29 63 37 46 83
Basic earnings per share, SEK* 0.86 0.69 1.01 1.05 3.61 2.27 3.09 5.36
Diluted earnings per share, SEK* 0.86 0.69 1.01 1.05 3.61 2.27 3.09 5.36
Dividend per share, SEK - 3.50 - - 3.50 - 3.50 3.50
Return on capital employed
for the 12-month period, % 18.7 13.4 10.2 9.1 9.1 11.9 16.8 16.8
Gearing, %** 50.1 51.1 52.9 49.3 49.3 48.3 47.4 47.4
Equity/assets ratio, % 35.9 34.6 33.5 35.8 35.8 36.2 36.0 36.0
Net worth per share, SEK* 43 40 36 38 38 38 38 38
Additions to property, plant
and equipment 494 442 534 505 1,975 389 433 822
Registered number of employees 43,653 42,422 41,756 41,172 41,172 41,055 41,644 41,644
* Basic and diluted earnings per share and Net worth per share are based on net profit attributable to shareholders
of the parent.
** Current- plus non-current loans plus provisions for post-employment benefits, net, as a percentage of the sum of
current- plus non-current loans, provisions for post-employment benefits, net, and shareholders equity, all at end
of interim period/year end.
14. Page 14 of 15
Enclosure 6
SEGMENT INFORMATION - YEARLY AND QUARTERLY COMPARISONS**
(SEKm unless otherwise stated)
Full Half
year year
1/09 2/09 3/09 4/09 2009 1/10 2/10 2010
Industrial Division
Net sales 5,802 4,844 4,380 4,508 19,534 4,695 4,873 9,568
Sales incl. intra-Group sales 8,187 7,120 6,494 6,745 28,546 7,105 7,514 14,619
Operating profit 635 344 335 237 1,551 713 909 1,622
Operating margin* 7.8% 4.8% 5.2% 3.5% 5.4% 10.0% 12.1% 11.1%
Operating margin excl. restructuring* 8.0% 5.5% 5.7% 6.6% 6.5% 11.2% 12.1% 11.7%
Assets and liabilities, net 18,734 17,474 15,948 15,966 15,966 15,511 15,960 15,960
Registered number of employees 19,010 18,616 18,093 17,853 17,853 17,701 17,715 17,715
Service Division
Net sales 5,011 4,944 4,636 5,008 19,599 5,093 5,635 10,728
Sales incl. intra-Group sales 5,118 5,028 4,713 5,098 19,957 5,181 5,725 10,906
Operating profit 598 636 622 729 2,585 647 745 1,392
Operating margin* 11.7% 12.7% 13.2% 14.3% 13.0% 12.5% 13.0% 12.8%
Operating margin excl. restructuring* 11.7% 12.9% 13.5% 14.6% 13.1% 12.5% 13.0% 12.8%
Assets and liabilities, net 5,471 5,333 4,734 4,819 4,819 5,345 5,650 5,650
Registered number of employees 5,940 5,823 5,761 5,725 5,725 5,731 5,710 5,710
Automotive Division
Net sales 3,747 4,126 4,068 4,110 16,051 4,362 4,850 9,212
Sales incl. intra-Group sales 4,555 4,884 4,784 4,880 19,103 5,230 5,825 11,055
Operating profit -437 -468 28 92 -785 374 570 944
Operating margin* -9.6% -9.6% 0.6% 1.9% -4.1% 7.2% 9.8% 8.5%
Operating margin excl. restructuring* -6.2% -0.6% 3.7% 5.5% 0.7% 7.2% 9.8% 8.5%
Assets and liabilities, net 10,359 9,143 8,177 8,073 8,073 8,437 8,502 8,502
Registered number of employees 14,318 13,744 13,778 13,480 13,480 13,569 14,002 14,002
* Operating margin is calculated on sales including intra-Group sales.
Reconciliation to profit before tax for the Group**
Jan-June 2010 Jan-June 2009
Operating profit:
Industrial Division 1,622 979
Service Division 1,392 1,234
Automotive Division 944 -905
Other operations outside the divisions 180 79
Unallocated Group activities and adjustments, net -197 -145
Financial net -390 -399
Profit before tax for the Group 3,551 843
** Previously published amounts have been restated to conform to the current Group structure in 2010. The structural
changes include business units being moved between the divisions and between other operations/Group activities and
divisions.
15. Page 15 of 15
Enclosure 7
PARENT COMPANY INCOME STATEMENTS (SEKm)
April-June April-June Jan-June Jan-June
2010 2009 2010 2009
Net sales 428 378 797 779
Cost of services provided -428 -378 -797 -779
Gross profit 0 0 0 0
Administrative expenses -61 -35 -132 -92
Other operating income/expenses – net -15 -13 -11 -13
Operating loss -76 -48 -143 -105
Financial income and expenses - net 1,288 1,902 1,241 1,963
Profit before taxes 1,212 1,854 1,098 1,858
Taxes 31 22 60 47
Net profit 1,243 1,876 1,158 1,905
PARENT COMPANY STATEMENTS of COMPREHENSIVE INCOME (SEKm)
April-June April-June Jan-June Jan-June
2010 2009 2010 2009
Net profit 1,243 1,876 1,158 1,905
Other comprehensive income
Available-for-sale assets -24 14 -27 102
Other comprehensive income, net of tax -24 14 -27 102
Total comprehensive income 1,219 1,890 1,131 2,007
PARENT COMPANY BALANCE SHEETS (SEKm)
Note June 2010 June 2009
Investments in subsidiaries 17,282 17,371
Receivables from subsidiaries 7,418 11,024
Other non-current assets 495 473
Non-current assets 25,195 28,868
Receivables from subsidiaries 1,718 2,362
Other receivables 249 316
Current assets 1,967 2,678
TOTAL ASSETS 27,162 31,546
Shareholders’ equity 1 9,759 8,664
Untaxed reserves 1,240 1,095
Provisions 154 171
Non-current liabilities 7,405 11,020
Current liabilities 8,604 10,596
TOTAL SHAREHOLDERS’ EQUITY,
PROVISIONS AND LIABILITIES 27,162 31,546
Contingent liabilities 5 4
Note 1. Shareholders’ equity (SEKm) June 2010 June 2009
Opening balance 1 January 10,207 8,258
Dividends -1,594 -1,594
Total comprehensive income 1,131 2,007
Exercise of options and cost for share programmes, net 15 -7
Closing balance 9,759 8,664