
Recomendados
Más contenido relacionado
La actualidad más candente
La actualidad más candente (19)
Destacado
Similar a Lesson 2 1
Similar a Lesson 2 1 (20)
Más de ambermaine100
Último
Último (20)
Lesson 2 1
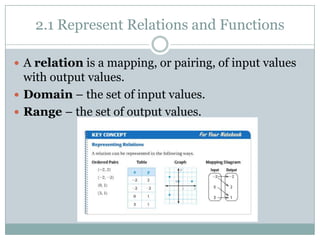
- 1. 2.1 Represent Relations and Functions A relation is a mapping, or pairing, of input values with output values. Domain – the set of input values. Range – the set of output values.
- 2. 2.1 Represent Relations and Functions
- 3. 2.1 Represent Relations and Functions Example 1 Consider the relation given by (3, 2), (-1, 0), (2, -1), (-2, 1), (0, 3) Identify the domain and range. Represent the relation using a graph and a mapping diagram.
- 4. 2.1 Represent Relations and Functions A Function is a relation for which each input has exactly one output. If any input has more than one output the relation is not a function. A function is always a relation. A relation is not always a function.
- 5. 2.1 Represent Relations and Functions Example 2 ANIMATION
- 6. 2.1 Represent Relations and Functions
- 7. 2.1 Represent Relations and Functions
- 8. 2.1 Represent Relations and Functions
- 9. 2.1 Represent Relations and Functions Many functions can be described as a function with two variables. Example: y = 3x – 5 The input variable is x, also known as independent variable. The output variable is y, also known as dependent variable. The output depends on the input. An ordered pair is a solution of an equation in two vairables. A graph is another way to represent the solutions of the equation.
- 10. 2.1 Represent Relations and Functions
- 11. 2.1 Represent Relations and Functions Example 4 Graph the equation y = 3x – 5. What is the minimum number of points you need? Where does the graph cross the y-axis?
- 12. 2.1 Represent Relations and Functions A function that can be written in the form y = mx + b where m and b are constants is called a linear function. When y is replaced by f(x) the function is written using function notation. y = mx + b Linear function in x-y notation f(x) = mx + b Linear function in function notation. The notation f(x) is read “the value of f at x” or “f of x” and identifies x as the independent variable.
- 13. 2.1 Represent Relations and Functions Example 5 Tell whether the function is linear. Then evaluate the function when x = -3. What is the domain & range? f(x) = -2x3 + 5 g(x) = 12 – 8x
- 14. 2.1 Represent Relations and Functions Graph y = 3x - 2
- 15. 2.1 Represent Relations and Functions
- 16. 2.1 Represent Relations and Functions In real life, you may need to restrict domain so that it is reasonable to the given situation. To do this inequalities are used.
- 17. 2.1 Represent Relations and Functions Example 6 The length L (in inches) that a spring stretches when a weight up to 20 pounds is attached to it is given by L(w) = 1/12w + 2, where w is the weight in pounds. Graph the function and determine a reasonable domain and range. What is the length of the spring when a 10 pound weight is attached?
- 18. 2.1 Represent Relations and Functions In 1960, the deep sea vessel Trieste descended to an estimated depth of 35,800 feet. Determine a reasonable domain and range of the function P(d) for this trip. P(d) = 1 + 0.03d
- 19. 2.1 Represent Relations and Functions How do you graph relations and functions?
- 20. 2.1 Extension
- 21. 2.1 Extension Example 1 Graph y = -x + 3 for x ≥ -1. Classify the function as discrete or continuous. Identify the range.
- 22. 2.1 Extension Example 2 Mrs. Malone buys paint for $20 per gallon. The function f(x) gives the cost of buying x gallons of paint. Write and graph the function described. Determine the domain and range. Then tell whether the function is discrete or continuous.
- 23. 2.1 Extension How do the graphs of discrete functions and continuous functions differ?