SlideShare una empresa de Scribd logo
1 de 2
Descargar para leer sin conexión
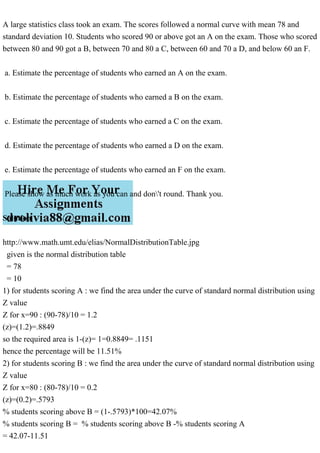
A large statistics class took an exam. The scores followed a normal curve with mean 78 and
standard deviation 10. Students who scored 90 or above got an A on the exam. Those who scored
between 80 and 90 got a B, between 70 and 80 a C, between 60 and 70 a D, and below 60 an F.
a. Estimate the percentage of students who earned an A on the exam.
b. Estimate the percentage of students who earned a B on the exam.
c. Estimate the percentage of students who earned a C on the exam.
d. Estimate the percentage of students who earned a D on the exam.
e. Estimate the percentage of students who earned an F on the exam.
Please show as much work as you can and don't round. Thank you.
Solution
http://www.math.umt.edu/elias/NormalDistributionTable.jpg
given is the normal distribution table
= 78
= 10
1) for students scoring A : we find the area under the curve of standard normal distribution using
Z value
Z for x=90 : (90-78)/10 = 1.2
(z)=(1.2)=.8849
so the required area is 1-(z)= 1=0.8849= .1151
hence the percentage will be 11.51%
2) for students scoring B : we find the area under the curve of standard normal distribution using
Z value
Z for x=80 : (80-78)/10 = 0.2
(z)=(0.2)=.5793
% students scoring above B = (1-.5793)*100=42.07%
% students scoring B = % students scoring above B -% students scoring A
= 42.07-11.51
= 30.56%
3) for students scoring C : we find the area under the curve of standard normal distribution using
Z value
Z for x=70 : (70-78)/10 = -0.8
(z)=(-0.8)=.2119
% students scoring above C = (1-.2119)*100=78.81%
% students scoring C = % students scoring above C -% students scoring above B
= 78.81-42.07
= 36.74%
4) for students scoring D : we find the area under the curve of standard normal distribution using
Z value
Z for x=60 : (60-78)/10 = -1.8
(z)=(-1.8)=.0359
% students scoring above D = (1-.0359)*100=96.41%
% students scoring D = % students scoring above D -% students scoring above C
= 96.41-78.81
= 17.60%
5) for students scoring F : we find the area under the curve of standard normal distribution using
Z value
Z for x=60 : (60-78)/10 = -1.8
(z)=(-1.8)=.0359
% students scoring F =100- % students scoring above D
% students scoring D = % students scoring above D -% students scoring above C = = 100 -
96.41
= 3.59%
Verification: Sum of all 5 percentages = 100

Más contenido relacionado

Similar a A large statistics class took an exam. The scores followed a normal .pdf

Qnt 351 final exam mcq`s correct answers 100%
Qnt 351 final exam mcq`s correct answers 100%Qnt 351 final exam mcq`s correct answers 100%
Qnt 351 final exam mcq`s correct answers 100%
Austing_3
 
Qnt 351 final exam mcq`s correct answers 100%
Qnt 351 final exam mcq`s correct answers 100%Qnt 351 final exam mcq`s correct answers 100%
Qnt 351 final exam mcq`s correct answers 100%
liamSali
 
(New) final exam for qnt 351 all correct answers 100%
(New) final exam for qnt 351 all correct answers 100%(New) final exam for qnt 351 all correct answers 100%
(New) final exam for qnt 351 all correct answers 100%
quikly11
 
(New) final exam for qnt 351 qnt 351 all correct answers 100%
(New) final exam for qnt 351 qnt 351 all correct answers 100%(New) final exam for qnt 351 qnt 351 all correct answers 100%
(New) final exam for qnt 351 qnt 351 all correct answers 100%
ri0908O0o
 

Similar a A large statistics class took an exam. The scores followed a normal .pdf (20)

QRB 501 Final Exam 2015 version
QRB 501 Final Exam 2015 versionQRB 501 Final Exam 2015 version
QRB 501 Final Exam 2015 version
 
QRB 501 Final Exam 2015 version
QRB 501 Final Exam 2015 versionQRB 501 Final Exam 2015 version
QRB 501 Final Exam 2015 version
 
Problem statement mathematical foundations
Problem statement mathematical foundationsProblem statement mathematical foundations
Problem statement mathematical foundations
 
Quantitative Aptitude Concepts
Quantitative Aptitude ConceptsQuantitative Aptitude Concepts
Quantitative Aptitude Concepts
 
Statistics for interpreting test scores
Statistics for interpreting test scoresStatistics for interpreting test scores
Statistics for interpreting test scores
 
3. Application of Normal Distribution@Dr. Vsingh.pdf
3. Application of Normal Distribution@Dr. Vsingh.pdf3. Application of Normal Distribution@Dr. Vsingh.pdf
3. Application of Normal Distribution@Dr. Vsingh.pdf
 
Lecture 10.4 bt
Lecture 10.4 btLecture 10.4 bt
Lecture 10.4 bt
 
GenEd_math.pdf
GenEd_math.pdfGenEd_math.pdf
GenEd_math.pdf
 
Ged Mathematical Test
Ged Mathematical TestGed Mathematical Test
Ged Mathematical Test
 
Applied 40S April 7, 2009
Applied 40S April 7, 2009Applied 40S April 7, 2009
Applied 40S April 7, 2009
 
Csci101 lect08b matlab_programs
Csci101 lect08b matlab_programsCsci101 lect08b matlab_programs
Csci101 lect08b matlab_programs
 
Statistics+-+11th+Elite+(1).pdf
Statistics+-+11th+Elite+(1).pdfStatistics+-+11th+Elite+(1).pdf
Statistics+-+11th+Elite+(1).pdf
 
Qnt 351 final exam mcq`s correct answers 100%
Qnt 351 final exam mcq`s correct answers 100%Qnt 351 final exam mcq`s correct answers 100%
Qnt 351 final exam mcq`s correct answers 100%
 
Qnt 351 final exam mcq`s correct answers 100%
Qnt 351 final exam mcq`s correct answers 100%Qnt 351 final exam mcq`s correct answers 100%
Qnt 351 final exam mcq`s correct answers 100%
 
(New) final exam for qnt 351 all correct answers 100%
(New) final exam for qnt 351 all correct answers 100%(New) final exam for qnt 351 all correct answers 100%
(New) final exam for qnt 351 all correct answers 100%
 
(New) final exam for qnt 351 qnt 351 all correct answers 100%
(New) final exam for qnt 351 qnt 351 all correct answers 100%(New) final exam for qnt 351 qnt 351 all correct answers 100%
(New) final exam for qnt 351 qnt 351 all correct answers 100%
 
Cumulative Frequency Revision
Cumulative Frequency RevisionCumulative Frequency Revision
Cumulative Frequency Revision
 
Measures of Dispersion: Standard Deviation and Co- efficient of Variation
Measures of Dispersion: Standard Deviation and Co- efficient of Variation Measures of Dispersion: Standard Deviation and Co- efficient of Variation
Measures of Dispersion: Standard Deviation and Co- efficient of Variation
 
Statistics Assignment Help
Statistics Assignment HelpStatistics Assignment Help
Statistics Assignment Help
 
Statistics and Probability Reviewer.pptx
Statistics and Probability Reviewer.pptxStatistics and Probability Reviewer.pptx
Statistics and Probability Reviewer.pptx
 

Más de amonkarsatish99

Más de amonkarsatish99 (12)

A major corporation has branch offices in eight major cities in the .pdf
A major corporation has branch offices in eight major cities in the .pdfA major corporation has branch offices in eight major cities in the .pdf
A major corporation has branch offices in eight major cities in the .pdf
 
A major advantage of community trials is that they are A. able .pdf
A major advantage of community trials is that they are A. able .pdfA major advantage of community trials is that they are A. able .pdf
A major advantage of community trials is that they are A. able .pdf
 
A machine has 9 identical components that function independently. T.pdf
A machine has 9 identical components that function independently.  T.pdfA machine has 9 identical components that function independently.  T.pdf
A machine has 9 identical components that function independently. T.pdf
 
A machine fills soda cans with amounts X, in ounces, that vary norma.pdf
A machine fills soda cans with amounts X, in ounces, that vary norma.pdfA machine fills soda cans with amounts X, in ounces, that vary norma.pdf
A machine fills soda cans with amounts X, in ounces, that vary norma.pdf
 
A loan is offered with monthly payments and a 10.50 percent APR. Wha.pdf
A loan is offered with monthly payments and a 10.50 percent APR. Wha.pdfA loan is offered with monthly payments and a 10.50 percent APR. Wha.pdf
A loan is offered with monthly payments and a 10.50 percent APR. Wha.pdf
 
A list of 50 subjects is entered into a computer file and then sorte.pdf
A list of 50 subjects is entered into a computer file and then sorte.pdfA list of 50 subjects is entered into a computer file and then sorte.pdf
A list of 50 subjects is entered into a computer file and then sorte.pdf
 
A legislative committee consists of 7 Democrats, 10 Republicans and .pdf
A legislative committee consists of 7 Democrats, 10 Republicans and .pdfA legislative committee consists of 7 Democrats, 10 Republicans and .pdf
A legislative committee consists of 7 Democrats, 10 Republicans and .pdf
 
A leverage point is a data point that 1. has an unusual respons.pdf
A leverage point is a data point that 1. has an unusual respons.pdfA leverage point is a data point that 1. has an unusual respons.pdf
A leverage point is a data point that 1. has an unusual respons.pdf
 
A large wooden floor is laid with strips 2 inches wide and with ne.pdf
A large wooden floor is laid with strips 2 inches wide and with ne.pdfA large wooden floor is laid with strips 2 inches wide and with ne.pdf
A large wooden floor is laid with strips 2 inches wide and with ne.pdf
 
A line has x and y intercepts as 5 and 2. What is the slope of the l.pdf
A line has x and y intercepts as 5 and 2. What is the slope of the l.pdfA line has x and y intercepts as 5 and 2. What is the slope of the l.pdf
A line has x and y intercepts as 5 and 2. What is the slope of the l.pdf
 
A large normal sample was used to construct two-sided (symmetric) 97.pdf
A large normal sample was used to construct two-sided (symmetric) 97.pdfA large normal sample was used to construct two-sided (symmetric) 97.pdf
A large normal sample was used to construct two-sided (symmetric) 97.pdf
 
A large Midwestern university is interested in estimating the mean t.pdf
A large Midwestern university is interested in estimating the mean t.pdfA large Midwestern university is interested in estimating the mean t.pdf
A large Midwestern university is interested in estimating the mean t.pdf
 

Último

Último (20)

9548086042 for call girls in Indira Nagar with room service
9548086042  for call girls in Indira Nagar  with room service9548086042  for call girls in Indira Nagar  with room service
9548086042 for call girls in Indira Nagar with room service
 
Nutritional Needs Presentation - HLTH 104
Nutritional Needs Presentation - HLTH 104Nutritional Needs Presentation - HLTH 104
Nutritional Needs Presentation - HLTH 104
 
Student login on Anyboli platform.helpin
Student login on Anyboli platform.helpinStudent login on Anyboli platform.helpin
Student login on Anyboli platform.helpin
 
IGNOU MSCCFT and PGDCFT Exam Question Pattern: MCFT003 Counselling and Family...
IGNOU MSCCFT and PGDCFT Exam Question Pattern: MCFT003 Counselling and Family...IGNOU MSCCFT and PGDCFT Exam Question Pattern: MCFT003 Counselling and Family...
IGNOU MSCCFT and PGDCFT Exam Question Pattern: MCFT003 Counselling and Family...
 
INDIA QUIZ 2024 RLAC DELHI UNIVERSITY.pptx
INDIA QUIZ 2024 RLAC DELHI UNIVERSITY.pptxINDIA QUIZ 2024 RLAC DELHI UNIVERSITY.pptx
INDIA QUIZ 2024 RLAC DELHI UNIVERSITY.pptx
 
General AI for Medical Educators April 2024
General AI for Medical Educators April 2024General AI for Medical Educators April 2024
General AI for Medical Educators April 2024
 
Software Engineering Methodologies (overview)
Software Engineering Methodologies (overview)Software Engineering Methodologies (overview)
Software Engineering Methodologies (overview)
 
Measures of Dispersion and Variability: Range, QD, AD and SD
Measures of Dispersion and Variability: Range, QD, AD and SDMeasures of Dispersion and Variability: Range, QD, AD and SD
Measures of Dispersion and Variability: Range, QD, AD and SD
 
Unit-IV- Pharma. Marketing Channels.pptx
Unit-IV- Pharma. Marketing Channels.pptxUnit-IV- Pharma. Marketing Channels.pptx
Unit-IV- Pharma. Marketing Channels.pptx
 
Introduction to Nonprofit Accounting: The Basics
Introduction to Nonprofit Accounting: The BasicsIntroduction to Nonprofit Accounting: The Basics
Introduction to Nonprofit Accounting: The Basics
 
Z Score,T Score, Percential Rank and Box Plot Graph
Z Score,T Score, Percential Rank and Box Plot GraphZ Score,T Score, Percential Rank and Box Plot Graph
Z Score,T Score, Percential Rank and Box Plot Graph
 
Advanced Views - Calendar View in Odoo 17
Advanced Views - Calendar View in Odoo 17Advanced Views - Calendar View in Odoo 17
Advanced Views - Calendar View in Odoo 17
 
Holdier Curriculum Vitae (April 2024).pdf
Holdier Curriculum Vitae (April 2024).pdfHoldier Curriculum Vitae (April 2024).pdf
Holdier Curriculum Vitae (April 2024).pdf
 
social pharmacy d-pharm 1st year by Pragati K. Mahajan
social pharmacy d-pharm 1st year by Pragati K. Mahajansocial pharmacy d-pharm 1st year by Pragati K. Mahajan
social pharmacy d-pharm 1st year by Pragati K. Mahajan
 
A Critique of the Proposed National Education Policy Reform
A Critique of the Proposed National Education Policy ReformA Critique of the Proposed National Education Policy Reform
A Critique of the Proposed National Education Policy Reform
 
SOCIAL AND HISTORICAL CONTEXT - LFTVD.pptx
SOCIAL AND HISTORICAL CONTEXT - LFTVD.pptxSOCIAL AND HISTORICAL CONTEXT - LFTVD.pptx
SOCIAL AND HISTORICAL CONTEXT - LFTVD.pptx
 
Key note speaker Neum_Admir Softic_ENG.pdf
Key note speaker Neum_Admir Softic_ENG.pdfKey note speaker Neum_Admir Softic_ENG.pdf
Key note speaker Neum_Admir Softic_ENG.pdf
 
Web & Social Media Analytics Previous Year Question Paper.pdf
Web & Social Media Analytics Previous Year Question Paper.pdfWeb & Social Media Analytics Previous Year Question Paper.pdf
Web & Social Media Analytics Previous Year Question Paper.pdf
 
microwave assisted reaction. General introduction
microwave assisted reaction. General introductionmicrowave assisted reaction. General introduction
microwave assisted reaction. General introduction
 
Advance Mobile Application Development class 07
Advance Mobile Application Development class 07Advance Mobile Application Development class 07
Advance Mobile Application Development class 07
 

A large statistics class took an exam. The scores followed a normal .pdf

  • 1. A large statistics class took an exam. The scores followed a normal curve with mean 78 and standard deviation 10. Students who scored 90 or above got an A on the exam. Those who scored between 80 and 90 got a B, between 70 and 80 a C, between 60 and 70 a D, and below 60 an F. a. Estimate the percentage of students who earned an A on the exam. b. Estimate the percentage of students who earned a B on the exam. c. Estimate the percentage of students who earned a C on the exam. d. Estimate the percentage of students who earned a D on the exam. e. Estimate the percentage of students who earned an F on the exam. Please show as much work as you can and don't round. Thank you. Solution http://www.math.umt.edu/elias/NormalDistributionTable.jpg given is the normal distribution table = 78 = 10 1) for students scoring A : we find the area under the curve of standard normal distribution using Z value Z for x=90 : (90-78)/10 = 1.2 (z)=(1.2)=.8849 so the required area is 1-(z)= 1=0.8849= .1151 hence the percentage will be 11.51% 2) for students scoring B : we find the area under the curve of standard normal distribution using Z value Z for x=80 : (80-78)/10 = 0.2 (z)=(0.2)=.5793 % students scoring above B = (1-.5793)*100=42.07% % students scoring B = % students scoring above B -% students scoring A = 42.07-11.51
  • 2. = 30.56% 3) for students scoring C : we find the area under the curve of standard normal distribution using Z value Z for x=70 : (70-78)/10 = -0.8 (z)=(-0.8)=.2119 % students scoring above C = (1-.2119)*100=78.81% % students scoring C = % students scoring above C -% students scoring above B = 78.81-42.07 = 36.74% 4) for students scoring D : we find the area under the curve of standard normal distribution using Z value Z for x=60 : (60-78)/10 = -1.8 (z)=(-1.8)=.0359 % students scoring above D = (1-.0359)*100=96.41% % students scoring D = % students scoring above D -% students scoring above C = 96.41-78.81 = 17.60% 5) for students scoring F : we find the area under the curve of standard normal distribution using Z value Z for x=60 : (60-78)/10 = -1.8 (z)=(-1.8)=.0359 % students scoring F =100- % students scoring above D % students scoring D = % students scoring above D -% students scoring above C = = 100 - 96.41 = 3.59% Verification: Sum of all 5 percentages = 100