
Recomendados
Más contenido relacionado
La actualidad más candente
La actualidad más candente (20)
Destacado
Destacado (20)
Similar a Big Bang Station Lab
Similar a Big Bang Station Lab (20)
Más de West Hollow MS Ms. Gill
Más de West Hollow MS Ms. Gill (20)
Último
Último (20)
Big Bang Station Lab
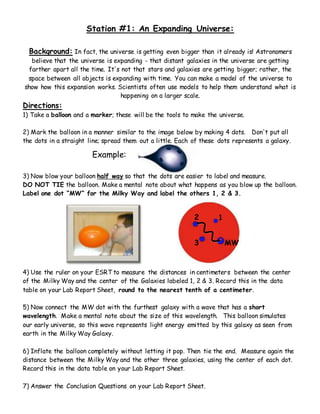
- 1. Station #1: An Expanding Universe: Background: In fact, the universe is getting even bigger than it already is! Astronomers believe that the universe is expanding - that distant galaxies in the universe are getting farther apart all the time. It's not that stars and galaxies are getting bigger; rather, the space between all objects is expanding with time. You can make a model of the universe to show how this expansion works. Scientists often use models to help them understand what is happening on a larger scale. Directions: 1) Take a balloon and a marker; these will be the tools to make the universe. 2) Mark the balloon in a manner similar to the image below by making 4 dots. Don't put all the dots in a straight line; spread them out a little. Each of these dots represents a galaxy. 3) Now blow your balloon half way so that the dots are easier to label and measure. DO NOT TIE the balloon. Make a mental note about what happens as you blow up the balloon. Label one dot “MW” for the Milky Way and label the others 1, 2 & 3. 4) Use the ruler on your ESRT to measure the distances in centimeters between the center of the Milky Way and the center of the Galaxies labeled 1, 2 & 3. Record this in the data table on your Lab Report Sheet, round to the nearest tenth of a centimeter. 5) Now connect the MW dot with the furthest galaxy with a wave that has a short wavelength. Make a mental note about the size of this wavelength. This balloon simulates our early universe, so this wave represents light energy emitted by this galaxy as seen from earth in the Milky Way Galaxy. 6) Inflate the balloon completely without letting it pop. Then tie the end. Measure again the distance between the Milky Way and the other three galaxies, using the center of each dot. Record this in the data table on your Lab Report Sheet. 7) Answer the Conclusion Questions on your Lab Report Sheet. 3 MW 2 1 Example:
- 2. Station #1: An Expanding Universe Conclusion After Thought: Your balloon model behaves similarly to the real universe. But like any model, it has its limitations. For one thing, the surface of the balloon (where you drew the dots) is two-dimensional, while the universe is three-dimensional. A three-dimensional model of the universe might be raisin bread dough rising in an oven. As the dough rises, each of the raisins gets farther away from all the other raisins. (See figure below) But the raisin bread dough model has its limitations too - you couldn't have measured the distances between the chips as easily as you could have with the balloon model. Conclusion Questions a. What happened to the distance between the Milky Way and the other Galaxies? Did it increase or decrease? b. What happened to the wavelength of your light wave as the balloon grows? Did it get longer or shorter? c. Graph the relationship between wavelength and distance, make distance the independent variable. d. What type of relationship is this? e. What has a longer wavelength: red light or blue light. f. Use this information to explain why light from distant galaxies display a red-shift in their spectrum.
- 3. Station #2 A Vast Universe: Background: It is very humbling to contemplate the size of our Universe because it is unbelievably BIG and therefore it can make you feel VERY small. However it’s also impressive that our civilization has acquired such great knowledge, and it reminds us that we as people are a part of a larger system. Directions: 1) Read the Conclusion Questions before you watch the short video. 2) Watch the video: Imax Cosmic Voyage- The Power of Ten 3) Answer the questions on your Lab Record Sheet. Conclusion Questions: a. What is an aerial view? b. What is a light year? c. What is the shape of our galaxy? d. How many stars are in our galaxy?
- 4. Station 5: Components of our Universe Background: There are many different celestial objects in our universe. It is important to understand the relative size of theses objects when compared to each other. Directions: Use the cards to arrange the components of our Universe in decreasing size order by placing them on the appropriate spot on the flow chart below. Record your answers on your lab record sheet.
- 6. Station 5: Components of our Universe Conclusion Conclusion Questions: Use the Data table to answer the following questions: a. According to this table, the average temperature of the universe since stage 3 has 1) decreased, only 2) increased, only 3) remained the same 4) increased, then decreased b. How soon did protons and neutrons form after the beginning of the universe? 1) 10–43 second 2) 10–32 second 3) 10–6 second 4) 13.7 billion years c. What is the most appropriate title for this table? 1) The Big Bang Theory 2) The Theory of Plate Tectonics 3) The Law of Superposition 4) The Laws of Planetary Motion d. Between which two stages did our solar system form? 1) 1 and 3 2) 3 and 5 3) 6 and 7 4) 7 and 8
- 7. Station #6 Cosmic Background Radiation & History Connect: Directions: 1) Put on the head phones and listen to what scientists believe the “Big Bang” might of sounded like. (You might need to hit the back button on the screen to replay the sound) 2) While listening, carefully read the information on the screen. 3) Answer Conclusion Questions 1-3 on your Lab Record Sheet. 4) With your partner discuss the 1965 News article titled “Murmur of a Bang” that you read for homework. 5) Answer Conclusion Questions 4-9 on your Lab Record Sheet Conclusion Questions: a. What do scientists propose the Big Bang really sounded like? b. In what form do we detect this energy from the Big Bang today? c. What happens to the sound waves as the Universe expands? d. What type of radiation was discovered coming from all regions of space? e. What is the importance of this discovery? What does it provide supporting evidence for? f. What are the names of the two scientists who discovered this radiation and what were they actually trying to find when they discovered the radiation?
- 8. Station #3: Doppler Effect Computer Program: Background: When an object is moving relative to an observer it distorts the way the observer perceives the object’s electromagnetic radiation. Whoa! What does that mean? Think about when an ambulance drives by, going very fast. The pitch of the siren changes as the ambulance approaches you and passes you. This is because the sound waves’ frequency is increased as it approaches you and then decreased as it drives away. Visualize this concept using the diagrams and the interactive animation at this station. Directions: 1) Click “Run Animation” 2) Observe the initial wavelength of the waves prorogating from the green dot. 3) Click on the dot and drag it around the screen. Try to drag it slow enough so that the word "Supersonic" doesn't appear in the upper left corner of the window. Observe the waves in front and behind the source (green dot). 4) Now Click “Source Motion” Enabled, keeping the tab on “Linear.” 5) Observe how the wavelength changes as the green dot moves across the screen. Note how the waves in front of the source compress together and the waves behind the source spread out. 6) Answer the Conclusion Questions on your Lab Report Sheet using your observations and the diagrams. Conclusion Questions: a. What happens to the wavelength in front of the source as it moves across the screen, does it get longer or shorter? b. If this was light would the waves in front of the source shift to blue or red? c. What happens to the wavelength behind the source as it moves across the screen, does it get longer or shorter? d. If this was light would the waves behind the source shift to blue or red?
- 9. Station #3: Doppler Effect Computer Program Diagrams:
- 10. Station #4: Using a Spectroscope Background: Astronomers use this same principleto look at the light from stars. Each star has a unique spectrum of color that combines to form the visible light that we see with the naked eye. This spectrum is dependent on the elements in the star and the temperature of the star. In order to see the spectrum of colors of any light scientists must use an instrument called a Spectroscope. At this station you will get to use a real spectroscope to look at different light sources. Directions: 1) Look through the spectroscope at Light Source A, which is a plain white 60 Watt bulb. Aim the vertical slit directly at the light. Since this is a white light, to the right of the slit you should see bands of color underneath the numbers that look like this: 4 5 6 7 2) Now look at Light Source B, which is a colored glow stick. Again aim the vertical slit directly at the light. Notice that this light is not made of a continuous spectrum of color like the white Light Source A. 3) Using the color pencils, draw the spectrum of light on the diagram on your Lab Report Sheet. Did you know? The color light that our eye interprets is actually a combination of many colors of the visible spectrum. For example, white light is actually a combination of all the colors of the electromagnetic spectrum. We can separate these colors with the use of a prism, just like on the cover of the Pink Floyd “Dark Side of the Moon” album. Try on the spectroscope glasses and look at the light to see for yourself.
- 11. Station #4: Using a Spectroscope; Conclusion After Thought: Due to the Doppler Effect, depending on how a light source is moving relative to us, we perceive the electromagnetic waves differently. In other words the electromagnetic spectrum of color that we observe with our spectroscope will shift if the light source is moving toward us or away from us. Use your knowledge of this principle and your ESRT to answer the following questions. Conclusion Questions: a. An astronomer can estimate the temperature of a star by observing its 1) size_ 2) shape 3) color 4) brightness b. The diagram below shows the spectral lines for an element. Which diagram best represents the spectral lines of this element when its light is observed coming from a star that is moving away from Earth? 1) 2) 3) 4)
- 12. Station #7: Extension: Making a Scale Model Directions: Using the same distance scale that we used to make the scale model of our Solar System calculate the amount of miles to the nearest Star: Proxima Centauri which is approximately 4.2 light years away. Show all your work and round to the nearest hundredth. Reminder: We used the following standard to compute the scale model of our Solar System: Helpful Conversions: 1 light year= 9.4605284 × 10¹² kilometers 1 mile = 1609.344 meters 1 Million Kilometers = 0.2 centimeters on our scale In other words… 5 Million Kilometers = 1 centimeter on our scale