Recomendados

Recomendados
Más contenido relacionado
Destacado
Destacado (12)
Similar a Improving research networking usability at UCSF
Similar a Improving research networking usability at UCSF (20)
Último
Último (20)
Improving research networking usability at UCSF
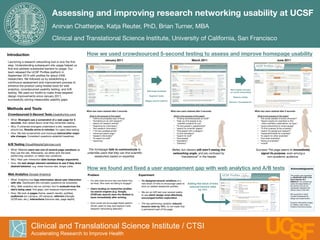
- 1. Assessing and improving research networking usability at UCSF Anirvan Chatterjee, Katja Reuter, PhD, Brian Turner, MBA Clinical and Translational Science Institute, University of California, San Francisco Introduction How we used crowdsourced 5-second testing to assess and improve homepage usability January 2011 March 2011 June 2011 Launching a research networking tool is only the first step. Understanding subsequent site usage helped us find and address substantial barriers to usage. Our team released the UCSF Profiles platform in September 2010 with profiles for about 2400 researchers. We followed up by establishing a continuous assessment and improvement process to enhance the product using hosted tools for web analytics, crowdsourced usability testing, and A/B New header focuses" Add large headings testing. We used our toolkit to make three targeted on social networking design improvements since January 2011, Segment tasks Reduce clutter successfully solving measurable usability gaps. Bigger search buttons Remove “translational” Methods and Tools What new users retained after 5 seconds: What new users retained after 5 seconds: What new users retained after 5 seconds: Crowdsourced 5-Second Tests (UsabilityHub.com) What is the purpose of this page? What is the purpose of this page? What is the purpose of this page? • “Online encyclopedia type of thing” • “Finding scientists/people at UCSF” • “the social website of some university?” • What: Strangers see a screenshot of a web page for 5 • “Something to do with research” • “help you find people to do" • “Search engine for scientists to find" seconds, then asked about what they remember seeing. • “search for research articles” scientific projects for you” other scientists, publications, by topic” • Why: If untrained strangers understand a site, researchers • “Searching for information” • “To find people in departments” • “social networking for smart people” • “find research information” • “search for scientific papers” • “To find a person at the university” should too. Results arrive in minutes, for rapid idea testing. • “118 have updated profile” • “find people with a category” • “search for people and research” • How: We test screenshots and mockups before/after major • “advanced search page” • “to find translators” • “facebook/linkedin for scientists” site changes. Consistent questions establish baselines. • “research information” • “search for stuff” • “to search for other scientists” • “To search for stuff” • “find people” • “find other scientists” • “searching” • “translation” • “listing of scientists” • “Directory” • “school” A/B Testing (VisualWebsiteOptimizer.com) " " • What: Website users see one of several page variations as The homepage fails to communicate to Better, but viewers still aren’t seeing the Success! The page seems to immediately they use the site. Afterwards, we either pick the best- unfamiliar users that they can find scientific networking angle, and are confused by signal its purpose, even among a" performing variation, or retest new variations. researchers based on expertise. “translational” in the header. non-academic audience. • Why: Real user interaction data trumps design arguments. • How: We test design element variations to see if they drive desired behavior, e.g. lower bounce rate, longer visits. How we found and fixed a user engagement gap with web analytics and A/B tests Acknowledgments Web Analytics (Google Analytics) Problem Experiment This project was supported by NIH/NCRR UCSF-CTSI • What: Analytics tool logs information about user interaction • Our site-wide bounce rate was higher than • We designed several variations of a Grant Number UL1 RR024131. Its contents are with site. Dashboard lets complex questions be answered. we liked. Who were we failing to engage? new block of links to encourage users to Adding this block of links solely the responsibility of • Why: Web analytics are our primary tool to evaluate how the click on related researcher profiles. reduced bounce rates the authors and do not necessarily represent the site’s being used, find gaps, and measure improvements. • Users landing on researcher profiles by 15% official views of the NIH. via search engines (e.g. Google, • We ran an A/B test over several weeks " • How: We look at pages (home, search results, profiles), UCSF.edu search) were the likeliest to We would like to thank to see which design most effectively audiences (on-campus, off-campus), referrers (Google, leave immediately after arriving. Cynthia Piontkowski for encouraged further exploration. design and implemention. UCSF.edu, etc.), interactions (bounce rate, page depth). • How could we encourage these search- • The top performing variation reduced Evolution silhouettes images by TeeKay, used under a driven users to stay and explore more bounce rates by 15%, so we made that Creative Commons license. research networking features? a permanent part of the page. Clinical and Translational Science Institute / CTSI Accelerating Research to Improve Health UC F S