![Purpose ,[object Object],[object Object],[object Object],[object Object],[object Object]](data:image/gif;base64,R0lGODlhAQABAIAAAAAAAP///yH5BAEAAAAALAAAAAABAAEAAAIBRAA7)
Recomendados
Más contenido relacionado
La actualidad más candente
La actualidad más candente (20)
Destacado
Destacado (12)
Similar a Landscape Position and Coastal Marsh Loss
Similar a Landscape Position and Coastal Marsh Loss (20)
Último
Último (20)
Landscape Position and Coastal Marsh Loss
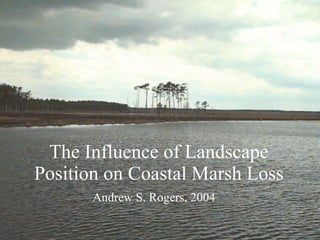
- 1. The Influence of Landscape Position on Coastal Marsh Loss Andrew S. Rogers, 2004
- 7. Hypotheses Marsh loss can be correlated with specific topological features The probability of a grid cell being completely open water Hypothesis 2. is positively related to its distance from the nearest tidal creek Hypothesis 4. is positively related to its distance from the nearest upland. Hypothesis 1. is negatively related to its distance from a road. Hypothesis 3. is negatively related to its distance upstream. Hypothesis 5. is negatively related to the size of the marsh parcel containing the grid cell .
- 8. Simplified Mass Balance Estuary/ Tidal Creek Upland Marsh PO 4 3- ,NO 3 - Sediment Ground Water Fe 3+ SO 3 2- ,Na + Sediment Surface Water Anoxic Layer Peat Air Oxic Layer
- 9. Simplified Mass Balance Estuary/ Tidal Creek Upland Marsh PO 4 3- ,NO 3 - Sediment Ground Water Fe 3+ SO 3 2- ,Na + Sediment Incoming tide adds nutrients, salt and sediment. Runoff from uplands provides nutrients and sediment. Surface Water Anoxic Layer Peat Air Oxic Layer
- 10. Simplified Mass Balance Estuary/ Tidal Creek Upland Marsh PO 4 3- ,NO 3 - Sediment Ground Water Fe 3+ SO 3 2- ,Na + Sediment A levee begins to build near the tidal creek, capturing sediments there. Levee Surface Water Anoxic Layer Peat Air Oxic Layer
- 11. Simplified Mass Balance Estuary/ Tidal Creek Upland Marsh PO 4 3- ,NO 3 - Sediment Ground Water Fe 3+ SO 3 2- ,Na + Sediment Levee building results in high sediment input and frequent flushing at creek edge, low sediment input with longer water residence times in midmarsh areas. Levee Surface Water Anoxic Layer Peat Air Oxic Layer
- 12. Simplified Mass Balance Estuary/ Tidal Creek Upland Marsh PO 4 3- ,NO 3 - Sediment Ground Water Fe 3+ SO 3 2- ,Na + Sediment Road Construction of a road can trap sediments on the landward side. Levee Surface Water Anoxic Layer Peat Air Oxic Layer
- 13. Simplified Mass Balance Estuary/ Tidal Creek Upland Marsh Ground Water Fe 3+ SO 3 2- ,Na + Sediment Road Incoming spring tide can wash over the road leaving a pool of water that does not drain rapidly. Salinity can increase and plants may be stressed or drowned. Levee PO 4 3- ,NO 3 - Sediment Surface Water Anoxic Layer Peat Air Oxic Layer
- 14. Predicting Marsh Loss Estuary/ Tidal Creek Upland Marsh PO 4 3- ,NO 3 - SO 3 2- ,Na + Sediment Accretion Sediment Ground Water Fe 3+ Sediment Sea Level Rise The marsh will tend to survive where sediment accretion and relative sea level height remain in balance and disappear elsewhere. Surface Water Anoxic Layer Peat Air Oxic Layer
- 15. Aerial photo of Blackwater National Wildlife Refuge. A road transects the marsh from top to bottom. Note the much greater loss on the right, downstream from the road – possibly due to sediment trapping upstream of the road.
- 16. Marsh Loss
- 22. 1 2 3 4 5 7 TM Bands Bands 1, 2 and 7 from Richards, 1986; Bands 3, 4 and 5 from CMP TM Images
- 24. Validation of remote sensing model 83% accurate for classification into four classes (Stevens, 1997). Table 14 Validation of Coastal Marsh Loss Project Data on the Delaware Bay Actual Row Totals Healthy Degraded Predicted Healthy 178 1 179 Degraded 0 6 6 Column Totals 178 7 185 Percent predicted correctly Healthy 99 G-Adjusted 47.205 1 Degraded 100 Chi-square value 10.828 Total 99 Level of Significance 0.001 1 A value of 10 -15 was added to the zero-valued cell in the contingency table to calculate the G value because the calculation involves a logarithm.
- 25. Results ln(probability) By ln(distance) Linear Fit Summary of Fit Rsquare 0.971589 Root Mean Square Error 8.718909 Mean of Response -2.21375 Observations (or Sum Wgts) 1862093 Effect of Tidal Creeks on Atlantic Coast Marshes
- 26. Results ln(probability) By ln(Distance from Land) Linear Fit Summary of Fit Rsquare 0.871136 Root Mean Square Error 13.42716 Mean of Response -3.15712 Observations (or Sum Wgts) 2178017 Effect of distance from uplands on marshes in the Chesapeake and Delaware Bays
- 27. Results ln(probability) By ln(Upstream Distance) Linear Fit Summary of Fit Rsquare 0.237701 Root Mean Square Error 20.18101 Mean of Response -3.12739 Observations (or Sum Wgts) 2175076 Effect of Upstream Distance on Atlantic Coast Marshes
- 28. Results ln(probability) By ln(area) Polynomial Fit, degree=2 Summary of Fit Rsquare 0.391991 Root Mean Square Error 33.05177 Mean of Response -2.21751 Observations (or Sum Wgts) 1884171 Effect of marsh size on Atlantic Coast Marshes
- 29. Results Rejected 0.391991 Variable 2 nd order Negative Rejected 0.280912 Variable 2 nd order Negative Area Not rejected 0.88531 Positive Positive Not rejected 0.871136 Positive Positive Distance from Upland Not rejected 0.237701 Negative Negative Not rejected 0.264358 Negative Negative Distance Upstream Rejected 0.971589 Positive Positive Not rejected 0.990931 Positive Positive Distance from Tidal Creeks Rejected 0.97685 Positive Negative Rejected 0.419392 Positive Negative Distance from Roads Conclusion R-Square Correlation Found Predicted Correlation Hypothesis: Marsh loss is correlated with: