Georgia Housing Market Snapshot For November 2018
•
0 recomendaciones•5,801 vistas

Georgia Housing Market Snapshot For November 2018. All information provided courtesy of the Georgia Association REALTORS®

Recomendados
Recomendados
Más contenido relacionado
La actualidad más candente
La actualidad más candente (20)
Similar a Georgia Housing Market Snapshot For November 2018
Similar a Georgia Housing Market Snapshot For November 2018 (14)
Más de Arthur Prescott
Más de Arthur Prescott (20)
Último
Último (20)
Georgia Housing Market Snapshot For November 2018
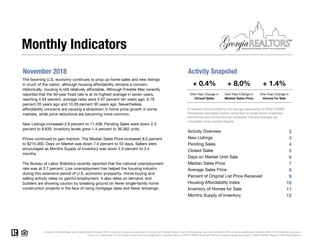
- 1. November 2018 Activity Snapshot One-Year Change in One-Year Change in Closed Sales Median Sales Price 2 3 4 5 6 7 8 9 10 11 12 Changes in methodology were implemented in October 2012 to provide a more accurate count of inventory and related metrics. Due to MLS purging rules, activity before 2008 cannot be updated and therefore shifts in the trendlines may occur. Current as of December 16, 2018. Data comes from the Georgia MLS, Columbus Board of REALTORS®, Savannah MLS and Greater Augusta Association of REALTORS®. Report © 2018 ShowingTime. Pending Sales Closed Sales Days on Market Until Sale Median Sales Price Average Sales Price Percent of Original List Price Received The booming U.S. economy continues to prop up home sales and new listings in much of the nation, although housing affordability remains a concern. Historically, housing is still relatively affordable. Although Freddie Mac recently reported that the 30-year fixed rate is at its highest average in seven years, reaching 4.94 percent, average rates were 5.97 percent ten years ago, 6.78 percent 20 years ago and 10.39 percent 30 years ago. Nevertheless, affordability concerns are causing a slowdown in home price growth in some markets, while price reductions are becoming more common. New Listings increased 2.9 percent to 11,438. Pending Sales were down 2.3 percent to 8,630. Inventory levels grew 1.4 percent to 36,362 units. Prices continued to gain traction. The Median Sales Price increased 8.0 percent to $215,000. Days on Market was down 7.0 percent to 53 days. Sellers were encouraged as Months Supply of Inventory was down 2.9 percent to 3.4 months. The Bureau of Labor Statistics recently reported that the national unemployment rate was at 3.7 percent. Low unemployment has helped the housing industry during this extensive period of U.S. economic prosperity. Home buying and selling activity relies on gainful employment. It also relies on demand, and builders are showing caution by breaking ground on fewer single-family home construction projects in the face of rising mortgage rates and fewer showings. Homes for Sale A research tool provided by the Georgia Association of REALTORS®. Residential real estate activity comprised of single-family properties, townhomes and condominiums combined. Percent changes are calculated using rounded figures. Activity Overview New Listings Housing Affordability Index Inventory of Homes for Sale Months Supply of Inventory Monthly Indicators + 0.4% + 8.0% + 1.4% One-Year Change in
- 2. Activity Overview Key Metrics Historical Sparkbars 11-2017 11-2018 Percent Change YTD 2017 YTD 2018 Percent Change Current as of December 16, 2018. Data comes from the Georgia MLS, Columbus Board of REALTORS®, Savannah MLS and Greater Augusta Association of REALTORS®. Report © 2018 ShowingTime. | 2 + 0.6% Housing Affordability Index 197 159 - 19.3% 196 157 - 19.9% Pct. of Orig. Price Received 95.8% 95.8% 0.0% 96.1% 96.7% -- -- -- Inventory of Homes for Sale 35,871 36,362 + 1.4% -- -- Months Supply of Inventory 3.5 3.4 - 2.9% -- + 9.0% Average Sales Price $244,993 $260,577 + 6.4% $245,067 $263,108 + 7.4% Median Sales Price $198,985 $215,000 + 8.0% $200,000 $218,000 + 3.9% Days on Market Until Sale 57 53 - 7.0% 57 51 - 10.5% Closed Sales 9,335 9,370 + 0.4% 114,055 118,491 Key metrics by report month and for year-to-date (YTD) starting from the first of the year. New Listings 11,112 11,438 + 2.9% 166,433 + 4.1% Pending Sales 8,834 8,630 - 2.3% 117,139 121,130 + 3.4% 159,868 11-2015 11-2016 11-2017 11-2018 11-2015 11-2016 11-2017 11-2018 11-2015 11-2016 11-2017 11-2018 11-2015 11-2016 11-2017 11-2018 11-2015 11-2016 11-2017 11-2018 11-2015 11-2016 11-2017 11-2018 11-2015 11-2016 11-2017 11-2018 11-2015 11-2016 11-2017 11-2018 11-2015 11-2016 11-2017 11-2018 11-2015 11-2016 11-2017 11-2018
- 3. New Listings Prior Year Percent Change December 2017 8,261 8,131 +1.6% January 2018 12,236 12,715 -3.8% February 2018 13,656 13,420 +1.8% March 2018 17,100 17,567 -2.7% April 2018 16,841 15,566 +8.2% May 2018 17,617 17,088 +3.1% June 2018 17,383 16,856 +3.1% July 2018 15,876 15,051 +5.5% August 2018 15,889 15,228 +4.3% September 2018 13,681 12,127 +12.8% October 2018 14,716 13,138 +12.0% November 2018 11,438 11,112 +2.9% 12-Month Avg 14,558 14,000 +4.0% Historical New Listings by Month Current as of December 16, 2018. Data comes from the Georgia MLS, Columbus Board of REALTORS®, Savannah MLS and Greater Augusta Association of REALTORS®. Report © 2018 ShowingTime. | 3 A count of the properties that have been newly listed on the market in a given month. New Listings 10,138 11,112 11,438 2016 2017 2018 November 6,000 8,000 10,000 12,000 14,000 16,000 18,000 1-2012 1-2013 1-2014 1-2015 1-2016 1-2017 1-2018 156,696 159,868 166,433 2016 2017 2018 Year to Date + 4.1%+ 9.6% + 2.9% + 2.0%+ 4.2% + 4.2%
- 4. Pending Sales Prior Year Percent Change December 2017 7,321 6,816 +7.4% January 2018 9,494 8,753 +8.5% February 2018 10,221 9,990 +2.3% March 2018 12,825 12,612 +1.7% April 2018 12,847 11,694 +9.9% May 2018 12,624 12,227 +3.2% June 2018 11,984 11,730 +2.2% July 2018 11,466 11,187 +2.5% August 2018 11,281 11,111 +1.5% September 2018 9,662 8,914 +8.4% October 2018 10,096 10,087 +0.1% November 2018 8,630 8,834 -2.3% 12-Month Avg 10,704 10,330 +3.6% Historical Pending Sales by Month Current as of December 16, 2018. Data comes from the Georgia MLS, Columbus Board of REALTORS®, Savannah MLS and Greater Augusta Association of REALTORS®. Report © 2018 ShowingTime. | 4 A count of the properties on which offers have been accepted in a given month. Pending Sales 7,783 8,834 8,630 2016 2017 2018 November 4,000 6,000 8,000 10,000 12,000 14,000 1-2012 1-2013 1-2014 1-2015 1-2016 1-2017 1-2018 110,473 117,139 121,130 2016 2017 2018 Year to Date + 3.4%+ 13.5% - 2.3% + 6.0%+ 7.3% + 9.8%
- 5. Closed Sales Prior Year Percent Change December 2017 9,777 9,230 +5.9% January 2018 7,115 6,616 +7.5% February 2018 8,155 7,523 +8.4% March 2018 11,176 11,356 -1.6% April 2018 11,369 10,265 +10.8% May 2018 13,078 12,464 +4.9% June 2018 13,159 13,162 -0.0% July 2018 12,380 11,398 +8.6% August 2018 12,333 11,873 +3.9% September 2018 10,042 10,146 -1.0% October 2018 10,314 9,917 +4.0% November 2018 9,370 9,335 +0.4% 12-Month Avg 10,689 10,274 +4.0% Historical Closed Sales by Month Current as of December 16, 2018. Data comes from the Georgia MLS, Columbus Board of REALTORS®, Savannah MLS and Greater Augusta Association of REALTORS®. Report © 2018 ShowingTime. | 5 A count of the actual sales that closed in a given month. Closed Sales 8,567 9,335 9,370 2016 2017 2018 November 4,000 6,000 8,000 10,000 12,000 14,000 1-2012 1-2013 1-2014 1-2015 1-2016 1-2017 1-2018 107,179 114,055 118,491 2016 2017 2018 Year to Date + 3.9%+ 9.0% + 0.4% + 6.4%+ 23.9% + 10.8%
- 6. Days on Market Until Sale Prior Year Percent Change December 2017 61 65 -6.2% January 2018 63 68 -7.4% February 2018 62 72 -13.9% March 2018 58 66 -12.1% April 2018 52 59 -11.9% May 2018 48 53 -9.4% June 2018 46 53 -13.2% July 2018 46 50 -8.0% August 2018 45 51 -11.8% September 2018 49 53 -7.5% October 2018 50 55 -9.1% November 2018 53 57 -7.0% 12-Month Avg* 52 58 -10.3% Historical Days on Market Until Sale by Month Current as of December 16, 2018. Data comes from the Georgia MLS, Columbus Board of REALTORS®, Savannah MLS and Greater Augusta Association of REALTORS®. Report © 2018 ShowingTime. | 6 Average number of days between when a property is listed and when an offer is accepted in a given month. Days on Market * Average Days on Market of all properties from December 2017 through November 2018. This is not the average of the individual figures above. 60 57 53 2016 2017 2018 November 40 50 60 70 80 90 100 110 1-2012 1-2013 1-2014 1-2015 1-2016 1-2017 1-2018 64 57 51 2016 2017 2018 Year to Date - 10.5%- 5.0% - 7.0% - 10.9%- 18.9% - 13.5%
- 7. Median Sales Price Prior Year Percent Change December 2017 $205,638 $188,995 +8.8% January 2018 $196,500 $182,900 +7.4% February 2018 $204,000 $186,500 +9.4% March 2018 $215,000 $195,000 +10.3% April 2018 $219,000 $200,000 +9.5% May 2018 $224,000 $204,000 +9.8% June 2018 $229,900 $210,000 +9.5% July 2018 $225,000 $208,500 +7.9% August 2018 $216,000 $203,000 +6.4% September 2018 $220,000 $199,000 +10.6% October 2018 $215,260 $200,000 +7.6% November 2018 $215,000 $198,985 +8.0% 12-Month Med* $217,000 $199,900 +8.6% Historical Median Sales Price by Month Current as of December 16, 2018. Data comes from the Georgia MLS, Columbus Board of REALTORS®, Savannah MLS and Greater Augusta Association of REALTORS®. Report © 2018 ShowingTime. | 7 Point at which half of the sales sold for more and half sold for less, not accounting for seller concessions, in a given month. Median Sales Price * Median Sales Price of all properties from December 2017 through November 2018. This is not the average of the individual figures above. $188,000 $198,985 $215,000 2016 2017 2018 November $75,000 $100,000 $125,000 $150,000 $175,000 $200,000 $225,000 $250,000 1-2012 1-2013 1-2014 1-2015 1-2016 1-2017 1-2018 $187,900 $200,000 $218,000 2016 2017 2018 Year to Date + 9.0%+ 5.8% + 8.0% + 6.4%+ 7.4% + 6.0%
- 8. Average Sales Price Prior Year Percent Change December 2017 $248,977 $234,218 +6.3% January 2018 $240,561 $225,231 +6.8% February 2018 $244,199 $225,314 +8.4% March 2018 $259,054 $238,889 +8.4% April 2018 $264,531 $246,846 +7.2% May 2018 $272,108 $251,347 +8.3% June 2018 $279,320 $255,388 +9.4% July 2018 $272,336 $256,251 +6.3% August 2018 $262,624 $246,615 +6.5% September 2018 $260,704 $242,184 +7.6% October 2018 $258,475 $245,217 +5.4% November 2018 $260,577 $244,993 +6.4% 12-Month Avg* $262,031 $244,255 +7.3% Historical Average Sales Price by Month Current as of December 16, 2018. Data comes from the Georgia MLS, Columbus Board of REALTORS®, Savannah MLS and Greater Augusta Association of REALTORS®. Report © 2018 ShowingTime. | 8 Average sales price for all closed sales, not accounting for seller concessions, in a given month. Avg. Sales Price * Avg. Sales Price of all properties from December 2017 through November 2018. This is not the average of the individual figures above. $234,672 $244,993 $260,577 2016 2017 2018 November $100,000 $150,000 $200,000 $250,000 $300,000 1-2012 1-2013 1-2014 1-2015 1-2016 1-2017 1-2018 $232,727 $245,067 $263,108 2016 2017 2018 Year to Date + 7.4%+ 4.4% + 6.4% + 5.3%+ 7.5% + 4.6%
- 9. Percent of Original List Price Received Prior Year Percent Change December 2017 95.8% 94.8% +1.1% January 2018 95.6% 95.0% +0.6% February 2018 96.1% 95.3% +0.8% March 2018 96.7% 95.9% +0.8% April 2018 97.2% 96.3% +0.9% May 2018 97.4% 96.7% +0.7% June 2018 97.4% 96.6% +0.8% July 2018 97.3% 96.4% +0.9% August 2018 96.7% 96.0% +0.7% September 2018 96.4% 96.1% +0.3% October 2018 96.0% 95.7% +0.3% November 2018 95.8% 95.8% 0.0% 12-Month Avg* 96.6% 96.0% +0.6% Historical Percent of Original List Price Received by Month Current as of December 16, 2018. Data comes from the Georgia MLS, Columbus Board of REALTORS®, Savannah MLS and Greater Augusta Association of REALTORS®. Report © 2018 ShowingTime. | 9 Percentage found when dividing a property’s sales price by its original list price, then taking the average for all properties sold in a given month, not accounting for seller concessions. Pct. of Orig. Price Received * Average Pct. of Orig. Price Received for all properties from December 2017 through November 2018. This is not the average of the individual figures above. 95.1% 95.8% 95.8% 2016 2017 2018 November 88% 90% 92% 94% 96% 98% 1-2012 1-2013 1-2014 1-2015 1-2016 1-2017 1-2018 95.5% 96.1% 96.7% 2016 2017 2018 Year to Date + 0.6%+ 0.7% 0.0% + 0.6%+ 0.8% + 1.0%
- 10. Housing Affordability Index Prior Year Percent Change December 2017 188 198 -5.1% January 2018 191 202 -5.4% February 2018 183 204 -10.3% March 2018 173 194 -10.8% April 2018 167 193 -13.5% May 2018 163 191 -14.7% June 2018 160 186 -14.0% July 2018 164 188 -12.8% August 2018 169 194 -12.9% September 2018 161 198 -18.7% October 2018 155 194 -20.1% November 2018 159 197 -19.3% 12-Month Avg 169 169 0.0% Historical Housing Affordability Index by Month Current as of December 16, 2018. Data comes from the Georgia MLS, Columbus Board of REALTORS®, Savannah MLS and Greater Augusta Association of REALTORS®. Report © 2018 ShowingTime. | 10 This index measures housing affordability for the region. For example, an index of 120 means the median household income is 120% of what is necessary to qualify for the median-priced home under prevailing interest rates. A higher number means greater affordability. Affordability Index 206 197 159 2016 2017 2018 November 100 200 300 400 500 1-2012 1-2013 1-2014 1-2015 1-2016 1-2017 1-2018 206 196 157 2016 2017 2018 Year to Date - 19.9%- 4.4% - 19.3% - 4.9%- 8.8% - 7.6%
- 11. Inventory of Homes for Sale Prior Year Percent Change December 2017 33,201 37,325 -11.0% January 2018 31,727 36,500 -13.1% February 2018 32,072 36,503 -12.1% March 2018 33,050 37,711 -12.4% April 2018 33,974 38,095 -10.8% May 2018 35,608 39,232 -9.2% June 2018 37,347 40,558 -7.9% July 2018 37,806 40,412 -6.4% August 2018 38,107 39,899 -4.5% September 2018 37,927 38,867 -2.4% October 2018 37,906 37,539 +1.0% November 2018 36,362 35,871 +1.4% 12-Month Avg 35,424 38,209 -7.3% Historical Inventory of Homes for Sale by Month Current as of December 16, 2018. Data comes from the Georgia MLS, Columbus Board of REALTORS®, Savannah MLS and Greater Augusta Association of REALTORS®. Report © 2018 ShowingTime. | 11 The number of properties available for sale in active status at the end of a given month. Homes for Sale 40,336 35,871 36,362 2016 2017 2018 November 30,000 35,000 40,000 45,000 50,000 1-2012 1-2013 1-2014 1-2015 1-2016 1-2017 1-2018 - 11.1% + 1.4%- 9.5%
- 12. Months Supply of Inventory Prior Year Percent Change December 2017 3.2 3.8 -15.8% January 2018 3.0 3.7 -18.9% February 2018 3.1 3.7 -16.2% March 2018 3.2 3.8 -15.8% April 2018 3.2 3.8 -15.8% May 2018 3.4 3.9 -12.8% June 2018 3.5 4.1 -14.6% July 2018 3.6 4.0 -10.0% August 2018 3.6 3.9 -7.7% September 2018 3.5 3.8 -7.9% October 2018 3.5 3.7 -5.4% November 2018 3.4 3.5 -2.9% 12-Month Avg 3.3 3.8 -13.2% Historical Months Supply of Inventory by Month Current as of December 16, 2018. Data comes from the Georgia MLS, Columbus Board of REALTORS®, Savannah MLS and Greater Augusta Association of REALTORS®. Report © 2018 ShowingTime. | 12 The inventory of homes for sale at the end of a given month, divided by the average monthly pending sales from the last 12 months. Months Supply * Months Supply for all properties from December 2017 through November 2018. This is not the average of the individual figures above. 4.1 3.5 3.4 2016 2017 2018 November 3.0 4.0 5.0 6.0 7.0 1-2013 1-2014 1-2015 1-2016 1-2017 1-2018 - 14.6% - 2.9%- 18.0%