ASEA Research Summary Presentation 2012

http://www.RedoxSignalingMolecules.ca - Frequently Asked Questions (And Answers) 1. What is ASEA? ASEA is an immune boosting molecular complex consisting of reactive molecules, all native to the human body and naturally balanced. These molecules include a perfect balance of antioxidant enhancers that are balanced to support the immune system, detoxify the body and protect and fortify healthy tissue. 2. What Are Reactive Molecules? Reactive molecules are either active electron acceptors (prone to take on electrons) or electron donors (prone to give up electrons). When these two classes of molecules are chemically balanced in our body, our immune systems can function at its optimal level. 3. How Do These Reactive Molecules Work? There are two major roles for these reactive molecules in the body. First, they pair up with the natural antioxidants already in our body to help detoxify and fortify healthy tissue. Secondly, they supply the raw materials that the immune system needs in order to perform its natural function to detect and destroy harmful invaders and damaged cells. 4. How Much ASEA Should I Take? ASEA has been proven to be entirely non-toxic at any reasonable dose. It can be taken orally, applied topically or inhaled without causing irritation. The recommended maintenance amount is 4 oz. per day for adults. ASEA is not recommended for pregnant or breastfeeding women. Consult with a physician if you are sensitive to salt intake. 5. Can I Apply ASEA To My Skin, Scrapes, Cuts, Or Burns? ASEA is a natural disinfectant and antimicrobial and yet is soothing to the touch. ASEA can be used in a spray bottle for use on scrapes, burns and abrasions and can be liberally sprayed on the skin and will not cause irritation. ASEA contains a very small amount of chlorine. If you are allergic to chlorine, it is not recommended for use on the face. As always, consult a physician if there are any concerns. 6. Is ASEA Safe? Testing has shown ASEA to be entirely safe and non-toxic no matter how it is consumed or applied. It has shown literally zero endotoxicity, cytotoxicity, and genotoxicity (mutagenic properties) in all 16 years of studies that were performed. Consult with a physician if you are sensitive to salt intake. To order or join ASEA, Visit: http://www.RedoxSignalingMolecules.ca or Call 1-416-335-4716

Recomendados
Más contenido relacionado
La actualidad más candente
La actualidad más candente (19)
Similar a ASEA Research Summary Presentation 2012
Similar a ASEA Research Summary Presentation 2012 (6)
Último
Último (20)
ASEA Research Summary Presentation 2012
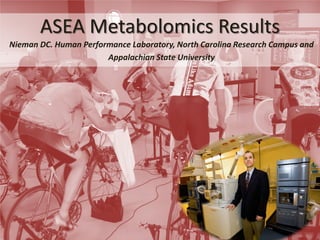
- 1. ASEA Metabolomics Results Nieman DC. Human Performance Laboratory, North Carolina Research Campus and Appalachian State University
- 2. Metabolomics Laboratory, North Carolina Research Campus, David H. Murdock Research Institute Appalachian state Slide 1 Human Performance Laboratory
- 3. Blood/urine : Pre-Ex Post- Ex 1-h Blood/urine : Pre-Ex Post- Ex 1-h Crossover 1-week • 75-km 1-week • 75-km 3-week washout BASELINE TESTING for ASEA cycling cycling ASEA VO2max, body 1 week • 75-km composition (N=20 1-week • 75-km Placebo cycling Placebo cycling subjects) Metabolomics: Goal is to measure the influence of ASEA on small molecules (metabolites) that shift in response to supplementation. The shift in metabolites, depending on the nutritional product, may represent effects on inflammation, oxidative stress, and physiologic stress. Appalachian state Slide 2 Human Performance Laboratory
- 4. Working Summary • Seven days ingestion of ASEA (relative to placebo) caused an extensive mobilization of free fatty acids from adipose tissue in male cyclists. • Athletes on ASEA for 7-days started the 75-km cycling trial with high blood free fatty acids leading to increased fat oxidation and a sparing of amino acids (and potentially muscle glycogen). • ASEA intake was associated with a large increase in serum ascorbic acid levels (probably from the adrenal cortex). • Serum creatinine and urea also increased post- exercise. Appalachian state Slide 3 Human Performance Laboratory
- 5. Myristic acid Finding 1: Ingestion of ASEA beverage for one 14C Saturated Fatty Acid week strongly increased serum fatty acids FDR=6.49E-32 Least Square Mean Area levels (most likely from adipose tissue). 2,000 1,500 1) Chronic Effect: Higher fatty acid levels pre- 1,000 exercise (several types of fatty acids --- see slides). 500 - ASEA Placebo 2) Acute Effect: Increased fatty acid oxidation Myristic acid 14C Saturated Fatty Acid and mobilization during exercise (placebo Least Square Mean Area FDR=2.61E-20 condition was linked to a late mobilization). 2,000 1,500 1,000 500 - Triglyceride Mobilization: corresponding Pre Post 1H Post with the increase in free fatty acids, glycerol ASEA Placebo was higher at baseline (indicative of extensive adipose triglyceride hydrolysis). TG Hydrolysis FFAs + Glycerol with ASEA Appalachian state Slide 4 Human Performance Laboratory
- 6. Post 7-day Ingestion: Fatty Acids Higher in ASEA vs. Placebo Myristic acid Palmitic Acid 14C Saturated Fatty Acid 16C Saturated Fatty Acid FDR=6.49E-32 FDR=1.86E-25 Least Square Mean Area 2,000 25,000 Least Square Mean Area 1,800 1,600 20,000 1,400 1,200 15,000 1,000 800 10,000 600 400 5,000 200 - - ASEA Placebo ASEA Placebo Oleic Acid Stearic Acid 18C Monounsaturated n9 Fatty Acid 18C Saturated Fatty Acid FDR=5.21E-18 FDR=3.22E-12 8000 18000 7000 Least Square Mean Area 16000 6000 14000 12000 5000 10000 4000 8000 3000 6000 2000 4000 2000 1000 0 0 ASEA Placebo ASEA Placebo Appalachian state Slide 5 Human Performance Laboratory
- 7. 7-days Ingestion of ASEA Fatty Acids and Glycerol Backbone: Higher in ASEA vs. Placebo Palmitelaidic Acid Capric Acid 16C Trans Fatty Acid 10C Saturated Fatty Acid FDR=1.13E-08 FDR=5.39E-07 1,200 160 Least Square Mean Area 1,000 140 120 800 100 600 80 400 60 40 200 20 - 0 ASEA Placebo ASEA Placebo Glycerol Backbone of Triglycerides FDR=9.49E-07 25000 20000 15000 10000 5000 0 ASEA Placebo Appalachian state Slide 6 Human Performance Laboratory
- 8. Serum Fatty Acids During Exercise Myristic acid Palmitic Acid 14C Saturated Fatty Acid 16C Saturated Fatty Acid Least Square Mean Area FDR=2.61E-20 FDR=1.56E-20 Least Square Mean Area 2,000 25,000 1,500 20,000 15,000 1,000 10,000 500 5,000 - - Pre Post 1H Post Pre Post 1H Post ASEA Placebo ASEA Placebo Palmitelaidic Acid Oleic Acid 16C Trans Fatty Acid 18C Monunsaturated n9 Fatty Acid Least Square Mean Area Least Square Mean Area FDR=1.66E-16 FDR = 7.96E-10 1,200 20,000 1,000 15,000 800 600 10,000 400 5,000 200 - - Pre Post 1H Post Pre Post 1H Post ASEA Placebo ASEA Placebo Appalachian state Slide 7 Human Performance Laboratory
- 9. Serum Fatty Acids During Exercise Stearic Acid Capric Acid 18C Saturated Fatty Acids 10C Saturated Fatty Acids FDR=1.33E-06 FDR=0.0059 Least Square Mean Area Least Square Mean Area 12,000 200 10,000 150 8,000 6,000 100 4,000 50 2,000 - - Pre Post 1H Post Pre Post 1H Post ASEA Placebo ASEA Placebo Lauric Acid Glyercol Monosterate 12C Saturated Fatty Acids FDR = 0.0060 FDR=0.0281 Least Square Mean Area 900 Least Square Mean Area 1,200 800 1,000 700 600 800 500 600 400 400 300 200 200 100 - - Pre Post 1H Post Pre Post 1H Post ASEA Placebo ASEA Placebo Appalachian state Slide 8 Human Performance Laboratory
- 10. Serum Aspartate Serum Serine Serum Glycine FDR=0.0075 FDR=0.0273 FDR=0.0162 Pyruvate Pre Post 1H Post Pre Post 1H Post Pre Post 1H Post In urea cycle Acetyl Co-A Serum Citrate Serum Fumarate FDR = 0.0037 FDR=1.06E-06 Oxaloacetate Citrate Pre Post 1H Post Pre Post 1H Post Serum Threonine FDR=0.0108 Serum Malate Malate Isocitrate FDR= 0.0004 Graph Key Pre Post 1H Post ASEA Placebo Pre Post 1H Post Via Beta Oxidation alpha- Fumarate Ketoglutarate Serum Leucine FDR=0.0004 Succinate Succinyl CoA Pre Post 1H Post Finding 2: High levels of blood free fatty acids were Via Odd Chain Beta Oxidation Via Glutamate linked to a sparing of amino Serum Valine Serum Proline FDR=0.0089 acid catabolism, and FDR=0.0066 increased Krebs Cycle intermediates, post-exercise Pre Post 1H Post Pre Post 1H Post Appalachian state Slide 9 Human Performance Laboratory
- 11. Serum Amino Acids at Pre, Post, and 1H Post-Exercise “Sparing” of Amino Acids with ASEA Leucine Proline Krebs Entry: alpha Ketoglutarate Krebs Entry: alpha Ketoglutarate FDR =0.0004 FDR = 0.0066 30,000 50,000 Least Square Mean Area Lesat Square Mean Area 25,000 40,000 20,000 30,000 15,000 20,000 10,000 5,000 10,000 - - Pre Post 1H Post Pre Post 1H Post ASEA Placebo ASEA Placebo Aspartate Valine Krebs Entry: Oxaloacetate Krebs Entry: Succinyl CoA FDR = 0.0074 FDR = 0.0089 500 50,000 Lesat Square Mean Area Lesat Square Mean Area 400 40,000 300 30,000 200 20,000 100 10,000 - - Pre Post 1H Post Pre Post 1H Post ASEA Placebo ASEA Placebo Appalachian state Slide 10 Human Performance Laboratory
- 12. Serum Amino Acids at Pre, Post, and 1H Post-Exericse “Sparing” of Amino Acids with ASEA Threonine Serine Krebs Entry: Pyruvate Krebs Entry: Pyruvate FDR= 0.0108 FDR= 0.0273 7,000 12,000 Lesat Square Mean Area Lesat Square Mean Area 6,000 10,000 5,000 8,000 4,000 6,000 3,000 4,000 2,000 1,000 2,000 - - Pre Post 1H Post Pre Post 1H Post Glycine Krebs Entry: Pyruvate FDR= 0.0162 5 Lesat Square Mean Area 5 4 4 3 3 Graph Key 2 2 1 ASEA Placebo 1 - Pre Post 1H Post Appalachian state Slide 11 Human Performance Laboratory
- 13. Serum Krebs Intermediate at Pre, Post, and 1H Post-Exercise Higher Levels with ASEA Fumarate Malate FDR = 1.06E-06 FDR= 0.0004 600 200 Lesat Square Mean Area Lesat Square Mean Area 180 500 160 400 140 120 300 100 80 200 60 100 40 20 - - Pre Post 1H Post Pre Post 1H Post Citrate FDR = 0.0037 60.00 Least Squre Mean Area 50.00 40.00 30.00 20.00 Graph Key 10.00 ASEA Placebo - Pre Post 1H Post Appalachian state Slide 12 Human Performance Laboratory
- 14. 3) Ascorbic Acid Metabolism: ASEA supplementation appears to be affecting ascorbic acid both acutely and chronically. Chronic Differences: ASEA group has lower baseline levels of fructose and lower levels of threonic acid. Fructose is broken down into ascorbic acid which is further metabolized into threonic acid. This could be suggestive of higher ascorbic acid production but no differences in groups were detected at baseline. Fructose Threonic Acid FDR=1.12E-05 FDR=1.46E-98 Least Square Mean Least Square Mean 1500 8 6 1000 Area Area 4 500 2 0 0 ASEA Placebo ASEA Placebo Acute Differences: ASEA group has higher levels of ascorbic acid, an antioxidant, and lower levels of both fructose and threonic acid. Ascorbic Acid Fructose Threonic Acid FDR = 5.6E-06 FDR = 0.0002 FDR=0.0031 Least Square Mean Least Square Mean 1,500 1,500 10 Least Square Mean 8 1,000 1,000 Area Area 6 Area 500 500 4 2 - - Pre Post 1H Post Pre Post 1H Post - Pre Post 1H Post Graph Key Appalachian state Slide 13 ASEA Placebo Human Performance Laboratory
- 15. 4) Other Changes. Some other changes were found both acutely and chronically that require further investigation into implications. Aminomalonic Acid Serum Creatinine FDR = 1.13E-05 FDR=2.55 E-06 Least Square Mean Area 400 900 Least Squre Mean Area 350 800 300 700 250 600 500 200 400 150 300 100 200 50 100 - - Pre Post 1H Post Pre Post 1H Post Plays role in binding calcium to protein Breakdown product of creatine Urea FDR = 0.0108 Least Square Mean Area 120 100 80 60 40 20 Graph Key - Pre Post 1H Post ASEA Placebo Formed in liver; Removal of nitrogen and ammonia Appalachian state Slide 14 Human Performance Laboratory
- 16. Blood Urinary Nitrogen (BUN) Normal Range: 8-20 mg/dl 25 20 15 mg/dl Placebo 10 ASEA 5 0 Pre Post 1H BUN levels did not differ between treatment (treatment x time p-value=0.9743) Appalachian state Slide 15 Human Performance Laboratory
- 17. Creatinine Normal Range: 0.7-1.2 mg/dl 1.4 1.2 1 0.8 mg/dl Placebo 0.6 ASEA 0.4 0.2 0 Pre Post 1H Creatinine levels did not differ between treatment (treatment x time p-value=0.7717) Appalachian state Slide 16 Human Performance Laboratory
- 18. Bilirubin Normal Range: 0.3-1.2 mg/dl 1 0.8 0.6 mg/dl Placebo 0.4 ASEA 0.2 0 Pre Post 1H Bilirubin levels did not differ between treatment (treatment x time p-value=0.9971) Appalachian state Slide 17 Human Performance Laboratory
- 19. Alkaline Phosphatase Normal Range: 39-117 IU/L 68 66 64 IU/L 62 Placebo 60 ASEA 58 56 Pre Post 1H Alkaline Phosphatase levels did not differ between treatment (treatment x time p-value=0.8819) Appalachian state Slide 18 Human Performance Laboratory
- 20. AST Normal Range: 15-41 IU/L 40 35 30 25 IU/L 20 Placebo 15 ASEA 10 5 0 Pre Post 1H AST levels did not differ between treatment (treatment x time p-value=0.9546) Appalachian state Slide 19 Human Performance Laboratory
- 21. ALT Normal Range: 17-63 IU/L 40 35 30 25 IU/L 20 Placebo 15 ASEA 10 5 0 Pre Post 1H ALT levels did not differ between treatment (treatment x time p-value=0.9739) Appalachian state Slide 20 Human Performance Laboratory