SlideShare una empresa de Scribd logo
1 de 42
Descargar para leer sin conexión
MODERN CONCEPTS OF AGRICULTURE

                                 Sustainable Agriculture

                                          A. Subba Rao
                                             Director
                                 Indian Institute of Soil Science
                                    Nabibagh, Berasia Road,
                                        Bhopal- 462 038

                                          K.G. Mandal
                                 Indian Institute of Soil Science
                                    Nabibagh, Berasia Road,
                                        Bhopal- 462 038


                                        (11-12- 2007)

CONTENTS
Definition
Concepts
Needs
Indicators of Sustainability
Ecological basis of Sustainability/Resource Management
Profile of Indian Agriculture in relation to Sustainability
Maintenance of Production base in Irrigated Agriculture
Modernization of Agriculture and its relation with Sustainability
Basic Ecological Principles of LEISA
Some Promising LEISA Techniques and Practices
Mulching
Wind breaks
Water Harvesting
Strip Cropping
Intercropping Trap and Decoy Crops
Bio-intensive Gardening
Contour Farming
Integrated Crop-Livestock-Fish Farming
Evaluation of Constraints
Optimization of Farming Systems

Keywords
Carrying capacity, integrated farming


                                              1
Agriculture is a key primary industry in India that makes a significant contribution to the
wealth and quality of life for rural and urban communities in India.

Definition
Enshrined in the title of this chapter are two key words- ‘sustainable’ and ‘agriculture’. The
word ‘sustain’, from the Latin sustinere (sus-, from below and tenere, to hold), to keep in
existence or maintain, implies long-term support or permanence. The word ‘sustainability’
was used for the second time in 1712 by the German forester and mining scientist Hans Carl
von Carlowitz in his book ‘Sylvicultura Oeconomica’. French and English scientists adopted
the concept of planting trees and used the term ‘sustained yield forestry’ by Kara Taylor (ref.,
http://www.answers.com/topic/ sustainability). Sustainability is an attempt to provide the best
outcomes for the human and natural environments both for the present and future. It relates to
the continuity of institutional, environmental, social and economic aspects of human society,
as well as the non-human environment.

In agricultural parlance, sustainability means keep the crop productivity going without
enhancing input levels. There are many definitions of sustainable agriculture. Simply stated,
sustainable agriculture is a form of agriculture aimed at meeting the needs of the present
generation without endangering the resource base of the future generations. Thus, a holistic
and systems approach is essential for achieving sustainability. Sustainable agricultural
systems are capable of maintaining their productivity and usefulness to society indefinitely.
Such systems must be resource-conserving, socially supportive, commercially competitive,
and environmentally sound.

Concepts
A group of Canadian scientists (MacRae et al., 1990) defined sustainable agriculture as:
sustainable agriculture is a philosophy and system of farming. It has its roots in a set of
values that reflect an awareness of both ecological and social realities. It involves design and
management procedures that work with natural processes to conserve all resources, promote
agroecosystem resilience and self regulation, minimize waste and environmental damage,
while maintaining or improving farm productivity and profitability.

The concept set out by the Technical Advisory Committee (TAC) of the Consultative Group
on International Agricultural Research (CGIAR) states “Sustainable agriculture is the
successful management of resources for agriculture to satisfy the changing human needs,
while maintaining or enhancing the quality of environment, and conserving natural
resources”.

The United States Department of Agriculture defined ‘Sustainable agriculture’ as a
management system for renewable natural resources that provides food, income and
livelihood for present and future economic productivity and ecosystem services of these
resources.

Sustainable agriculture systems are those that are economically viable and meet society’s
need for safe and nutritious food while maintaining or enhancing natural resources and the
quality of the environment for future generations (Baier, 1990).

Hallmark of these definitions is the harmony in maintaining buoyancy and dynamism in
agricultural growth for meeting basic human needs and protection and conservation of natural
resources.


                                               2
Needs
Sustainable agriculture systems are designed to use existing soil nutrient and water cycles,
naturally occurring energy flows for food production. As well, such systems aim to produce
food that is both nutritious and without products that might harm human health. In practice,
such systems have tended to avoid the use of synthetically compounded fertilizers, pesticides,
growth regulators, and livestock feed additives, instead relying upon crop rotations, crop
residues, animal manures, legumes, green manures, off-farm organic wastes, appropriate
mechanical cultivation, and mineral bearing rocks to maintain soil fertility and productivity.

The need of sustainable agriculture owes its origin to the philosophy of ‘holism’, which
enunciates that all things are connected and their interactions in nature are complex. Stimulus
to one component creates response to that as well as the system as a whole also responds.
Appreciation of the theory of holism is very much embedded in our sayings and scriptures.
An ancient Tamil proverb goes as follows, “No fodder, no cattle; no cattle, no manure; no
manure, no crop”. Translation of a Sanskrit text from about 1500 BC reads as “Upon this
handful of soil our survival depends. Husband it and it will grow our food, our fuel, and our
shelter and surround us with bounty. Abuse it and the soil will collapse and die, taking man
with it”. Deep in the heart of these primeval quotes lies the concern on the health of the very
basic elements that contribute to the sustenance of complete chain involving production to
consumption. For instance, if the vitality of natural resources is impaired because of neglect
or misuse, agricultural sustainability and environmental quality and the linkage among these
in the quest for human survival becomes at stake (Katyal).

Indicators of Sustainability
Indicators are a composite set of attributes or measures that embody a particular aspect of
agriculture. Indicators are quantified information, which help to explain how things are
changing over time. Sustainability indicators look at economic, social and environmental
information in an integrated manner.

Many professionals agree that at least three criteria should guide the development of
sustainability indicators (Jeff Tschirley):

   (i) Policy relevance - indicators should address the issues of primary concern to a
       country or district and receive the highest priority. In some cases policy makers may
       already share concern about an aspect of sustainability (e.g. land degradation) and be
       ready to use indicator information for addressing the issue.
   (ii) Predictability - to allow a forward-looking perspective that can promote planning
        and decisions on issues before they become too severe. Anticipatory decision-making
        is at least as important to sustainable agriculture as is recognition of existing
        problems.
  (iii) Measurability - to allow planners and analysts the means to assess how the indicator
        was derived, either qualitatively or quantitatively, and decide how it can best be
        applied in the planning and decision-making process.


Some of the indicators of key natural resources in rainfed cropping systems are listed below.


                                              3
Table 1: Indicators of Key Natural Resources in Rainfed Cropping Systems

S.     Indicators                Key Management Aspects
No.
1      Nutrient Balance          Organic matter - rate of change
                                 Nitrogen cycling - especially when using grain legumes in
                                      rotation with cereals
                                 Monitoring status of phosphorus, sulphur and potassium
                                 Micro-nutrients
2      Erosion                   Vegetation cover - includes trees as well as stubble
                                 Soil surface cover - stubble retained (30% sufficient to prevent
                                       wind and water erosion)
                                 Stream bank
                                 Sheet and gully erosion
3      Productivity, Yield and   Water use efficiency - i.e. actual versus potential (in some
       Quality                   areas the potential is much less than the actual) (biomass/grain
                                 yield/net return), recharge (dryland salinity and nutrient
                                 leaching)
                                 Pasture composition - legume and perennial
                                 Matched animal versus pasture production - appropriate
                                 enterprise selection/capability
                                 Maintenance of genetic base/improvement

4      Soil Structure            Infiltration
                                 Permeability/water storage
                                 Stability
                                 Waterlogging
                                 Compaction

5      pH                        Change
                                 Toxicity - deficiency
                                 Indicator plants
6      Energy Efficiency         Energy input vis-à-vis energy output of the whole agricultural
                                 system

7      Biological Factors        Soil macro/micro flora and fauna
                                 Animal health
                                 Plant health (root growth and other)
                                 Pests (animals and plants)
8      Farm Management Skills    Understanding - a good indicator would be the understanding
                                 of the farmers of their own technical system
9      Rainfall/Precipitation    Performance of rainfall in a year as % of normal & its
                                 coefficient of variation;
                                 Distribution of area based on rainfall amount (dry: 0-750 mm,
                                 medium: 750-1150 & 1150-2000 mm, assured: > 2000 mm);
                                 Categorization of the amount of rainfall (excess: +20% or
                                 more, normal: +19% to -19%, deficient:20% to -59%, scanty:
                                 -60% or less);
                                 Number of districts having mean annual rainfall of 750-1250
                                 mm and moisture availability period for at least 150 days;
                                 Area affected due to drought (slight, moderate or calamitous)


                                             4
The most widely accepted framework for sustainability is referred to as
Pressure/State/Response (PSR framework), as described in the Table 2, and in the following
flow diagram.

                             Table 2: Example of PSR Framework

 Issue                 Pressure (driving       State (resulting         Response (mitigating
                       force)                  condition)               action)
 Soil erosion          Hillside farming        Declining yield          Terracing,
                                                                        perennial cropping
 Water quality         Agro-industrial         Fish die-off             Water treatment,
                       processing                                       technology adjustment
 Condition             Livestock grazing       Soil erosion             Stock rotation, de-
 of grassland                                                           stocking revegetation


                Pressure                                               State
          Human activities                                          Resulting
           affecting the                                          condition, e.g.,
            system, e.g.,                                         Soil erosion &
          Hillside farming                                        declining yield


                                      Response
                                       Mitigating
                                       action, e.g.,
                                     terracing, strip
                                        cropping


                    Fig. 1: The PSR framework for Sustainability Indicators
                        (Source: FAO Research Extension and Training)

Pressure refers to the driving forces that create environmental impacts. They could include hillside
farming, agro-industrial processing, livestock grazing, deforestation, etc.
State refers to the condition(s) that prevail when a pressure exists. This could be for example
declining yields, fish die-off or soil erosion, etc.
Response refers to the mitigation action(s) and levers that could be applied to reduce or eliminate the
impacts.


                                                  5
Ecological basis of Sustainability/ Resource Management
The ecosystem provides services such as clean water, climate regulation and nutrient
recycling, which make it possible for us to thrive. These ecosystem services are also the basis
for agricultural production, which needs to continually increase, in order to feed the
expanding global population. However, agriculture as practiced today also has negative
impacts on the ecosystems. In the longer term, these negative impacts will reduce the
efficiency of the ecosystem services that are needed to sustain agricultural production. This
creates a fundamental conflict, and many farmers are already experiencing reduced yields as
a result of declining soil fertility, increasing temperatures and less rainfall. Resolving the
conflict between increasing agricultural production and maintaining biodiversity and
ecosystem services is an enormous challenge (Meyer and Heffman, 1993).

A farm can also be a complex, interwoven mesh of soils, plants, animals, implements, people
and other inputs, operating within a specific environmental and social context. On such
farms, the farmer, with the intimate knowledge of local conditions, plants and animals, tries
to enhance the natural ecological processes and to manage the whole farm to provide a wide
range of produce. Agroecology sees a farm as a complex system in which natural ecological
processes are always at work. These processes involve the breakdown of organic matter,
nutrient cycling, interactions between pests and beneficial insects, competition between
different plant and/ or animal communities, symbiosis between fungi or bacteria and plants
and successional changes (Gold, 1999).

By combining farmers’ traditional knowledge with recent experiences of ecologically-sound
agriculture and new approaches in agricultural sciences, it is possible to develop ecologically-
sound agricultural systems which combine high and sustained production with maintenance
of the environment and its ecosystem services.

Ecological basis: The design of ecologically-sound, sustainable agricultural system is based
on the application of ecological principles such as (LEISA, 2006):

   (i)   Securing favourable soil conditions for plant growth by enhancing biological soil
         life through the management of soil, vegetation and organic matter;
  (ii)   Optimizing the recycling of nutrients within the farm system and balancing nutrient
         availability and flows through the management of vegetation, animals and organic
         matter;
 (iii)   Making optimal use of the biological and genetic potential of plant and animal
         species;
  (iv)   Enhancing beneficial biological interactions and synergisms through the use of
         biodiversity and genetic resources by combining integrated systems with a high
         degree of functional diversity;
  (v)    Minimizing losses from pests and diseases by enhancing the health and the self-
         regulating capacity of the farm system; and
  (vi)   Maximizing the uptake of solar energy and minimizing the loss of water through
         management of microclimate, vegetation and water retention.

These principles reflect the functions of natural ecosystems and can be used to provide
general guidance for developing ecological farming systems. Each principle can be applied
through a range of different techniques and strategies. Each of these techniques will have
different effects on productivity, stability and resilience within the farm system and will have
to be adapted to the specific circumstances of each farm as local opportunities and resource


                                               6
constraints differ from place to place. In this way biological efficiency can be optimized, the
agro ecosystem remains productive and its self-sustaining capacity can be enhanced.

Profile of Indian Agriculture in relation to Sustainability
India occupies a strategic position in Asia, looking across the seas to Arabia and Africa on
the west and to Burma, Malaysia and the Indonesian Archipelago on the east. Geographically,
the Himalayan ranges keep India apart from the rest of Asia. A profile is listed in the
following table.

                                  Table 3: A Profile of India

 S.    Profile          Description of Profile characteristics
 No.   Parameter
 1     Location         Latitude 80 4' - 370 6' N, longitude 680 7' - 970 25' E. Southwest-Arabian Sea,
                        southeast- the Bay of Bengal, north, northeast & northwest- the Himalayan
                        ranges, southern tip of the Indian peninsula- Kanyakumari, south- the Indian
                        Ocean. Andaman and Nicobar islands in the Bay of Bengal and
                        Lakshadweep in the Arabian Sea are parts of India.
 2     Area             Total land area 3,287,263 sq km.
 3     Extent           North to south-3214 km, east to west- 2933 km, land frontier-15,200 km,
                        coastline- 7516.5 km
 4     Population       1081.23 million
 4     Climate          Mainly tropical or subtropical
 5     Physiographic    The mainland comprises 7 regions. Northern Mountains including the
       regions          Himalayas and the North Eastern mountain ranges, The Indo Gangetic plain,
                        The Desert, Central highlands and Peninsular plateau, East Coast, West
                        Coast, Bordering seas and islands

 6     Mountain         The Himalayas, the Patkai and other ranges bordering India in the north and
       ranges           north east, the Vindhyas, which separate the Indo Gangetic plain from the
                        Deccan Plateau, the Satpura, the Aravalli, the Sahyadri, which covers the
                        eastern fringe of the West Coast plains and the Eastern Ghats, irregularly
                        scattered on the East Coast and forming the boundary of the East Coast
                        plains.
 7     Desert           The Desert region- the great desert and the little desert. The great desert
                        extends from the edge of the Rann of Kachchh beyond the Rajasthan-Sind
                        Frontier runs through this. The little desert extends from the Luni between
                        Jaisalmer and Jodhpur up to northern west.
 8     Watersheds       There are mainly three water-sheds. Himalayan range with its Karakoram
                        branch in the north, Vindhyan and Satpura ranges in Central India, and
                        Sahyadri or Western ghats on the West Coast.
 9     Flora and        45,000 plant sp. 33% of which are native; 15,000 flowering plant sp,
       fauna            accounting to 6% of the world's total flora. Out of these, about 3,000 to
                        4,000 are believed to be in danger of extinction. The fauna of India 5,000
                        species of larger animals.
 10    Rivers           Three groups: the great Himalayan rivers of the north (the Indus, the Ganga
                        and the Brahmaputra), the westward-flowing rivers (the Narmada and
                        Tapti), and the eastward-flowing rivers of the Deccan Plateau and the rest of
                        peninsular India (Godavari, Krishna, Cauvery, Pennar, Mahanadi, Damodar,
                        Sharavati, Netravati, Bharatapuzha, Periyar, Pamba).
                    (Source: http://www.southasianmedia.net/profile/india)


                                                 7
India's Natural Resources and Sustainability of Agriculture: Land, climate, and bio-
inhabitants (human, animal and plant) constitute the natural wealth of any country. Land, the
primary natural resource, includes soil, water bodies, vegetation, landscape and microclimate.
India's geographical area is 328.73 million ha with a reporting area (for land utilization
statistics) of 305.84 million ha (Table 4).

                      Table 4: Land Utilization Pattern in India (2003-04)

  S.      Land Use Pattern                                                                              Area
  No.                                                                                            (million ha)
   1      Geographical area                                                                           328.73
   2      Reporting area for land utilization statistics                                              305.84
   3      Classification of reporting area excluding fallow land- not available for
          cultivation
          a) Forests                                                                                    69.70
          b) Area put to non-agricultural uses                                                          24.48
          c) Barren & unculturable land                                                                 17.73
          d) Total (= b+c)                                                                              42.22
   4      Classification of reporting area excluding fallow land- other uncultivated land
          a) Permanent pastures and other grazing lands                                                 10.45
          b) Land under misc. tree crops & groves not included in net area sown                          3.37
          c) Culturable waste land                                                                      13.17
          d) Total (= a+b+c)                                                                            26.99
   5      Fallow land
          a) Fallow lands other than current fallows                                                    11.24
          b) Current fallows                                                                            14.80
          c) Total (= a+b)                                                                             26.04
    6     Net area sown                                                                               140.88
    7     Area sown more than once                                                                     49.76
    8     Total (gross) cropped area                                                                  190.64
    9     Gross area irrigated                                                                         76.82
   10     Net area irrigated                                                                           55.10
   11     Area irrigated more than once (= 9-10)                                                       21.71
   12     Gross area under HYVs**                                                                      78.35
   13     Share of gross irrigated to gross sown area (%) (= 9/8 x 100)                                40.30
   14     Cropping intensity (%) (= gross/net sown area x 100)                                        135.32
** Data pertain to total area covered under HYVs of wheat, maize, bajra, jowar and paddy in the year 1998-99
                              (Source: Fertiliser Statistics (2005-06))

On the basis of sustainability issues, the reporting area may be classified into 3 broad sectors
as follows (Table 5):
                                   Table 5: Reporting Area

  S.      Broad sectors                  Land use characteristics                                     Area
  No.                                                                                          (million ha)
   1      Agricultural sector            Net area (cultivated) sown, current fallows,               180.09
                                         other fallows and culturable waste lands
   2      Ecological sector              Forests, miscellaneous tree crops and groves,               101.25
                                         pasture and grazing, barren and unculturable
                                         lands
   3      Non-agricultural sector        Area put to non-agricultural uses                            24.48


                                                       8
Among these uses, the net sown area of about 141 million ha has remained almost constant
over the last 35 years. Similarly, area under forests (not necessarily the forested area) is
inflexible since 1972. On an overall basis, during the last three decades area under ecological
sector has decreased significantly. Thus, agricultural area is non-expanding and at the same
time there is shrinkage of area under ecological sector. There is unabated rise in area under
non-agricultural sector also. The availability of land per capita is also decreased sharply from
0.48 ha in 1951 to 0.20 ha in 1981 and further decreased to 0.15 ha in 2000. Ideally, the
policy aim of any Government should be to guide the land use pattern in such a way that it
underpins the principle ‘Future life rests on meeting basic human needs without destroying
these resources on which all life rests’.

India shares only 2.4% of the world's geographical area, but supports around 16.7% of the
world's population and over 17.2% of the world's livestock. Thus, there is immense pressure
on India's land resources. The resultant overstraining of land resources by unproportional
human and animal population is the cause of widespread land degradation and threat to
sustainability of agro-ecosystem.

Carrying Capacity: Carrying capacity is the number of individuals that can be supported in
a given area, or the maximum population that can be sustained in a habitat without the
degradation of the life support system

Carrying capacity is the theoretical equilibrium population size at which a particular
population in a particular environment will stabilize when its supply of resources remains
constant. It can also be considered to be the maximum sustainable population size; the
maximum size that can be supported indefinitely into the future without degrading the
environment for future generations (Gold, 1999).

The Earth's capacity to support people is determined both by natural constraints and by
human choices concerning economics, environment, culture (including values and politics)
and demography. Simple mathematical models of the relations between human population
growth and human carrying capacity can account for faster-than-exponential population
growth followed by a slowing population growth rate, as observed in recent human history.
The distribution of operational holdings indicates that the number of holdings occupied by
the marginal and small farmers is about 80% of the total holdings (Table 6), the number of
holdings decreased towards greater size farms.

            Table 6: Distribution of Operational Holdings in India (1995-96)

   Category of holdings         Number of           Area operated by Average size of
                                operational           each category       operational
                                  holdings             (million ha)      holdings (ha)
                                  (million)
   Marginal (< 1 ha)                71.18 (61.6)           28.12 (17.2)            0.40
   Small (1-2 ha)                   21.64 (18.7)           30.72 (18.8)            1.42
   Semi-medium (2-4 ha)             14.26 (12.3)          38.95 (23.8)             2.73
   Medium (4-10 ha)                   7.09 (6.1)          41.39 (25.3)             5.84
   Large (>10 ha)                     1.40 (1.2)           24.16 (14.8)           17.21
   All holdings                  115.58 (100.0)         163.36 (100.0)             1.41
   Figures in parentheses indicate the percentage of respective column totals
              (Source: Agricultural Statistics at a Glance (2004))


                                               9
Land degradation: Degradation refers to reduced productivity of soils (and vegetation)
compared to that what is attainable at a fixed level of non-land inputs. Land degradation is a
principal factor inhibiting productivity and endangering sustainability of an agricultural
system. Soil erosion is its principal puporter and soil cover viz., vegetation provides the
shield.

Current estimates on land degradation show that about 173.64 million ha (53% of the total
geographical area) suffers from soil erosion, water logging, and other special problems for
cultivation (Table 7). There is hardly any doubt on the massiveness of land degradation due
to collective passivity of various public institutions on the one hand and splinter group
activity by individual farmers on the other.
            Table 7: Distribution of estimated area under different soil erosion,
            land degradation and land utilization problems (estimated)*

        S.      Categories of different problems                                     Area
        No.                                                                        (million ha)
         1     Geographical area                                                         328.73
         2     Area subject to water and wind erosion                                    144.12
         3     Area degraded through special problems                                     29.52
               3.1 Water logged area                                                       8.53
               3.2 Alkali soils                                                            3.88
               3.3 Acid soils                                                              4.50
               3.4 Saline soils including coastal sandy areas                              5.50
               3.5 Ravines and gullies                                                     3.97
               3.6 Area subject to shifting cultivation                                    4.91
               3.7 Riverine and torrents                                                   2.73
               Total (3.1 to 3.7)                                                         34.02
          4    Total problem area (2+3)                                                  173.64
          5    Total flood prone area                                                     40.00
               Annual average area affected by floods                                      8.00
               Annual average cropped area affected by floods                              3.70
               Maximum area affected in the worst year                                    18.60
          6    Total drought prone area                                                  260.00
           *Data pertain to land utilization statistics of 1981-82 and report till 1996-97
                       (Source: Fertilizer Statistics (2005-06))

Some of the impacts of land degradation are listed below:
 i.   Declining yields
 ii.  Need to use higher levels of inputs
 iii. Changes in land use pattern
 iv.  Off-site effects (pollution of ground water, siltation of reservoirs)
 v.   Loss of biodiversity
 vi.  Environmental effects (loss of habitat due to devegetation)
 vii. Property damage

Declining yield of crops is basically due to the decline in land quality on-site where
degradation occurs, for example erosion and off-site where sediments are deposited.
However, the on-site impacts of land degradation on productivity are easily masked due to
use of additional inputs and adoption of improved technology.

Nutrient depletion as a form of land degradation has a severe economic impact. There is
invariably need to use higher inputs like fertilizers, because of land degradation, there is a


                                                   10
decline in soil structure leading to crusting, compaction, erosion, desertification, creation of
anaerobic condition due to water logging, environmental pollution, and unsustainable use of
natural resources. In addition, the chemical degradation processes in soil leads to
acidification, leaching, salinization, decrease in cation exchange capacity, and declining soil
fertility. Even crop productivity of irrigated lands is severely threatened by build up of salt in
the root zone.

Impact of land degradation is remarkable because, in many severely degraded areas,
biological processes are deteriorated. There is reduction in total and soil microbial biomass
carbon, and eventual loss of biodiversity. This has important concerns related to
eutrophication of surface water, contamination of groundwater, and emissions of CO2, CH4,
N2O, from terrestrial as well as aquatic ecosystems. Severe land degradation affects a
significant portion of the earth's arable lands, decreasing the wealth and economic
development of nations. The economic impact of land degradation is severe in densely
populated South Asia, and sub-Saharan Africa.

The effects of land degradation have more significant impacts on receiving water courses
(rivers, wetlands and lakes) since soil, along with nutrients and contaminants associated with
soil, are delivered in large quantities to environments that respond detrimentally to their
input. Land degradation therefore has potentially disastrous impacts on lakes and reservoirs
that are designed to alleviate flooding, provide irrigation, and generate hydro-power.

Degradation is also considered responsible for a change in the ground cover to less palatable
species, or a change from predominantly perennial grasses to predominantly annual grasses.
Environmental dilapidation is brought about by pollution especially in urban areas, which not
only experience a rapid growth of population due to high fertility rates, low mortality and
increasing rural to urban migration, but also due to the industrialization.

Water resources: The sustainability in agriculture i.e., for crops/ cropping systems is
primarily depends upon the availability of water in its optimum quantity and acceptable
quality. Rainwater is the primary source to meet the demand of water. From rainfall, India
annually receives a rainfall of 1085 mm (long-term average from 1950-1994). This rainfall is
equivalent to roughly about 400 M hectare meter water (4000 billion cubic meters; one
hectare meter of water weighs approximately 100 tonnes). Nearly three fourths (i.e., 799.6
mm) of the total rainfall received in India is through South-West monsoon activity (Table 8).
Not even 3% of the total precipitation is contributed by North-Eastern monsoon. The
remaining amount of rainfall comes via pre or post-monsoon activity.

     Table 8: Distribution of Annual Rainfall according to Seasons in India

 Rainfall                          Duration                Amount       % of annual
                                                           (mm)         Rainfall
 Pre-monsoon                       March-May               112.8        10.4
 South-West monsoon                June-September          799.6        73.7
 Post-monsoon                      October-December        144.3        13.3
 Winter or north-east monsoon      January-February        28.2         2.6
 Total                                                     1085*        100.0
             *Total annual rainfall = 1085 mm (long-term average, 1950 to 1994)


                                               11
Prevailing conditions and locational placement on or out of path of progressing monsoon play
a significant part in deciding the regional disparities observed in rainfall distribution and
availability. Employing average annual rainfall as the criteria, 30% of the area in the country
receives less than 750 mm, 42% of the area gets between 750 and 1150 mm, and 20% of the
India's earth has access to rainfall between 1150 and 2000 mm. It is only 8% of the land area,
which secures more than 2000 mm rainwater annually. Thus 70% of the land area receives
rainfall greater than 750 mm (Table 9).

             Table 9: Distribution of Area according to Annual Rainfall in India

            Rainfall amount                                       Percentage of area
                                                                   receiving rainfall
                                                                       (approx.)
            Dry                      0-750 mm                              30
            Medium                   750-1150 mm                          42
                                     1150-2000 mm                         20
            Assured                  above 2000 mm                        8
            Total (1085 mm)                                              100
                      (Source: Fertiliser Statistics (2005-06))

The water resources potential of the country which occurs as natural run off from rainfall and
snow melt into rivers and streams is about 186.9 M ha m as per the estimates of Central
Water Commission (CWC), considering both surface and ground water as one system (Water
Related Statistics 2006, CWC). The Ganga-Brahmaputra-Meghna system is the major
contributor (59%) to total water resources potential of the country. Due to various constraints
of topography, uneven distribution of resource over space and time, it has been estimated that
only about 112.3 M ha m of total potential of 186.9 M ha m can be put to beneficial use, 69
M ha m being due to surface water resources and 43.3 M ha m due to ground water resources.
Again about 40% of utilizable surface water resources are presently in Ganga-Brahmaputra-
Meghna system. This 112.3 M ha m would be used for irrigation, domestic and industrial
purposes. Thus, practically the water available for irrigation to agricultural crops will be
inadequate. So enhancing the efficiency of water use is an important option; and if India has
to remain self-reliant in her food needs, there is no choice except to save every drop of water
and use it most prudently for sustainability in agriculture.

Rainfed Areas: At present, nearly 60% of the agriculture is rainfed, which contributes a
major portion of our food and supports a majority of the human population. About 30% of the
country spread over 99 districts is drought-prone (ref., J.C. Katyal). In these districts, not only
the agricultural sustainability is under threat because of critical water shortages, but also the
region as a whole suffers chronically from serious drinking water crisis. In fact, there is
uncertainty in rainwater availability, most of the years the onset, continuity, and withdrawal
of monsoon is erratic.

Any breakthrough in these drought-prone areas will primarily happen via rainwater
conservation, as it is the most important aspect of overall agricultural management. The main
objective should be to minimize runoff by encouraging its entry into the soil (in-situ water
conservation) and capturing the water, which cannot penetrate into the soil. Run-off,
amounting up to 40% of the total precipitation, is a typical feature of tropical monsoon,


                                                 12
which tends to unleash in big storms. Runoff, when not harvested promotes unsustainable
agriculture on two counts: (i) loss of precious rain water which otherwise could benefit
withering crops, and (ii) busting of nutrient rich topsoil caused by erosion. Estimates on
rainwater budgeting show that 24 m ha m equivalent runoff is available for harvesting in the
donor areas of field level catchments (nested or micro watersheds). Capturing the runoff
water and recycling it ensures stabilizing and sustaining the productivity of rainfed crops.

Demographic compulsions, increasing food, fuel and fodder needs and achievement in
agricultural productivity: Based upon the anticipated growth in population India's
population is likely to stand at around 1329 million by 2020. This will happen despite the fall
in annual compound growth rate from 2.14 in 1991 to 1.97 in 2001 (Fig. 1). Since the growth
in population is exponential in nature, India's population will continue to dilate by an
additional ~16 million people each year (ref., J.C. Katyal, data updated). Just to meet the
requirements on food for this population alone (leave aside seed and feed needs), India will
be required to produce additional 3.2 million t foods each year (1 t food is assumed to feed 5
persons for one year). In order to keep below the Malthusian cross (i.e. when population
growth rates exceed the rate of food supply increases) it will be necessary to achieve at least
2 t food grain productivity/ha from rainfed areas and 4 t/ha from irrigated areas. Current food
grain productivity of rainfed crops stands at less than about 1 t/ha and that of irrigated crops
at about 2 t /ha. Thus, the traditional agricultural systems though sustainable at low levels of
productivity, will not be able to measure up to the rates of growth that can neutralize the
needs of burgeoning population. A proper mix of technological interventions, inputs,
extension and infrastructure support will become increasingly important to ward off any food
deficiencies to arise.

                                              1100
                                              1000
                                                                Rural
                                               900
                                               800              Urban
                                               700              Total
                      Population in million


                                               600
                                               500
                                               400
                                               300
                                               200
                                               100
                                                 0
                                                     1901 1911 1921 1931 1941 1951 1961 1971 1981 1991 2001
                                                                          Census years
                                                         Fig. 2. Population in India
                                                      (Source: Fertiliser Statistics (2005-06),
                                                      Agricultural Statistics at a Glance (2004))


GDP in Agriculture & Allied Sectors: Though the absolute values in GDP in agricultural
and allied sectors are increasing (except in 2003-03, because of severe drought in 2002), the
rate of growth is not attractive. It is highly volatile. Low and volatile growth rates in Indian
agriculture and allied sectors are reflected in the average annual growth rate (Table 10). The
overall GDP was low during the period 2000-2003, again it has gained its momentum. With a
favourable monsoon, growth was an impressive 9.9 per cent in 2003-04. The contribution of
agricultural & allied sectors to total GDP is decreasing every year. Of course, this is because


                                                                          13
of the fact that the rate of growth in service and other sectors are significantly higher that the
rate of growth in agricultural sector.

Table 10: Gross Domestic Product (GDP) and contribution of agricultural and allied
sectors to total GDP in India
                                              GDP at current prices
 Year                Total     Overall    GDP in Agric.   GDP in Agric.   Contribution of
                     GDP       GDP        & allied        & allied        Agric & allied
                     (Rs       Growth     sectors         sectors         sectors to total GDP
                     crores)   Rate       (Rs crores)     growth rate     (%)
                               -                          -
 1993-94             781345               241967                          31.0
 1994-95             917058    17.4       278773          15.2            30.4
 1995-96             1073271   17.0       303102          8.7             28.2
 1996-97             1243547   15.9       362606          19.6            29.2
 1997-98             1390148   11.8       387008          6.7             27.8
 1998-99             1598127   15.0       442494          14.3            27.7
 1999-2000           1761838   10.2       461964          4.4             26.2
 2000-2001           1902998   8.0        468479          1.4             24.6
 2001-2002           2090957   9.9        521907          11.4            25.0
 2002-2003           2249493   7.6        509907          -2.3            22.7
 2003-2004           2523872   12.2       560482          9.9             22.2
 2004-2005P          2713162   7.5        616530          10.0            22.7
 2005-2006Q          2957347   9.0        653522          6.0             22.1
             A
 2006-2007           3229423   9.2        671167          2.7             20.8
 P               Q                A
     Provisional, Quick estimate, Advance estimate
                          (Source: Economic Survey (2006-07))


Agricultural Production: Indian agriculture has witnessed a phenomenal increase in the
agricultural production front. Compared to 50.83 million tonnes in 1950-51, India attained a
food grain production of 208.31 million tonnes during 2005-06 (Fig. 3). Measured by the
food grain availability criteria, per capita food availability has increased from 395 g/day in
1951 to 463 g/day in 2004. It is a vivid demonstration of the great big achievement because it
has occurred against the backdrop of about three times rise in population during the same
period (363.2 million in 1951 to 1085.6 in 2004) (ref., J.C. Katyal, data updated). The
production of oilseeds has increased from a mere 5.16 million tones in 1950-51 to 27.73
million tones in 2005-06 (Fig. 4). During the year 2001, India ranks first in the world in
production of milk, cattle, buffaloes, tea leaves, total pulses, jute and allied fibres; she ranks
second in the world in production of rice, wheat, fruits and vegetables, groundnut, sugarcane,
tobacco leaves and goat. However, declining land-man ratio happening in the wake of rising
population is highly disquieting because it puts progressively more strain on the non-
expandable assets, specifically land resources.


                                                   14
Rice
                                 225                         Wheat

                                 200
                                                             Coarse cereals
                                                             Pulses
                                 175
                million tonnes                               Total food grains
                                 150

                                 125

                                 100

                                  75

                                  50

                                  25

                                   0
                                        1

                                        3

                                        5

                                        7

                                        9

                                        1

                                        3

                                        5

                                        7

                                        9

                                        1

                                        3

                                        5

                                        7

                                        9

                                        1

                                        3

                                        5

                                        7

                                        9

                                        1

                                        3

                                        5

                                        7

                                        9

                                        1

                                        3

                                        5
                                      -5

                                      -5

                                      -5

                                      -5

                                      -5

                                      -6

                                      -6

                                      -6

                                      -6

                                      -6

                                      -7

                                      -7

                                      -7

                                      -7

                                      -7

                                      -8

                                      -8

                                      -8

                                      -8

                                      -8

                                      -9

                                      -9

                                      -9

                                      -9

                                      -9

                                      -0

                                      -0

                                      -0
                                    50

                                    52

                                    54

                                    56

                                    58

                                    60

                                    62

                                    64

                                    66

                                    68

                                    70

                                    72

                                    74

                                    76

                                    78

                                    80

                                    82

                                    84

                                    86

                                    88

                                    90

                                    92

                                    94

                                    96

                                    98

                                    00

                                    02

                                    04
                                  19

                                  19

                                  19

                                  19

                                  19

                                  19

                                  19

                                  19

                                  19

                                  19

                                  19

                                  19

                                  19

                                  19

                                  19

                                  19

                                  19

                                  19

                                  19

                                  19

                                  19

                                  19

                                  19

                                  19

                                  19

                                  20

                                  20

                                  20
                                                                                     Year


                                 Fig. 3: Food Grains Production in India (1950-51 to 2005-06)
                                            (Source: Fertilizer Statistics, 2005-06)


                                                        30           Groundnut
                                                        28

                                                        26
                                                                     Rapeseed&mustard
                                                        24           Soybean
                                                        22
                                                                     Total oilseeds
                                       million tonnes


                                                        20

                                                        18

                                                        16

                                                        14

                                                        12

                                                        10

                                                        8

                                                        6

                                                        4

                                                        2

                                                        0
                                                        19 51

                                                        19 54

                                                        19 57

                                                        19 60

                                                        19 63

                                                        19 6

                                                        19 69

                                                        19 72

                                                        19 5

                                                        19 78

                                                        19 81

                                                        19 84

                                                        19 87

                                                        19 90

                                                        19 93

                                                        19 96

                                                        20 9

                                                        20 02

                                                              5
                                                            -6


                                                            -7


                                                            -9


                                                            -0
                                                            -

                                                            -

                                                            -

                                                            -

                                                            -


                                                            -

                                                            -


                                                            -

                                                            -

                                                            -

                                                            -

                                                            -

                                                            -

                                                            -


                                                            -
                                                          50

                                                          53

                                                          56

                                                          59

                                                          62

                                                          65

                                                          68

                                                          71

                                                          74

                                                          77

                                                          80

                                                          83

                                                          86

                                                          89

                                                          92

                                                          95

                                                          98

                                                          01

                                                          04
                                                        19


                                                                                       Year


                                   Fig. 4: Oilseeds Production in India (1950-51 to 2005-06)
                                           (Years prior to 1969-70 relate to 5 oilseeds)
                                                                (Source: Fertilizer Statistics, 2005-06)
India's agricultural growth was triggered by massive public investments in agricultural
research, education and extension, expansion in irrigated area, increase in agro-inputs
(fertilizer, seeds, pesticides, etc), government policies and above all willing support of
farmers in adopting improved technologies. Rise in the irrigation water availability has been
the key factor promoting use of and response to all other agro-inputs. The irrigated area
increased from 20 million ha in 1950 to 57 million ha in 2000-01. Fertilizer use has risen
from 69.8 thousand tonnes (of NPK) to 18.4 million tonnes (a whopping rise of 266 times) in
about 50 years. Fertilizer in the presence of irrigation and seeds of high yielding varieties has
been the key input in ushering in the green revolution in India. However, at present, there is a
falling response of cereal crops to fertilizers (NPK) (Table 11). This fall in response has
largely been felt with rice and wheat. These together consume nearly 70% of the total


                                                                                  15
fertilizers used in the country and are cultivated in well-endowed irrigated or assured rainfall
areas.

       Table 11: Response to Fertilizer Application in Food Grains Production

 Period            Food       Increase in                Fertilizer use             Response**
                  grains      food grains      Total       Food         Increase    (kg/
                production    production                  grains*       (million    kg nutrient)
                   (mt))         (mt)           (mt)        (mt)      tones (mt)
 1970-75             103.02               -       2.62        1.83              -                  -
 1975-80             120.04          17.02        4.19        2.93          1.10           15.49
 1980-85             138.07          18.03        6.78        4.75          1.81            9.94
 1985-90             155.03          16.96        9.70        6.79          2.04            8.30
 1990-95             180.00          24.97      12.67         8.87          2.08           12.01
 1995-2000           197.11          17.11      15.85        11.10          2.23            7.69
 2000-2005          198.85            1.74       17.07       11.95          0.85            2.04
 *Assuming 70% of the fertilizers were used for food grains
**Ignoring the effect of area expansion, irrigated area and the high yielding varieties
  (Up to 1990, calculations were made by Dr. D.R. Bhumbla)

Along with unsustainable yields, nutrient imbalances encourage continuous build up of those
nutrients that remain unutilized by growing crop plants. The left over nutrients are the
principal cause of fertilizer use related environmental pollution. For instance: unutilized P
can cause eutrophication of lakes and rivers, whereas unused N can lead to ground water
pollution (as nitrate) or promote breakdown of protective ozone layer (as nitrous oxide)
which shields earth against the harmful effects of ultraviolet radiation. It thus appears that the
same factors (irrigation and fertilizer nutrients), which ushered in green revolution are being
blamed to pull it down also. What is required is to emphasize integrated nutrient management
(man made and native nutrient sources combined). This time tested strategy will assure
balanced nutrition, sustainable yields and good soil health (Katyal).

The sustainability of agriculture is ostensibly imperiled by the lack of adequate land
management systems and inputs in the fragile and marginal environments like dryland
regions. For example, rice, wheat and sugarcane - the three predominantly irrigated crops,
usurp about 80% of the fertilizer - N used in the country. Share of fertilizer-N for sorghum,
which is chiefly rainfed and ranks third after rice and wheat in area, does not exceed even 2%
of the total consumption. Without intensification in fertilizer use along with organic manure,
sustainable productivity from rainfed areas will remain a mirage (ref., J.C. Katyal).

Animal Production, its carrying capacity and fodder needs: From the agricultural
standpoint, India is endowed with very significant diversity among domesticated animals.
These represent. some 26 breeds of cattle, 8 of buffaloes, 40 of sheep, 20 of goats, 8 of
camels, 14 of horses and 18 of poultry. Another vital issue on sustenance of cattle wealth is
related to their overflowing number. Thus, the rate of growth of animal production (including
the total fish production) is remarkable (Fig. 5). The estimated population (year 2001) of
cattle (220 million), buffaloes (94 million), camels, sheep, goats etc. is remarkable in the
country compared to the world population. This animal population exceeds the carrying
capacity of India's natural resources. According to one estimate, the ideal number of


                                                   16
livestock, keeping in view the carrying capacity of land to support grazing, is only about 50
million heads, i.e., one-ninth of the current population. As a result of mismatch between the
number of livestock and inability of natural resources to sustain them, sub-optimal nutrition is
rampant. National Commission on Agriculture estimated that only 56% of the dry fodder and
27% of the green fodder requirement were being met (Katyal). The demand supply gap is
likely to widen further in future. It is the poor availability of fodder which forces uncontrolled
grazing, leading to diminished vegetative cover and accelerated degradation of land. In rain
fed areas with possibility of double cropping farmers are constrained to take a post rainy
season crop because of uncontrolled grazing. Clearly, improvement in forage production is an
important strategy to increase animal productivity and saving natural resources from
degradation.
                                                               Milk, egg, wool and fish production in India
                                        100
                                                                          Milk (million tonnes)
           million tonnes/ billion nos/ million kg/ lakh


                                                   90                    Eggs (billion nos)
                                                   80                    Wool (million kg)
                                                                         Fish (lakh tonnes)
                                                   70

                                                   60
                              tonnes


                                                   50

                                                   40

                                                   30

                                                   20

                                                   10

                                                           0
                                                                19 19 19 19 19 19 19 19 19 19 19 19 19 19 19 19 19 19 19 19 19 19 19 20 20 20 20
                                                                50- 60- 70- 80- 81- 82- 83- 84- 85- 86- 87- 88- 89- 90- 91- 92- 93- 94- 95- 96- 97- 98- 99- 00- 01- 02- 03-
                                                                51 61 71 81 82 83 84 85 86 87 88 89 90 91 92 93 94 95 96 97 98 99 00 01 02 03 04

                                                                                                                  Year

                                                                             Fig.5: Production of Animal Products in India
                                                                                 (Source: Fertilizer Statistics, 2005-06)

Advances in agricultural production technology has considerably raised farm output but has
created problems of land degradation, declining of soil organic carbon, pesticide residues in
farm produce, degradation of genetic resource base, environmental pollution, climate change,
shrinkage in water reservoir capacity, problems of water scarcity, water pollution etc.
Emission of smoke and gases from industry and automobiles etc. increase CO2 content of the
atmosphere. Effluents of the industry and mining are contaminating water bodies and are
degrading the land. High dose of N- fertilizers in some areas are polluting water bodies with
high level of nitrates. Pesticide residue in soil contaminates water bodies. The pace of
agricultural activities hastens the process of degradation, denudation of forests, and loss of
arable land, desertification and reduction of genetic diversity. The natural resource base is
degraded and the quality of the environment sustaining human life is adversely affected.

The remedial measures to combat these problems rely on the adoption of conservation
farming techniques. The suitable measures include conservation of genetic resources,
integrated nutrient management, efficient on-farm water management, participatory
watershed management, integrated pest management, etc. The soil and water conservation
measures should be adopted for successful conservation farming. The management of crop


                                                                                                              17
residues through conservation tillage (zero or minimum tillage), mulch farming rather than
residue burning is encouraged. The recycling of farm waste (crop residues and animal dung,
urine etc.) to the crop field should be practiced considering the farm as a self-sustaining
system. The selection of efficient crop rotation is important for successful sustainable
agriculture. Thus, the conservation farming approach and practices only will ensure long-
term sustainability in the agricultural systems.

Maintenance of Production Base in Irrigated Agriculture
Compared to 1950, the net area under irrigation is increased by about three times. The net
irrigated area of 52.96 million ha is distributed among canals (30.4%), tanks (5.1%), wells
(20.7%), tube wells (37.3%) and others (6.5%) (Fertiliser Statistics 2005-06). While there is
no doubt on the valuable contribution of irrigated area to ushering in of green revolution, it is
the vast gap (~10 million ha) between the irrigation potential created (94.73 million ha) and
utilized (84.7 million ha) by the end of 1999-200, which is quite disturbing. The Table 12
indicates the area covered under irrigation by the major crops in India.

The actual potential of an irrigation project is diminished due to difficulties in reaching by
gravity flow to high ground patches, changes in cropping pattern favouring high water
requiring crops and the greedy use of water by the farmers at the top end of the distributaries.
Unscrupulous use of canal water is the root cause of widespread poor water use efficiency,
which produces side effects like water logging, soil salinity and alkalinity. As per the
available data, the total area suffering from water logging is 8.53 million ha, while that
affected by salinity and alkalinity is around 9 million ha. Compared to canal water, ground
water is used more efficiently. With groundwater the problems are more of social nature. For
instance, wealthy groundwater farmers continue to extract more water despite falling depth of
water table. Unabated deepening of wells and withdrawals cause drying of open shallow
wells which usually poorer farmers depends for irrigation.

Table 12: Percentage Area covered under Irrigation for Principal Crops (2000-2001)

      S.     Crops                                Area                   Percentage covered
      No.                                         (million ha)           under irrigation
         1   Rice                                 44.71                  53.6
         2   Wheat                                25.73                  88.1
         3   Maize                                6.61                   22.4
         5   Jowar                                9.86                   7.9
         6   Bajra                                9.83                   8.0
         7   Total cereals                        100.77                 49.8
         8   Gram                                 5.19                   30.9
         9   Arhar                                3.63                   4.2
       10    Total pulses                         20.35                  12.5
       11    Total foodgrains                     121.05                 43.4
       12    Groundnut                            6.56                   17.6
       13    Rapeseed&Mustard                     4.48                   66.1
       14    Soybean                              6.42                   1.4
       15    Total oilseeds                       22.77                  23.0
       16    Cotton                               8.53                   34.3
       17    Tobacco                              0.26                   52.8
       18    Sugarcane                            4.32                   92.1
       19    Total area under all crops           140.88                 40.2

       (Source: Agricultural Statistics at a Glance (2004), Fertilizer Statistics (2005-06))


                                                  18
In the tracts where ground water recharge is limited, it is the sustainability of agriculture,
which becomes at stake. Deepening of water tables in the areas where less rainwater is
captured than necessary to off set the withdrawals is likely to lead ultimately to permanent
water deficit situation. Further, overdraft of ground water aggravates surfacing of harmful
fluorides and salts. To reverse the situation, apparently the priority area of activity is to
rationalize ground water withdrawals. More important than that from the sustainable
agriculture point of view is the maximization of the ground water recharge through
appropriate but farmer supported interventions favouring minimization of runoff water. This
is reiterating the point made earlier on reining the rainwater if agriculture in India has to
remain sustainable.

Thus, in the green revolution areas/ irrigated areas it is the prosperity and overuse of inputs,
which threaten sustainability; while in marginal and fragile environments it is the poverty and
over-exploitation, which endanger sustainability.

Modernization of Agriculture and its relation with Sustainability
The Low External Input Sustainable Agriculture (LEISA) relies mostly on the inputs from the
local farm, village or region and deliberate action is taken to ensure sustainability.

The principles are:
   i)      Securing favourable soil conditions for plant growth particularly managing
           organic matter and enhancing soil life,
   ii)     Optimizing the nutrient availability and balancing the nutrient flow, particularly
           by means of nitrogen fixation, nutrient acquisition and complementary use of
           external fertilizers,
   iii)    Minimizing the losses due to plant and animal pests by means of prevention and
           safety treatment,
   iv)     Minimizing losses due to flows of solar radiation, air, water by way of
           microclimate management, water management and erosion control.

In the High External Input Agriculture (HEIA), production for the far off markets
necessitated use of external inputs like chemical fertilizers, hybrid seeds, pesticides, irrigation
etc. Increased dependency on high cost external inputs in agriculture also made farmers to
depend on external credit on a regular basis. Cultivation of cash crops like cotton and
tobacco, also led to scarcity of fodder. This resulted in farmers giving up animal husbandry,
thereby resulting in acute scarcity of farmyard manure and making the use of chemical
fertilizers inevitable.

Adoptions of modern technologies in agriculture like tractors and pump sets have resulted in
the neglect of draught animals. Even the livestock production has been totally changed into
industrial type of production from backyard system. Animals provide manure, food and
income and are used for cultivation and transport economically. Different animals can be fed
on farm wastes efficiently, which provide financial security at the time of distress. In Indian
culture, cattle are treated as an integral part of the family. After undergoing the huge loses
from adapting crossbred cows like Holstein, Frisien and Jersey, farmers are fast changing
towards indigenous cattle, since their maintenance is cheaper and the male calves can be used
for cultivation and transport.

Agriculture in India, was an integrated cultivation of crops, animals and trees to meet most of
the family and community needs rather than market. Trees played an important role in


                                                19
providing green manure, fodder, fruits, fuel and timber besides conserving soil water and
hosting beneficial insects and birds. Now, it is necessary to revive the traditional knowledge
on seed selection and preservation to bring back the self-reliance and seed availability at the
time of sowing.

Similarly, rural population is fast changing their medical treatments since synthetic drugs
have become more expensive and found to create side effects. They now started growing
medicinal plants like Neem, Aswagandha, Asparagus, Aloevera, Adathoda etc., for
medication of both humans and their livestock.

The Government’s concern of impending scarcity of fossil fuel resources is an encouraging
factor for promotion of ecological agriculture. However, the fear of lower food production
and availability of biomass is coming in the way of progressing towards organic farming. The
goal of LEISA, therefore, should be based on economic interests by popularizing production
of seeds, vermicompost, botanical pesticides etc.

LEIA vis-à-vis HEIA: A brief account of LEIA vis-à-vis HEIA is presented in Table 13.

                               Table 13: LEIA vis-à-vis HEIA

  S.    Characteristics of HEIA                         Characteristics of LEIA
  No.
   1    The farming pattern depends heavily on          LEIA relies on the optimal use of natural
        external and chemical inputs.                   processes. Although yields have increased
                                                        substantially, contributing to raising total
                                                        production, farmers and the environment have
                                                        had to pay the price for keeping up with this
                                                        development.
   2    The focus of agricultural development           The focus is on the sustainability of farming
        and research has mainly been on                 system
        maximizing yields coupled with
        increasing specialization of production
   3    There is a great damage to the                  Environmentally sound and that have the
        environment                                     potential to contribute to the long-term
                                                        sustainability of agriculture.

   4    The continuing drop in prices of farm           Greater emphasis is on the long-term
        produce and the rising costs of                 sustenance and balance between the profit and
        agricultural inputs have made farming           livelihood.
        increasingly unprofitable
   5    HEIA depends on the higher production           Sustainable ecological practices depend largely
        and profit, without consideration of the        on local agro-ecological conditions and on local
        local needs and local market                    socio-economic circumstances, as well as on
                                                        farmers’ individual needs and aspirations.
   6    Primarily one or two commodity driven           One way of LEIA is to diversification of farms;
        development, lack of diversity in the           with a range of crops and/or animals, farmers
        farming practices, as a result, there is        will suffer less from price fluctuations or drops
        greater risk of failure and price               in yield of single crops. Maintaining diversity
        fluctuation. The number of products and         will also provide a farm family with a range of
        commodities are very minimum.                   products to eat or sell throughout a large part of
                                                        the year.


                                                   20
7     Under HEIA system, soil quality                    LEIA maintains a healthy soil, recycling
         deteriorates, and there is resurgence of           nutrients on the farm, and utilizing approaches
         pests, lack of resilience in the soil-plant        such as integrated pest management (IPM).
         system

   8     In HEIA, there is lack of use of                   Best bet technologies, for example, soil and
         indigenous technologies.                           water conservation (terraces, ditches, and
                                                            vegetation strips on sloping land), better timing
                                                            of operations, improved crop spacing and
                                                            densities, manure or compost and water
                                                            application based on local conditions.


Conventional vis-à-vis Organic Farming for Sustainability: Escalating production costs,
heavy reliance on non-renewable resources, reduced biodiversity, water contamination,
chemical residues in food, soil degradation and health risks to farm workers handling
pesticides all bring into question the sustainability of conventional farming systems.

It has been reported, however, that organic farming systems are less efficient, pose greater
health risks and produce half the yields of conventional farming systems. Nevertheless, the
importance is fastest growing in favour of organic farming in selected crops and agro
ecological conditions. Organic management practices should be made popular which are
combined with traditional conservation-minded farming methods with modern farming
technologies but conventional inputs such as synthetic pesticides and fertilizers are excluded,
instead greater emphasis on building up the soil fertility with compost additions and animal
and green manures, controlling pests naturally, rotating crops and diversifying crops and
livestock.

Just because a system is organic or integrated does not ensure its sustainability; nor does
sustainability readily lend itself to quantification. To be sustainable, a farm must produce
adequate yields of high quality, be profitable, protect the environment, conserve resources
and be socially responsible in the long run. But under conventional economic systems,
market and social forces can change the viability of a production system independent of its
environmental sustainability. However, ecological and economic systems should be linked so
that sustainable land management is a prerequisite for economic sustainability.

Basic Ecological Principles of LEISA

(i)A living soil: Soil can be regarded as a non-renewable resource, as soil formation is such a
slow process. The soil provides a medium to anchor plant roots, but is also a very complex
ecosystem. A productive agricultural soil is full of life, with millions of microorganisms
which all interact chemically and physically with their soil environment. These processes
regulate the release of nutrients from minerals and organic matter to feed the plants. A living
soil has a better structure and can absorb and retain more water and air than a sterile soil.
Sound ecological production therefore begins with improving the soil. Good practices, which
can help improve the condition of the soil, are (LEISA, 2006):

   (i)   Growing legumes to fix nitrogen from the air and provide it to the following crop,
  (ii)   Feeding the soil with as much organic matter as possible through green manure,
         compost, cover crops, returning of non-toxic organic wastes and agroforestry;
 (iii)   Keeping the soil covered at all times with mulch or cover crops


                                                       21
(iv)   No or reduced tillage which enhances water availability and soil conservation,
   (v)   Cultivating a range of crops and animals to reduce risks of disease and pest
         outbreaks, maintain a balanced nutrient supply and provide resilience;
  (vi)   Planting trees on contours or making terraces to prevent soil erosion by wind or
         water.

(ii) Biological diversity: The diversity of different species of plants and animals, and the
genetic variation within each species, provides the vital resource of biological diversity,
which enables life on earth. Healthy ecosystems are relatively stable and the diversity they
contain enables them to adapt to changing circumstances.

For many small-scale farmers the available agrobiodiversity is the basis of survival. A mix of
different locally adapted crops and animals and different varieties of the same increases on-
farm diversity, increasing the chances of producing something even under adverse conditions.
These principles of traditional farming can be further developed and used systematically in
ecological farming.

Some examples of such practices are (LEISA, 2006):
   (i) Intercropping in time and space: planting different crops together in different
        combinations or formations, or in sequence, can optimize the use of available
        resources and reduce the pressure of pests.
  (ii) Different plant species can also be used to support the ecological functioning of the
        whole farm system: examples are trees or bushes for windbreaks, flowering plants
        which provide food and habitat for beneficial insects that help control pests, shade
        trees for light-sensitive plants, trees to provide green manure and fuel wood.
 (iii) Integration of different crops or weeds with animals to better utilizes resources, for
        example fish in rice fields, integrated crop-chicken-fish systems and other
        combinations of crops and animals.

(iii)Water: Growing populations, rapid urbanization and increasing industrial and
agricultural production are all increasing competition for and pressure on water. As
agriculture is one of the major users of water, and one of the major polluters of water
resources, it is imperative that water use in agriculture is as efficient as possible and that
leaching of surplus nutrients and in small scale farming it is important to make the best
possible use of the limited amounts of available water. Infiltration can be improved by
keeping the soil covered, through minimum disturbance of the soil, adding organic matter
from cover crops and mulching.

When introduced, water-harvesting systems are generally multi-purpose. Farm ponds, earth
dams and sub-surface tanks will often serve as a source of drinking water and water for
livestock during periods of water scarcity. Water harvesting can open up new livelihood
options. Subsistence farmers, who invest in water harvesting systems with a storage
component, often diversify their farming system to include cash crop production, for the local
market during off-season when prices are high. This diversification increases the resilience of
farm households, as they are better equipped to cope with periods of climatic hazards such as
droughts and floods.

(iv) Energy: Solar energy is captured by plants that are able to transform it into biomass.
This is the basis for all higher life forms, animals as well as humans, and is a process that is
unique for green plants. Biomass contains stored energy as well as nutrients, and agriculture


                                              22
should focus on maximizing the amount of solar energy, which is captured and transformed
into plant growth and thereby food and fodder resources. But additional energy is required for
cooking and heating and is useful for irrigation, threshing and processing. Fortunately there
are many opportunities to make use of renewable energy, most frequently fuel wood, straw,
crop residues and even manure are used. There are also other possibilities to make use of
renewable energy: small scale bio-digesters which use manure, solar energy devices, small
scale hydropower generators, wind-power and wood lots for fuel wood.

(v) Exploiting Animal-Plant Interaction: In nature, nothing functions in isolation;
everything depends on the other factors present. In animal production, to optimize the
performance of cattle, it is very important that management practices should enhance the
ecological functioning of the web of living organisms within the production system - climate,
soil and soil life, vegetation and cattle - by influencing their interactions.

For cattle production, it is important that the breed is selected first, then the pasture suited to
that breed and finally the soil is corrected with proper fertilizer or amendment (if needed) to
make the pasture grow. This order has to be reversed. The pasture has to be adapted to the
soil and the cattle to the pasture, and all of it has to fit the climate. In addition, the forage
crops are to be grown. Of course, in dry areas, forage yields depend strongly on the
availability of water. In a well-structured soil, roots are able to explore a larger soil volume
for more water and nutrients. Integrating deep-rooting crops and trees into the pasture system
will further increase the production of biomass and the overall performance of the system
(LEISA, 2006).

In native grassland, cattle always first eat the plants it likes most. The plants that are not eaten
get old, hard and are not tasty. The eaten plants sprout again and are grazed on another time.
This goes on until these palatable plants disappear. But the less appreciated plants continue to
grow and multiply and with time the entire pasture gets hard, rough and has little nutritive
value. Then the ranchers set fire to the pasture. Many plants die, and only those that can
protect their growing points against fire survive. Thus the pasture becomes worse and the
forage volume smaller. Thus all organic matter that nourishes soil microorganisms is burned
out, resulting in their death. The soil compacts, water runs off and the vegetation gets
scantier. Thus, the division of pastures into smaller sub-units for grazing rotation is
fundamental for sustainability of pasturelands.

However, to prevent ‘global climate change’ by ‘greenhouse gases’, it is important to reduce
methane emission by cattle. This obliges farmers to speed up animal production per unit area
and to reduce the slaughter age to get a lower ratio of kg methane/kg animal protein (meat).
The use of grains for animal feed has to be reduced as well, giving priority to human
consumption. This then increases the dependence on forage. But, as grass cellulose is the
main source of methane emission, management practices that contribute to an increase of
forage yield per unit area and maintain stocking rate without weight losses, all year long, are
needed.

(vi) Towards Local Resources-based Integrated Crop- Livestock Systems: The present
livestock production systems in most industrialized countries are in direct competition with
human needs. Livestock presently consume almost 50% of world cereal grain supplies. In the
intensive large-scale production systems, increasingly promoted by corporate agriculture,
livestock wastes contaminate soil and water resources, create less than favourable working
conditions for the personnel involved in feeding and cleaning, and decrease employment


                                                23
opportunities. To meet food needs in 2050, it is necessary to develop livestock production
systems, which do not depend on cereal grain.

In developing countries like India, instead of grain-based livestock systems, alternative
production systems must be developed which make optimal use of locally available
resources. Close integration of livestock in the farming system, with recycling of all excreta,
will be the basis of agriculture, which can be highly productive and also sustainable.

In tropical countries, especially in the humid zone, there are many crops and farming systems
that considerably exceed the productive capacity of grain cereals. Key plants in this scenario
are sugar cane, cassava, and the palm family, especially the oil and sugar palms. The yield
potential of the sugar palm (Borassus flabellifer) is extremely impressive. An annual average
yield equivalent to 18 tonnes of soluble sugars per hectare has been documented in a study
with 12 family farm households in Cambodia.

Some Promising LEISA Techniques and Practices

(i) Nutrient management: Nutrient management is managing the amount, source,
placement, form, and timing of the application of nutrients and soil amendments to ensure
adequate soil fertility for plant production and to minimize the potential for environmental
degradation, particularly water quality impairment. Nutrient management has taken on new
connotations in recent times. Soil fertility traditionally dealt with supplying and managing
nutrients to meet crop production requirements, focusing on optimization of agronomic
production and economic returns to crop production (LEISA, 2006). Contemporary nutrient
management deals with these same production concerns, but recognizes that ways of farming
must now balance the limits of soil and crop nutrient use with the demands of intensive
animal production.

Farmers in the hill agriculture follow a system of close integration of crop, livestock and
forestry/grassland management. Farmers maintain traditional practices such as terracing,
manure management, legumes inter cropping, and mulching where appropriate. Farm yard
manure quality can be increased by better decomposition and the N-content can be increased
by at least 2 to 3 times from about 0.5% N to 1.5% N through proper management of urine
and manure.

Liquid manure can be prepared from urine and various plants extracts rich in minerals or
secondary plant compounds. These “manure teas” were shown to be effective liquid
fertilizers on crops such as vegetables and also for organic pest and disease management.
Local marketing systems for such “manure teas” are emerging in some areas. The use of urea
fertilizer declined in several areas due to liquid manure use. In Nepal, some of the LEISA
practices are: Bio-pesticide (cow urine, neem products, tobacco, ash etc), composting (pit),
tree plantation, green manuring, vermicomposting, liquid compost, NADEP compost, seed
treatment, seed production.

(ii) Integrated pest management (IPM): IPM is an ecologically based approach to pest
(animal and weed) control that utilizes a multi-disciplinary knowledge of crop/pest
relationships, establishment of acceptable economic thresholds for pest populations and
constant field monitoring for potential problems. Management may include such practices as
(LEISA, 2006):
     • use of resistant varieties;


                                              24
•   crop rotation;
   •   cultural practices;
   •   optimal use of biological control organisms;
   •   certified seed;
   •   protective seed treatments;
   •   disease-free transplants or rootstock;
   •   timeliness of crop cultivation;
   •   improved timing of pesticide applications;
   •   removal or 'plow down' of infested plant material."

The term biointensive IPM emphasizes a range of preventive tactics and biological controls
to keep pest population within acceptable limits. Reduced risk pesticides are used if other
tactics have not been adequately effective, as a last resort and with care to minimize risks.

Biological control is, generally, man's use of a specially chosen living organism to control a
particular pest. This chosen organism might be a predator, parasite, or disease, which will
attack the harmful insect. A complete biological control program may range from choosing a
pesticide which will be least harmful to beneficial insects, to raising and releasing one insect
to have it attack another, almost like a 'living insecticide.'"

(iii) Crop Residue Management and Conservation Tillage: Conservation tillage is a term
that covers a broad range of soil management systems that leave residue cover on the soil
surface, substantially reducing the effects of soil erosion from wind and water. These
practices minimize nutrient loss, decreased water storage capacity, crop damage, and improve
soil quality. The soil is left undisturbed from harvest to planting except for nutrient
amendment. Weed control is accomplished primarily with herbicides, limited cultivation,
and, in more sustainable systems, with cover crops.

The National Crop Residue Management Survey (Conservation Technology Information
Center (CTIC)) specifies that 30 percent or more of crop residue must be left after planting to
qualify as a conservation tillage system. Some specific types of conservation tillage are
Minimum Tillage, Zone Tillage, No-till, Ridge-till, Mulch-till, Reduced-till, Strip-till,
Rotational Tillage and Crop Residue Management.

(iv) Converting Farm Wastes into useful Organic Manure under LEISA System: The
ingredients required are green leaves, dry leaves, weeds from adjacent farms, cow dung and
urine, fodder wastes from cattle sheds, gobar gas slurry, coir pith, tank silt, quarry dust and
rock phosphate. These items are put in alternate layers (cow dung in between layers) in a
heap and left for 45 days. The heap is turned once or twice. In 45 days, the items get semi-
decomposed. The partially decomposed material can be used in two ways- for vermi compost
preparation, which gets converted to vermi compost in 45 days, and the other way is to add
coir pith, tank silt and quarry dust to semi decomposed material, which turns into good
quality manure in 45 days.

(v) Green Manuring and Cover Crops: Green manure and cover crop species should fit the
agroecological condition. In general, these crops should have the characteristics as: easy
establishment, vigorous growth under local conditions, ability to cover weeds quickly, ability
to either fix atmospheric nitrogen or concentrate plenty of phosphorus, should also have
multiple uses.


                                              25
The green manure and cover crops can be grown intercropped with another food for example
beans with maize or cassava, or perennial peanut with coffee. These crops can be grown on
wasteland or on fields under fallow. The species should survive on very poor soils, such as
beans, tephrosia, or particularly hardy trees. Farmers in Vietnam, for example, seed
Tephrosia candida into their first year fallow, thereby reducing the normal five-year fallow to
just one or two years.

These crops can be grown during the dry season, planted after the normal crops like the rice
bean/ rice system in Vietnam, or intercropped with the normal crop and then allowed to grow
through the dry season such as the sweet clover/maize system in Mexico. It can also be
planted as a relay crop amongst rainy season crops at the end of the wet season to take
advantage of the residual moisture, such as the cowpea/maize and lablab/maize systems in
Thailand.

Green manuring adds organic matter to the soil; green manure crops return to the upper top
soil the plant nutrients taken up by the crop from deeper layers; improves the soil structure
and other soil physical properties; leguminous crops add nitrogen to soil; increases the
availability of certain plant nutrients like P, K, Ca, K, Mg and Fe; facilitates infiltration of
water thus decreasing runoff and soil erosion; green manure crops hold plant nutrients that
would otherwise be lost by leaching.

The main problem in adoption of green manuring is that the land on which green manure crop
is raised could have been profitably utilized for growing a crop of economic importance.
Another problem is adequate soil moisture either through rainfall or irrigation is essential for
in-situ decomposition of green manure crop. Under rainfed condition, if sufficient rainfall is
not received proper decomposition may not take place, and the germination of the succeeding
crop is hampered. There is a possibility of incidence of diseases and pests, even nematodes.

(vi) Practices for Land Degradation: A good plant cover is very important for preventing
soil degradation and achieving soil rehabilitation. A vegetative cover has a number of
beneficial effects on soil aeration, soil moisture and organic matter content, physical
characteristics and biological activity in the soil. In addition, a plant cover protects against
soil erosion. Cover crops can be quite aggressive creepers and may compete with the main
crop. On the other hand if leguminous plants are used as cover crops they add nutrients
because they fix atmospheric nitrogen and make it available for the crop.

Selection of crops is very important while dealing with degraded soils. Sodic soils in South
Indian region were corrected for their soil pH by including cucumber in the cropping pattern.
Similarly, raising Eucalyptus plantation along the canal bunds helped in solving the drainage
problem in low-lying delta areas. Farmers follow their own traditional practices in
maintaining soil physical structure and health. Practices like application of sand, groundnut
shell, sal leaves, retention of sunflower stalks are a few among those followed by the farmers
for mulching in South Indian condition.

(vii) Intercropping: Intercropping is defined as growing of two or more crops
simultaneously on the same piece of land; crop diversification is in both temporal and spatial
dimension; there is intercrop competition during all or part of the crop growth. There are
many types of intercropping viz., mixed intercropping, row intercropping, strip intercropping
and relay intercropping.


                                              26
Revised+sustainable+agriculture

Más contenido relacionado

La actualidad más candente

Sustainable Agriculture
Sustainable AgricultureSustainable Agriculture
Sustainable AgricultureNirav Maru
 
Crop Modeling - Types of crop growth models in agriculture
Crop Modeling - Types of crop growth models in agricultureCrop Modeling - Types of crop growth models in agriculture
Crop Modeling - Types of crop growth models in agricultureSREENIVASAREDDY KADAPA
 
Role of Grasses and Pastures, Wind breaks and Shelter belts in soil conserva...
Role of Grasses and Pastures,  Wind breaks and Shelter belts in soil conserva...Role of Grasses and Pastures,  Wind breaks and Shelter belts in soil conserva...
Role of Grasses and Pastures, Wind breaks and Shelter belts in soil conserva...Abhilash Singh Chauhan
 
Non Chemical Weed Control
Non Chemical Weed ControlNon Chemical Weed Control
Non Chemical Weed ControlNishanth S
 
Importance of integrated nutrient management
Importance of integrated nutrient managementImportance of integrated nutrient management
Importance of integrated nutrient managementMahmooda Buriro
 
Climate resilient and environmentally sound agriculture - Module 5
Climate resilient and environmentally sound agriculture - Module 5Climate resilient and environmentally sound agriculture - Module 5
Climate resilient and environmentally sound agriculture - Module 5FAO
 
Zero Budget Natural Farming
Zero Budget Natural FarmingZero Budget Natural Farming
Zero Budget Natural FarmingTractor junction
 
Contingency Crop Planning
Contingency Crop PlanningContingency Crop Planning
Contingency Crop PlanningAkash Singh
 
Classification of herbicides
Classification of herbicidesClassification of herbicides
Classification of herbicidesVandana Dhurve
 
Shelterbelts and windbreaks
Shelterbelts and windbreaksShelterbelts and windbreaks
Shelterbelts and windbreaksbhargaviMadival5
 
INTEGRATED FARMING FOR SMALL AND MARGINAL FARMERS
INTEGRATED FARMING FOR SMALL AND MARGINAL FARMERSINTEGRATED FARMING FOR SMALL AND MARGINAL FARMERS
INTEGRATED FARMING FOR SMALL AND MARGINAL FARMERSDr.jayakanth Koppaka
 

La actualidad más candente (20)

Agfo case studies of india
Agfo case studies of indiaAgfo case studies of india
Agfo case studies of india
 
Climate-Smart Agriculture presentation, Sonja Vermeulen
Climate-Smart Agriculture presentation, Sonja VermeulenClimate-Smart Agriculture presentation, Sonja Vermeulen
Climate-Smart Agriculture presentation, Sonja Vermeulen
 
Sustainable Agriculture
Sustainable AgricultureSustainable Agriculture
Sustainable Agriculture
 
Advantages and disadvantages of sustainable agriculture
Advantages and disadvantages of sustainable agricultureAdvantages and disadvantages of sustainable agriculture
Advantages and disadvantages of sustainable agriculture
 
Crop Modeling - Types of crop growth models in agriculture
Crop Modeling - Types of crop growth models in agricultureCrop Modeling - Types of crop growth models in agriculture
Crop Modeling - Types of crop growth models in agriculture
 
Types of Farming System
Types of Farming SystemTypes of Farming System
Types of Farming System
 
Role of Grasses and Pastures, Wind breaks and Shelter belts in soil conserva...
Role of Grasses and Pastures,  Wind breaks and Shelter belts in soil conserva...Role of Grasses and Pastures,  Wind breaks and Shelter belts in soil conserva...
Role of Grasses and Pastures, Wind breaks and Shelter belts in soil conserva...
 
Farm Budgeting
Farm Budgeting Farm Budgeting
Farm Budgeting
 
Resource Conservation Technology for Management of Soil Health
Resource Conservation Technology for Management of Soil HealthResource Conservation Technology for Management of Soil Health
Resource Conservation Technology for Management of Soil Health
 
Non Chemical Weed Control
Non Chemical Weed ControlNon Chemical Weed Control
Non Chemical Weed Control
 
Sustainable agriculture: is it optional, and can it feed the world?
Sustainable agriculture: is it optional, and can it feed the world?Sustainable agriculture: is it optional, and can it feed the world?
Sustainable agriculture: is it optional, and can it feed the world?
 
Importance of integrated nutrient management
Importance of integrated nutrient managementImportance of integrated nutrient management
Importance of integrated nutrient management
 
Climate resilient and environmentally sound agriculture - Module 5
Climate resilient and environmentally sound agriculture - Module 5Climate resilient and environmentally sound agriculture - Module 5
Climate resilient and environmentally sound agriculture - Module 5
 
Zero Budget Natural Farming
Zero Budget Natural FarmingZero Budget Natural Farming
Zero Budget Natural Farming
 
Contingency Crop Planning
Contingency Crop PlanningContingency Crop Planning
Contingency Crop Planning
 
Fertliser use efficiency
Fertliser use efficiencyFertliser use efficiency
Fertliser use efficiency
 
Climate-smart Agriculture
Climate-smart AgricultureClimate-smart Agriculture
Climate-smart Agriculture
 
Classification of herbicides
Classification of herbicidesClassification of herbicides
Classification of herbicides
 
Shelterbelts and windbreaks
Shelterbelts and windbreaksShelterbelts and windbreaks
Shelterbelts and windbreaks
 
INTEGRATED FARMING FOR SMALL AND MARGINAL FARMERS
INTEGRATED FARMING FOR SMALL AND MARGINAL FARMERSINTEGRATED FARMING FOR SMALL AND MARGINAL FARMERS
INTEGRATED FARMING FOR SMALL AND MARGINAL FARMERS
 

Destacado

Deforestation and a strategy for rehabilitation in beles sub basin, ethiopia
Deforestation and a strategy for rehabilitation in beles sub basin, ethiopiaDeforestation and a strategy for rehabilitation in beles sub basin, ethiopia
Deforestation and a strategy for rehabilitation in beles sub basin, ethiopiaAlexander Decker
 
Ethiopia forest & water management ashish ku sharma
Ethiopia forest & water management ashish ku sharmaEthiopia forest & water management ashish ku sharma
Ethiopia forest & water management ashish ku sharmaashlly29
 
Infographics for Food Security: FAO-JCU Workshop
Infographics for Food Security: FAO-JCU WorkshopInfographics for Food Security: FAO-JCU Workshop
Infographics for Food Security: FAO-JCU WorkshopAntonio Lopez
 
Alley Cropping in Agro Forestry - University of Missouri
Alley Cropping in Agro Forestry - University of MissouriAlley Cropping in Agro Forestry - University of Missouri
Alley Cropping in Agro Forestry - University of MissouriAliki85w
 
Let them print cake! 3D printing and food security.
Let them print cake! 3D printing and food security.Let them print cake! 3D printing and food security.
Let them print cake! 3D printing and food security.Michael Petch
 

Destacado (8)

International Potato Center - Food Security Through Asian Roots and Tubers (F...
International Potato Center - Food Security Through Asian Roots and Tubers (F...International Potato Center - Food Security Through Asian Roots and Tubers (F...
International Potato Center - Food Security Through Asian Roots and Tubers (F...
 
Deforestation and a strategy for rehabilitation in beles sub basin, ethiopia
Deforestation and a strategy for rehabilitation in beles sub basin, ethiopiaDeforestation and a strategy for rehabilitation in beles sub basin, ethiopia
Deforestation and a strategy for rehabilitation in beles sub basin, ethiopia
 
Ethiopia forest & water management ashish ku sharma
Ethiopia forest & water management ashish ku sharmaEthiopia forest & water management ashish ku sharma
Ethiopia forest & water management ashish ku sharma
 
Infographics for Food Security: FAO-JCU Workshop
Infographics for Food Security: FAO-JCU WorkshopInfographics for Food Security: FAO-JCU Workshop
Infographics for Food Security: FAO-JCU Workshop
 
Alley Cropping in Agro Forestry - University of Missouri
Alley Cropping in Agro Forestry - University of MissouriAlley Cropping in Agro Forestry - University of Missouri
Alley Cropping in Agro Forestry - University of Missouri
 
Alley cropping
Alley croppingAlley cropping
Alley cropping
 
Let them print cake! 3D printing and food security.
Let them print cake! 3D printing and food security.Let them print cake! 3D printing and food security.
Let them print cake! 3D printing and food security.
 
Alt Crop Systems
Alt Crop SystemsAlt Crop Systems
Alt Crop Systems
 

Similar a Revised+sustainable+agriculture

What is sustainable agriculture ppt By Allah Dad Khan
What is sustainable agriculture ppt By Allah Dad Khan What is sustainable agriculture ppt By Allah Dad Khan
What is sustainable agriculture ppt By Allah Dad Khan Mr.Allah Dad Khan
 
Protecting Water Quality on Organic Farms
Protecting Water Quality on Organic FarmsProtecting Water Quality on Organic Farms
Protecting Water Quality on Organic FarmsElisaMendelsohn
 
Protecting Water Quality on Organic Farms
Protecting Water Quality on Organic FarmsProtecting Water Quality on Organic Farms
Protecting Water Quality on Organic FarmsElisaMendelsohn
 
Integrated farming system and sustainable agriculture
Integrated farming system and sustainable agricultureIntegrated farming system and sustainable agriculture
Integrated farming system and sustainable agricultureShaheenPraveen1
 
Agroecology and Sustainable Development
Agroecology and Sustainable Development  Agroecology and Sustainable Development
Agroecology and Sustainable Development Z3P
 
The Role of Conservation Agriculture in Sustainable Agriculture
The Role of Conservation Agriculture in Sustainable AgricultureThe Role of Conservation Agriculture in Sustainable Agriculture
The Role of Conservation Agriculture in Sustainable AgricultureCSISA
 
90. Nutrient Management Under Organic Farming.pdf
90. Nutrient Management Under Organic Farming.pdf90. Nutrient Management Under Organic Farming.pdf
90. Nutrient Management Under Organic Farming.pdfFaisal Rasool
 
Organic Farming History and Techniques
Organic Farming History and TechniquesOrganic Farming History and Techniques
Organic Farming History and Techniquesx3G9
 
Organic Farming History and Techniques
Organic Farming History and TechniquesOrganic Farming History and Techniques
Organic Farming History and Techniquesx3G9
 
Traditional knowledge in climate smart agriculture
Traditional knowledge in climate smart agricultureTraditional knowledge in climate smart agriculture
Traditional knowledge in climate smart agriculturejayanta thokdar
 
R br env107 lec15 -sustainable agricuture
R br env107   lec15 -sustainable agricutureR br env107   lec15 -sustainable agricuture
R br env107 lec15 -sustainable agricuturesaifmahabub1
 
Farming for the Future with Ideas from the Past - University of Virginia
Farming for the Future with Ideas from the Past - University of VirginiaFarming for the Future with Ideas from the Past - University of Virginia
Farming for the Future with Ideas from the Past - University of Virginiaantonis3q
 

Similar a Revised+sustainable+agriculture (20)

What is sustainable agriculture ppt By Allah Dad Khan
What is sustainable agriculture ppt By Allah Dad Khan What is sustainable agriculture ppt By Allah Dad Khan
What is sustainable agriculture ppt By Allah Dad Khan
 
Protecting Water Quality on Organic Farms
Protecting Water Quality on Organic FarmsProtecting Water Quality on Organic Farms
Protecting Water Quality on Organic Farms
 
Protecting Water Quality on Organic Farms
Protecting Water Quality on Organic FarmsProtecting Water Quality on Organic Farms
Protecting Water Quality on Organic Farms
 
Integrated farming system and sustainable agriculture
Integrated farming system and sustainable agricultureIntegrated farming system and sustainable agriculture
Integrated farming system and sustainable agriculture
 
Agroecology and Sustainable Development
Agroecology and Sustainable Development  Agroecology and Sustainable Development
Agroecology and Sustainable Development
 
CONSERVATION AGRICULTURE : CONCEPTS, UTILITY AND APPROACHES
CONSERVATION  AGRICULTURE : CONCEPTS, UTILITY  AND APPROACHESCONSERVATION  AGRICULTURE : CONCEPTS, UTILITY  AND APPROACHES
CONSERVATION AGRICULTURE : CONCEPTS, UTILITY AND APPROACHES
 
The Role of Conservation Agriculture in Sustainable Agriculture
The Role of Conservation Agriculture in Sustainable AgricultureThe Role of Conservation Agriculture in Sustainable Agriculture
The Role of Conservation Agriculture in Sustainable Agriculture
 
90. Nutrient Management Under Organic Farming.pdf
90. Nutrient Management Under Organic Farming.pdf90. Nutrient Management Under Organic Farming.pdf
90. Nutrient Management Under Organic Farming.pdf
 
Organic Farming History and Techniques
Organic Farming History and TechniquesOrganic Farming History and Techniques
Organic Farming History and Techniques
 
Organic Farming History and Techniques
Organic Farming History and TechniquesOrganic Farming History and Techniques
Organic Farming History and Techniques
 
Organic Farming History and Techniques
Organic Farming History and TechniquesOrganic Farming History and Techniques
Organic Farming History and Techniques
 
1611 - Agroecological Strategies for Regenerative, Climate-Smart Agriculture ...
1611 - Agroecological Strategies for Regenerative, Climate-Smart Agriculture ...1611 - Agroecological Strategies for Regenerative, Climate-Smart Agriculture ...
1611 - Agroecological Strategies for Regenerative, Climate-Smart Agriculture ...
 
Traditional knowledge in climate smart agriculture
Traditional knowledge in climate smart agricultureTraditional knowledge in climate smart agriculture
Traditional knowledge in climate smart agriculture
 
My course seminar
My course seminarMy course seminar
My course seminar
 
Soil Health And Nutrient Budgeting As Influenced By Different Cropping Sequen...
Soil Health And Nutrient Budgeting As Influenced By Different Cropping Sequen...Soil Health And Nutrient Budgeting As Influenced By Different Cropping Sequen...
Soil Health And Nutrient Budgeting As Influenced By Different Cropping Sequen...
 
Aag 301
Aag 301Aag 301
Aag 301
 
Aag 202
Aag 202Aag 202
Aag 202
 
R br env107 lec15 -sustainable agricuture
R br env107   lec15 -sustainable agricutureR br env107   lec15 -sustainable agricuture
R br env107 lec15 -sustainable agricuture
 
Organic Farming Techniques ~ India
Organic Farming Techniques ~ IndiaOrganic Farming Techniques ~ India
Organic Farming Techniques ~ India
 
Farming for the Future with Ideas from the Past - University of Virginia
Farming for the Future with Ideas from the Past - University of VirginiaFarming for the Future with Ideas from the Past - University of Virginia
Farming for the Future with Ideas from the Past - University of Virginia
 

Más de Atrayee SenGupta

Más de Atrayee SenGupta (20)

Revision checklist for igcse geography
Revision checklist for igcse geography Revision checklist for igcse geography
Revision checklist for igcse geography
 
Geography igcse revision guide 2020
Geography igcse revision guide  2020Geography igcse revision guide  2020
Geography igcse revision guide 2020
 
Igcse geog glossary
Igcse geog glossaryIgcse geog glossary
Igcse geog glossary
 
Igcse Geography command words
Igcse Geography command wordsIgcse Geography command words
Igcse Geography command words
 
Ig hy revision questions pop, sett, plt. tect, rvr procs
Ig hy revision questions  pop, sett, plt. tect, rvr procsIg hy revision questions  pop, sett, plt. tect, rvr procs
Ig hy revision questions pop, sett, plt. tect, rvr procs
 
Geography remarks rubrics
Geography remarks rubricsGeography remarks rubrics
Geography remarks rubrics
 
Geography remarks rubrics
Geography remarks rubricsGeography remarks rubrics
Geography remarks rubrics
 
Chapter+1+resource+and+development+new+2008
Chapter+1+resource+and+development+new+2008Chapter+1+resource+and+development+new+2008
Chapter+1+resource+and+development+new+2008
 
Minerals class 12
Minerals class 12Minerals class 12
Minerals class 12
 
Gis concepts
Gis conceptsGis concepts
Gis concepts
 
Land management
Land managementLand management
Land management
 
Geography qp 2012
Geography qp 2012Geography qp 2012
Geography qp 2012
 
Christmas food
Christmas foodChristmas food
Christmas food
 
Coachingyourstafftosuccess
CoachingyourstafftosuccessCoachingyourstafftosuccess
Coachingyourstafftosuccess
 
Hinduism
HinduismHinduism
Hinduism
 
Logic of hinduism
Logic of hinduismLogic of hinduism
Logic of hinduism
 
Odysseus
OdysseusOdysseus
Odysseus
 
Lord of the flies
Lord of the fliesLord of the flies
Lord of the flies
 
How to use map symbols
How to use map symbolsHow to use map symbols
How to use map symbols
 
Plate tectonics
Plate tectonicsPlate tectonics
Plate tectonics
 

Revised+sustainable+agriculture

  • 1. MODERN CONCEPTS OF AGRICULTURE Sustainable Agriculture A. Subba Rao Director Indian Institute of Soil Science Nabibagh, Berasia Road, Bhopal- 462 038 K.G. Mandal Indian Institute of Soil Science Nabibagh, Berasia Road, Bhopal- 462 038 (11-12- 2007) CONTENTS Definition Concepts Needs Indicators of Sustainability Ecological basis of Sustainability/Resource Management Profile of Indian Agriculture in relation to Sustainability Maintenance of Production base in Irrigated Agriculture Modernization of Agriculture and its relation with Sustainability Basic Ecological Principles of LEISA Some Promising LEISA Techniques and Practices Mulching Wind breaks Water Harvesting Strip Cropping Intercropping Trap and Decoy Crops Bio-intensive Gardening Contour Farming Integrated Crop-Livestock-Fish Farming Evaluation of Constraints Optimization of Farming Systems Keywords Carrying capacity, integrated farming 1
  • 2. Agriculture is a key primary industry in India that makes a significant contribution to the wealth and quality of life for rural and urban communities in India. Definition Enshrined in the title of this chapter are two key words- ‘sustainable’ and ‘agriculture’. The word ‘sustain’, from the Latin sustinere (sus-, from below and tenere, to hold), to keep in existence or maintain, implies long-term support or permanence. The word ‘sustainability’ was used for the second time in 1712 by the German forester and mining scientist Hans Carl von Carlowitz in his book ‘Sylvicultura Oeconomica’. French and English scientists adopted the concept of planting trees and used the term ‘sustained yield forestry’ by Kara Taylor (ref., http://www.answers.com/topic/ sustainability). Sustainability is an attempt to provide the best outcomes for the human and natural environments both for the present and future. It relates to the continuity of institutional, environmental, social and economic aspects of human society, as well as the non-human environment. In agricultural parlance, sustainability means keep the crop productivity going without enhancing input levels. There are many definitions of sustainable agriculture. Simply stated, sustainable agriculture is a form of agriculture aimed at meeting the needs of the present generation without endangering the resource base of the future generations. Thus, a holistic and systems approach is essential for achieving sustainability. Sustainable agricultural systems are capable of maintaining their productivity and usefulness to society indefinitely. Such systems must be resource-conserving, socially supportive, commercially competitive, and environmentally sound. Concepts A group of Canadian scientists (MacRae et al., 1990) defined sustainable agriculture as: sustainable agriculture is a philosophy and system of farming. It has its roots in a set of values that reflect an awareness of both ecological and social realities. It involves design and management procedures that work with natural processes to conserve all resources, promote agroecosystem resilience and self regulation, minimize waste and environmental damage, while maintaining or improving farm productivity and profitability. The concept set out by the Technical Advisory Committee (TAC) of the Consultative Group on International Agricultural Research (CGIAR) states “Sustainable agriculture is the successful management of resources for agriculture to satisfy the changing human needs, while maintaining or enhancing the quality of environment, and conserving natural resources”. The United States Department of Agriculture defined ‘Sustainable agriculture’ as a management system for renewable natural resources that provides food, income and livelihood for present and future economic productivity and ecosystem services of these resources. Sustainable agriculture systems are those that are economically viable and meet society’s need for safe and nutritious food while maintaining or enhancing natural resources and the quality of the environment for future generations (Baier, 1990). Hallmark of these definitions is the harmony in maintaining buoyancy and dynamism in agricultural growth for meeting basic human needs and protection and conservation of natural resources. 2
  • 3. Needs Sustainable agriculture systems are designed to use existing soil nutrient and water cycles, naturally occurring energy flows for food production. As well, such systems aim to produce food that is both nutritious and without products that might harm human health. In practice, such systems have tended to avoid the use of synthetically compounded fertilizers, pesticides, growth regulators, and livestock feed additives, instead relying upon crop rotations, crop residues, animal manures, legumes, green manures, off-farm organic wastes, appropriate mechanical cultivation, and mineral bearing rocks to maintain soil fertility and productivity. The need of sustainable agriculture owes its origin to the philosophy of ‘holism’, which enunciates that all things are connected and their interactions in nature are complex. Stimulus to one component creates response to that as well as the system as a whole also responds. Appreciation of the theory of holism is very much embedded in our sayings and scriptures. An ancient Tamil proverb goes as follows, “No fodder, no cattle; no cattle, no manure; no manure, no crop”. Translation of a Sanskrit text from about 1500 BC reads as “Upon this handful of soil our survival depends. Husband it and it will grow our food, our fuel, and our shelter and surround us with bounty. Abuse it and the soil will collapse and die, taking man with it”. Deep in the heart of these primeval quotes lies the concern on the health of the very basic elements that contribute to the sustenance of complete chain involving production to consumption. For instance, if the vitality of natural resources is impaired because of neglect or misuse, agricultural sustainability and environmental quality and the linkage among these in the quest for human survival becomes at stake (Katyal). Indicators of Sustainability Indicators are a composite set of attributes or measures that embody a particular aspect of agriculture. Indicators are quantified information, which help to explain how things are changing over time. Sustainability indicators look at economic, social and environmental information in an integrated manner. Many professionals agree that at least three criteria should guide the development of sustainability indicators (Jeff Tschirley): (i) Policy relevance - indicators should address the issues of primary concern to a country or district and receive the highest priority. In some cases policy makers may already share concern about an aspect of sustainability (e.g. land degradation) and be ready to use indicator information for addressing the issue. (ii) Predictability - to allow a forward-looking perspective that can promote planning and decisions on issues before they become too severe. Anticipatory decision-making is at least as important to sustainable agriculture as is recognition of existing problems. (iii) Measurability - to allow planners and analysts the means to assess how the indicator was derived, either qualitatively or quantitatively, and decide how it can best be applied in the planning and decision-making process. Some of the indicators of key natural resources in rainfed cropping systems are listed below. 3
  • 4. Table 1: Indicators of Key Natural Resources in Rainfed Cropping Systems S. Indicators Key Management Aspects No. 1 Nutrient Balance Organic matter - rate of change Nitrogen cycling - especially when using grain legumes in rotation with cereals Monitoring status of phosphorus, sulphur and potassium Micro-nutrients 2 Erosion Vegetation cover - includes trees as well as stubble Soil surface cover - stubble retained (30% sufficient to prevent wind and water erosion) Stream bank Sheet and gully erosion 3 Productivity, Yield and Water use efficiency - i.e. actual versus potential (in some Quality areas the potential is much less than the actual) (biomass/grain yield/net return), recharge (dryland salinity and nutrient leaching) Pasture composition - legume and perennial Matched animal versus pasture production - appropriate enterprise selection/capability Maintenance of genetic base/improvement 4 Soil Structure Infiltration Permeability/water storage Stability Waterlogging Compaction 5 pH Change Toxicity - deficiency Indicator plants 6 Energy Efficiency Energy input vis-à-vis energy output of the whole agricultural system 7 Biological Factors Soil macro/micro flora and fauna Animal health Plant health (root growth and other) Pests (animals and plants) 8 Farm Management Skills Understanding - a good indicator would be the understanding of the farmers of their own technical system 9 Rainfall/Precipitation Performance of rainfall in a year as % of normal & its coefficient of variation; Distribution of area based on rainfall amount (dry: 0-750 mm, medium: 750-1150 & 1150-2000 mm, assured: > 2000 mm); Categorization of the amount of rainfall (excess: +20% or more, normal: +19% to -19%, deficient:20% to -59%, scanty: -60% or less); Number of districts having mean annual rainfall of 750-1250 mm and moisture availability period for at least 150 days; Area affected due to drought (slight, moderate or calamitous) 4
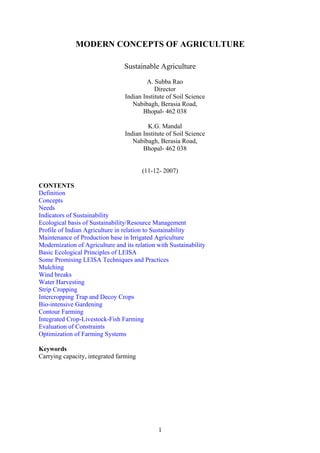
  • 5. The most widely accepted framework for sustainability is referred to as Pressure/State/Response (PSR framework), as described in the Table 2, and in the following flow diagram. Table 2: Example of PSR Framework Issue Pressure (driving State (resulting Response (mitigating force) condition) action) Soil erosion Hillside farming Declining yield Terracing, perennial cropping Water quality Agro-industrial Fish die-off Water treatment, processing technology adjustment Condition Livestock grazing Soil erosion Stock rotation, de- of grassland stocking revegetation Pressure State Human activities Resulting affecting the condition, e.g., system, e.g., Soil erosion & Hillside farming declining yield Response Mitigating action, e.g., terracing, strip cropping Fig. 1: The PSR framework for Sustainability Indicators (Source: FAO Research Extension and Training) Pressure refers to the driving forces that create environmental impacts. They could include hillside farming, agro-industrial processing, livestock grazing, deforestation, etc. State refers to the condition(s) that prevail when a pressure exists. This could be for example declining yields, fish die-off or soil erosion, etc. Response refers to the mitigation action(s) and levers that could be applied to reduce or eliminate the impacts. 5
  • 6. Ecological basis of Sustainability/ Resource Management The ecosystem provides services such as clean water, climate regulation and nutrient recycling, which make it possible for us to thrive. These ecosystem services are also the basis for agricultural production, which needs to continually increase, in order to feed the expanding global population. However, agriculture as practiced today also has negative impacts on the ecosystems. In the longer term, these negative impacts will reduce the efficiency of the ecosystem services that are needed to sustain agricultural production. This creates a fundamental conflict, and many farmers are already experiencing reduced yields as a result of declining soil fertility, increasing temperatures and less rainfall. Resolving the conflict between increasing agricultural production and maintaining biodiversity and ecosystem services is an enormous challenge (Meyer and Heffman, 1993). A farm can also be a complex, interwoven mesh of soils, plants, animals, implements, people and other inputs, operating within a specific environmental and social context. On such farms, the farmer, with the intimate knowledge of local conditions, plants and animals, tries to enhance the natural ecological processes and to manage the whole farm to provide a wide range of produce. Agroecology sees a farm as a complex system in which natural ecological processes are always at work. These processes involve the breakdown of organic matter, nutrient cycling, interactions between pests and beneficial insects, competition between different plant and/ or animal communities, symbiosis between fungi or bacteria and plants and successional changes (Gold, 1999). By combining farmers’ traditional knowledge with recent experiences of ecologically-sound agriculture and new approaches in agricultural sciences, it is possible to develop ecologically- sound agricultural systems which combine high and sustained production with maintenance of the environment and its ecosystem services. Ecological basis: The design of ecologically-sound, sustainable agricultural system is based on the application of ecological principles such as (LEISA, 2006): (i) Securing favourable soil conditions for plant growth by enhancing biological soil life through the management of soil, vegetation and organic matter; (ii) Optimizing the recycling of nutrients within the farm system and balancing nutrient availability and flows through the management of vegetation, animals and organic matter; (iii) Making optimal use of the biological and genetic potential of plant and animal species; (iv) Enhancing beneficial biological interactions and synergisms through the use of biodiversity and genetic resources by combining integrated systems with a high degree of functional diversity; (v) Minimizing losses from pests and diseases by enhancing the health and the self- regulating capacity of the farm system; and (vi) Maximizing the uptake of solar energy and minimizing the loss of water through management of microclimate, vegetation and water retention. These principles reflect the functions of natural ecosystems and can be used to provide general guidance for developing ecological farming systems. Each principle can be applied through a range of different techniques and strategies. Each of these techniques will have different effects on productivity, stability and resilience within the farm system and will have to be adapted to the specific circumstances of each farm as local opportunities and resource 6
  • 7. constraints differ from place to place. In this way biological efficiency can be optimized, the agro ecosystem remains productive and its self-sustaining capacity can be enhanced. Profile of Indian Agriculture in relation to Sustainability India occupies a strategic position in Asia, looking across the seas to Arabia and Africa on the west and to Burma, Malaysia and the Indonesian Archipelago on the east. Geographically, the Himalayan ranges keep India apart from the rest of Asia. A profile is listed in the following table. Table 3: A Profile of India S. Profile Description of Profile characteristics No. Parameter 1 Location Latitude 80 4' - 370 6' N, longitude 680 7' - 970 25' E. Southwest-Arabian Sea, southeast- the Bay of Bengal, north, northeast & northwest- the Himalayan ranges, southern tip of the Indian peninsula- Kanyakumari, south- the Indian Ocean. Andaman and Nicobar islands in the Bay of Bengal and Lakshadweep in the Arabian Sea are parts of India. 2 Area Total land area 3,287,263 sq km. 3 Extent North to south-3214 km, east to west- 2933 km, land frontier-15,200 km, coastline- 7516.5 km 4 Population 1081.23 million 4 Climate Mainly tropical or subtropical 5 Physiographic The mainland comprises 7 regions. Northern Mountains including the regions Himalayas and the North Eastern mountain ranges, The Indo Gangetic plain, The Desert, Central highlands and Peninsular plateau, East Coast, West Coast, Bordering seas and islands 6 Mountain The Himalayas, the Patkai and other ranges bordering India in the north and ranges north east, the Vindhyas, which separate the Indo Gangetic plain from the Deccan Plateau, the Satpura, the Aravalli, the Sahyadri, which covers the eastern fringe of the West Coast plains and the Eastern Ghats, irregularly scattered on the East Coast and forming the boundary of the East Coast plains. 7 Desert The Desert region- the great desert and the little desert. The great desert extends from the edge of the Rann of Kachchh beyond the Rajasthan-Sind Frontier runs through this. The little desert extends from the Luni between Jaisalmer and Jodhpur up to northern west. 8 Watersheds There are mainly three water-sheds. Himalayan range with its Karakoram branch in the north, Vindhyan and Satpura ranges in Central India, and Sahyadri or Western ghats on the West Coast. 9 Flora and 45,000 plant sp. 33% of which are native; 15,000 flowering plant sp, fauna accounting to 6% of the world's total flora. Out of these, about 3,000 to 4,000 are believed to be in danger of extinction. The fauna of India 5,000 species of larger animals. 10 Rivers Three groups: the great Himalayan rivers of the north (the Indus, the Ganga and the Brahmaputra), the westward-flowing rivers (the Narmada and Tapti), and the eastward-flowing rivers of the Deccan Plateau and the rest of peninsular India (Godavari, Krishna, Cauvery, Pennar, Mahanadi, Damodar, Sharavati, Netravati, Bharatapuzha, Periyar, Pamba). (Source: http://www.southasianmedia.net/profile/india) 7
  • 8. India's Natural Resources and Sustainability of Agriculture: Land, climate, and bio- inhabitants (human, animal and plant) constitute the natural wealth of any country. Land, the primary natural resource, includes soil, water bodies, vegetation, landscape and microclimate. India's geographical area is 328.73 million ha with a reporting area (for land utilization statistics) of 305.84 million ha (Table 4). Table 4: Land Utilization Pattern in India (2003-04) S. Land Use Pattern Area No. (million ha) 1 Geographical area 328.73 2 Reporting area for land utilization statistics 305.84 3 Classification of reporting area excluding fallow land- not available for cultivation a) Forests 69.70 b) Area put to non-agricultural uses 24.48 c) Barren & unculturable land 17.73 d) Total (= b+c) 42.22 4 Classification of reporting area excluding fallow land- other uncultivated land a) Permanent pastures and other grazing lands 10.45 b) Land under misc. tree crops & groves not included in net area sown 3.37 c) Culturable waste land 13.17 d) Total (= a+b+c) 26.99 5 Fallow land a) Fallow lands other than current fallows 11.24 b) Current fallows 14.80 c) Total (= a+b) 26.04 6 Net area sown 140.88 7 Area sown more than once 49.76 8 Total (gross) cropped area 190.64 9 Gross area irrigated 76.82 10 Net area irrigated 55.10 11 Area irrigated more than once (= 9-10) 21.71 12 Gross area under HYVs** 78.35 13 Share of gross irrigated to gross sown area (%) (= 9/8 x 100) 40.30 14 Cropping intensity (%) (= gross/net sown area x 100) 135.32 ** Data pertain to total area covered under HYVs of wheat, maize, bajra, jowar and paddy in the year 1998-99 (Source: Fertiliser Statistics (2005-06)) On the basis of sustainability issues, the reporting area may be classified into 3 broad sectors as follows (Table 5): Table 5: Reporting Area S. Broad sectors Land use characteristics Area No. (million ha) 1 Agricultural sector Net area (cultivated) sown, current fallows, 180.09 other fallows and culturable waste lands 2 Ecological sector Forests, miscellaneous tree crops and groves, 101.25 pasture and grazing, barren and unculturable lands 3 Non-agricultural sector Area put to non-agricultural uses 24.48 8
  • 9. Among these uses, the net sown area of about 141 million ha has remained almost constant over the last 35 years. Similarly, area under forests (not necessarily the forested area) is inflexible since 1972. On an overall basis, during the last three decades area under ecological sector has decreased significantly. Thus, agricultural area is non-expanding and at the same time there is shrinkage of area under ecological sector. There is unabated rise in area under non-agricultural sector also. The availability of land per capita is also decreased sharply from 0.48 ha in 1951 to 0.20 ha in 1981 and further decreased to 0.15 ha in 2000. Ideally, the policy aim of any Government should be to guide the land use pattern in such a way that it underpins the principle ‘Future life rests on meeting basic human needs without destroying these resources on which all life rests’. India shares only 2.4% of the world's geographical area, but supports around 16.7% of the world's population and over 17.2% of the world's livestock. Thus, there is immense pressure on India's land resources. The resultant overstraining of land resources by unproportional human and animal population is the cause of widespread land degradation and threat to sustainability of agro-ecosystem. Carrying Capacity: Carrying capacity is the number of individuals that can be supported in a given area, or the maximum population that can be sustained in a habitat without the degradation of the life support system Carrying capacity is the theoretical equilibrium population size at which a particular population in a particular environment will stabilize when its supply of resources remains constant. It can also be considered to be the maximum sustainable population size; the maximum size that can be supported indefinitely into the future without degrading the environment for future generations (Gold, 1999). The Earth's capacity to support people is determined both by natural constraints and by human choices concerning economics, environment, culture (including values and politics) and demography. Simple mathematical models of the relations between human population growth and human carrying capacity can account for faster-than-exponential population growth followed by a slowing population growth rate, as observed in recent human history. The distribution of operational holdings indicates that the number of holdings occupied by the marginal and small farmers is about 80% of the total holdings (Table 6), the number of holdings decreased towards greater size farms. Table 6: Distribution of Operational Holdings in India (1995-96) Category of holdings Number of Area operated by Average size of operational each category operational holdings (million ha) holdings (ha) (million) Marginal (< 1 ha) 71.18 (61.6) 28.12 (17.2) 0.40 Small (1-2 ha) 21.64 (18.7) 30.72 (18.8) 1.42 Semi-medium (2-4 ha) 14.26 (12.3) 38.95 (23.8) 2.73 Medium (4-10 ha) 7.09 (6.1) 41.39 (25.3) 5.84 Large (>10 ha) 1.40 (1.2) 24.16 (14.8) 17.21 All holdings 115.58 (100.0) 163.36 (100.0) 1.41 Figures in parentheses indicate the percentage of respective column totals (Source: Agricultural Statistics at a Glance (2004)) 9
  • 10. Land degradation: Degradation refers to reduced productivity of soils (and vegetation) compared to that what is attainable at a fixed level of non-land inputs. Land degradation is a principal factor inhibiting productivity and endangering sustainability of an agricultural system. Soil erosion is its principal puporter and soil cover viz., vegetation provides the shield. Current estimates on land degradation show that about 173.64 million ha (53% of the total geographical area) suffers from soil erosion, water logging, and other special problems for cultivation (Table 7). There is hardly any doubt on the massiveness of land degradation due to collective passivity of various public institutions on the one hand and splinter group activity by individual farmers on the other. Table 7: Distribution of estimated area under different soil erosion, land degradation and land utilization problems (estimated)* S. Categories of different problems Area No. (million ha) 1 Geographical area 328.73 2 Area subject to water and wind erosion 144.12 3 Area degraded through special problems 29.52 3.1 Water logged area 8.53 3.2 Alkali soils 3.88 3.3 Acid soils 4.50 3.4 Saline soils including coastal sandy areas 5.50 3.5 Ravines and gullies 3.97 3.6 Area subject to shifting cultivation 4.91 3.7 Riverine and torrents 2.73 Total (3.1 to 3.7) 34.02 4 Total problem area (2+3) 173.64 5 Total flood prone area 40.00 Annual average area affected by floods 8.00 Annual average cropped area affected by floods 3.70 Maximum area affected in the worst year 18.60 6 Total drought prone area 260.00 *Data pertain to land utilization statistics of 1981-82 and report till 1996-97 (Source: Fertilizer Statistics (2005-06)) Some of the impacts of land degradation are listed below: i. Declining yields ii. Need to use higher levels of inputs iii. Changes in land use pattern iv. Off-site effects (pollution of ground water, siltation of reservoirs) v. Loss of biodiversity vi. Environmental effects (loss of habitat due to devegetation) vii. Property damage Declining yield of crops is basically due to the decline in land quality on-site where degradation occurs, for example erosion and off-site where sediments are deposited. However, the on-site impacts of land degradation on productivity are easily masked due to use of additional inputs and adoption of improved technology. Nutrient depletion as a form of land degradation has a severe economic impact. There is invariably need to use higher inputs like fertilizers, because of land degradation, there is a 10
  • 11. decline in soil structure leading to crusting, compaction, erosion, desertification, creation of anaerobic condition due to water logging, environmental pollution, and unsustainable use of natural resources. In addition, the chemical degradation processes in soil leads to acidification, leaching, salinization, decrease in cation exchange capacity, and declining soil fertility. Even crop productivity of irrigated lands is severely threatened by build up of salt in the root zone. Impact of land degradation is remarkable because, in many severely degraded areas, biological processes are deteriorated. There is reduction in total and soil microbial biomass carbon, and eventual loss of biodiversity. This has important concerns related to eutrophication of surface water, contamination of groundwater, and emissions of CO2, CH4, N2O, from terrestrial as well as aquatic ecosystems. Severe land degradation affects a significant portion of the earth's arable lands, decreasing the wealth and economic development of nations. The economic impact of land degradation is severe in densely populated South Asia, and sub-Saharan Africa. The effects of land degradation have more significant impacts on receiving water courses (rivers, wetlands and lakes) since soil, along with nutrients and contaminants associated with soil, are delivered in large quantities to environments that respond detrimentally to their input. Land degradation therefore has potentially disastrous impacts on lakes and reservoirs that are designed to alleviate flooding, provide irrigation, and generate hydro-power. Degradation is also considered responsible for a change in the ground cover to less palatable species, or a change from predominantly perennial grasses to predominantly annual grasses. Environmental dilapidation is brought about by pollution especially in urban areas, which not only experience a rapid growth of population due to high fertility rates, low mortality and increasing rural to urban migration, but also due to the industrialization. Water resources: The sustainability in agriculture i.e., for crops/ cropping systems is primarily depends upon the availability of water in its optimum quantity and acceptable quality. Rainwater is the primary source to meet the demand of water. From rainfall, India annually receives a rainfall of 1085 mm (long-term average from 1950-1994). This rainfall is equivalent to roughly about 400 M hectare meter water (4000 billion cubic meters; one hectare meter of water weighs approximately 100 tonnes). Nearly three fourths (i.e., 799.6 mm) of the total rainfall received in India is through South-West monsoon activity (Table 8). Not even 3% of the total precipitation is contributed by North-Eastern monsoon. The remaining amount of rainfall comes via pre or post-monsoon activity. Table 8: Distribution of Annual Rainfall according to Seasons in India Rainfall Duration Amount % of annual (mm) Rainfall Pre-monsoon March-May 112.8 10.4 South-West monsoon June-September 799.6 73.7 Post-monsoon October-December 144.3 13.3 Winter or north-east monsoon January-February 28.2 2.6 Total 1085* 100.0 *Total annual rainfall = 1085 mm (long-term average, 1950 to 1994) 11
  • 12. Prevailing conditions and locational placement on or out of path of progressing monsoon play a significant part in deciding the regional disparities observed in rainfall distribution and availability. Employing average annual rainfall as the criteria, 30% of the area in the country receives less than 750 mm, 42% of the area gets between 750 and 1150 mm, and 20% of the India's earth has access to rainfall between 1150 and 2000 mm. It is only 8% of the land area, which secures more than 2000 mm rainwater annually. Thus 70% of the land area receives rainfall greater than 750 mm (Table 9). Table 9: Distribution of Area according to Annual Rainfall in India Rainfall amount Percentage of area receiving rainfall (approx.) Dry 0-750 mm 30 Medium 750-1150 mm 42 1150-2000 mm 20 Assured above 2000 mm 8 Total (1085 mm) 100 (Source: Fertiliser Statistics (2005-06)) The water resources potential of the country which occurs as natural run off from rainfall and snow melt into rivers and streams is about 186.9 M ha m as per the estimates of Central Water Commission (CWC), considering both surface and ground water as one system (Water Related Statistics 2006, CWC). The Ganga-Brahmaputra-Meghna system is the major contributor (59%) to total water resources potential of the country. Due to various constraints of topography, uneven distribution of resource over space and time, it has been estimated that only about 112.3 M ha m of total potential of 186.9 M ha m can be put to beneficial use, 69 M ha m being due to surface water resources and 43.3 M ha m due to ground water resources. Again about 40% of utilizable surface water resources are presently in Ganga-Brahmaputra- Meghna system. This 112.3 M ha m would be used for irrigation, domestic and industrial purposes. Thus, practically the water available for irrigation to agricultural crops will be inadequate. So enhancing the efficiency of water use is an important option; and if India has to remain self-reliant in her food needs, there is no choice except to save every drop of water and use it most prudently for sustainability in agriculture. Rainfed Areas: At present, nearly 60% of the agriculture is rainfed, which contributes a major portion of our food and supports a majority of the human population. About 30% of the country spread over 99 districts is drought-prone (ref., J.C. Katyal). In these districts, not only the agricultural sustainability is under threat because of critical water shortages, but also the region as a whole suffers chronically from serious drinking water crisis. In fact, there is uncertainty in rainwater availability, most of the years the onset, continuity, and withdrawal of monsoon is erratic. Any breakthrough in these drought-prone areas will primarily happen via rainwater conservation, as it is the most important aspect of overall agricultural management. The main objective should be to minimize runoff by encouraging its entry into the soil (in-situ water conservation) and capturing the water, which cannot penetrate into the soil. Run-off, amounting up to 40% of the total precipitation, is a typical feature of tropical monsoon, 12
  • 13. which tends to unleash in big storms. Runoff, when not harvested promotes unsustainable agriculture on two counts: (i) loss of precious rain water which otherwise could benefit withering crops, and (ii) busting of nutrient rich topsoil caused by erosion. Estimates on rainwater budgeting show that 24 m ha m equivalent runoff is available for harvesting in the donor areas of field level catchments (nested or micro watersheds). Capturing the runoff water and recycling it ensures stabilizing and sustaining the productivity of rainfed crops. Demographic compulsions, increasing food, fuel and fodder needs and achievement in agricultural productivity: Based upon the anticipated growth in population India's population is likely to stand at around 1329 million by 2020. This will happen despite the fall in annual compound growth rate from 2.14 in 1991 to 1.97 in 2001 (Fig. 1). Since the growth in population is exponential in nature, India's population will continue to dilate by an additional ~16 million people each year (ref., J.C. Katyal, data updated). Just to meet the requirements on food for this population alone (leave aside seed and feed needs), India will be required to produce additional 3.2 million t foods each year (1 t food is assumed to feed 5 persons for one year). In order to keep below the Malthusian cross (i.e. when population growth rates exceed the rate of food supply increases) it will be necessary to achieve at least 2 t food grain productivity/ha from rainfed areas and 4 t/ha from irrigated areas. Current food grain productivity of rainfed crops stands at less than about 1 t/ha and that of irrigated crops at about 2 t /ha. Thus, the traditional agricultural systems though sustainable at low levels of productivity, will not be able to measure up to the rates of growth that can neutralize the needs of burgeoning population. A proper mix of technological interventions, inputs, extension and infrastructure support will become increasingly important to ward off any food deficiencies to arise. 1100 1000 Rural 900 800 Urban 700 Total Population in million 600 500 400 300 200 100 0 1901 1911 1921 1931 1941 1951 1961 1971 1981 1991 2001 Census years Fig. 2. Population in India (Source: Fertiliser Statistics (2005-06), Agricultural Statistics at a Glance (2004)) GDP in Agriculture & Allied Sectors: Though the absolute values in GDP in agricultural and allied sectors are increasing (except in 2003-03, because of severe drought in 2002), the rate of growth is not attractive. It is highly volatile. Low and volatile growth rates in Indian agriculture and allied sectors are reflected in the average annual growth rate (Table 10). The overall GDP was low during the period 2000-2003, again it has gained its momentum. With a favourable monsoon, growth was an impressive 9.9 per cent in 2003-04. The contribution of agricultural & allied sectors to total GDP is decreasing every year. Of course, this is because 13
  • 14. of the fact that the rate of growth in service and other sectors are significantly higher that the rate of growth in agricultural sector. Table 10: Gross Domestic Product (GDP) and contribution of agricultural and allied sectors to total GDP in India GDP at current prices Year Total Overall GDP in Agric. GDP in Agric. Contribution of GDP GDP & allied & allied Agric & allied (Rs Growth sectors sectors sectors to total GDP crores) Rate (Rs crores) growth rate (%) - - 1993-94 781345 241967 31.0 1994-95 917058 17.4 278773 15.2 30.4 1995-96 1073271 17.0 303102 8.7 28.2 1996-97 1243547 15.9 362606 19.6 29.2 1997-98 1390148 11.8 387008 6.7 27.8 1998-99 1598127 15.0 442494 14.3 27.7 1999-2000 1761838 10.2 461964 4.4 26.2 2000-2001 1902998 8.0 468479 1.4 24.6 2001-2002 2090957 9.9 521907 11.4 25.0 2002-2003 2249493 7.6 509907 -2.3 22.7 2003-2004 2523872 12.2 560482 9.9 22.2 2004-2005P 2713162 7.5 616530 10.0 22.7 2005-2006Q 2957347 9.0 653522 6.0 22.1 A 2006-2007 3229423 9.2 671167 2.7 20.8 P Q A Provisional, Quick estimate, Advance estimate (Source: Economic Survey (2006-07)) Agricultural Production: Indian agriculture has witnessed a phenomenal increase in the agricultural production front. Compared to 50.83 million tonnes in 1950-51, India attained a food grain production of 208.31 million tonnes during 2005-06 (Fig. 3). Measured by the food grain availability criteria, per capita food availability has increased from 395 g/day in 1951 to 463 g/day in 2004. It is a vivid demonstration of the great big achievement because it has occurred against the backdrop of about three times rise in population during the same period (363.2 million in 1951 to 1085.6 in 2004) (ref., J.C. Katyal, data updated). The production of oilseeds has increased from a mere 5.16 million tones in 1950-51 to 27.73 million tones in 2005-06 (Fig. 4). During the year 2001, India ranks first in the world in production of milk, cattle, buffaloes, tea leaves, total pulses, jute and allied fibres; she ranks second in the world in production of rice, wheat, fruits and vegetables, groundnut, sugarcane, tobacco leaves and goat. However, declining land-man ratio happening in the wake of rising population is highly disquieting because it puts progressively more strain on the non- expandable assets, specifically land resources. 14
  • 15. Rice 225 Wheat 200 Coarse cereals Pulses 175 million tonnes Total food grains 150 125 100 75 50 25 0 1 3 5 7 9 1 3 5 7 9 1 3 5 7 9 1 3 5 7 9 1 3 5 7 9 1 3 5 -5 -5 -5 -5 -5 -6 -6 -6 -6 -6 -7 -7 -7 -7 -7 -8 -8 -8 -8 -8 -9 -9 -9 -9 -9 -0 -0 -0 50 52 54 56 58 60 62 64 66 68 70 72 74 76 78 80 82 84 86 88 90 92 94 96 98 00 02 04 19 19 19 19 19 19 19 19 19 19 19 19 19 19 19 19 19 19 19 19 19 19 19 19 19 20 20 20 Year Fig. 3: Food Grains Production in India (1950-51 to 2005-06) (Source: Fertilizer Statistics, 2005-06) 30 Groundnut 28 26 Rapeseed&mustard 24 Soybean 22 Total oilseeds million tonnes 20 18 16 14 12 10 8 6 4 2 0 19 51 19 54 19 57 19 60 19 63 19 6 19 69 19 72 19 5 19 78 19 81 19 84 19 87 19 90 19 93 19 96 20 9 20 02 5 -6 -7 -9 -0 - - - - - - - - - - - - - - - 50 53 56 59 62 65 68 71 74 77 80 83 86 89 92 95 98 01 04 19 Year Fig. 4: Oilseeds Production in India (1950-51 to 2005-06) (Years prior to 1969-70 relate to 5 oilseeds) (Source: Fertilizer Statistics, 2005-06) India's agricultural growth was triggered by massive public investments in agricultural research, education and extension, expansion in irrigated area, increase in agro-inputs (fertilizer, seeds, pesticides, etc), government policies and above all willing support of farmers in adopting improved technologies. Rise in the irrigation water availability has been the key factor promoting use of and response to all other agro-inputs. The irrigated area increased from 20 million ha in 1950 to 57 million ha in 2000-01. Fertilizer use has risen from 69.8 thousand tonnes (of NPK) to 18.4 million tonnes (a whopping rise of 266 times) in about 50 years. Fertilizer in the presence of irrigation and seeds of high yielding varieties has been the key input in ushering in the green revolution in India. However, at present, there is a falling response of cereal crops to fertilizers (NPK) (Table 11). This fall in response has largely been felt with rice and wheat. These together consume nearly 70% of the total 15
  • 16. fertilizers used in the country and are cultivated in well-endowed irrigated or assured rainfall areas. Table 11: Response to Fertilizer Application in Food Grains Production Period Food Increase in Fertilizer use Response** grains food grains Total Food Increase (kg/ production production grains* (million kg nutrient) (mt)) (mt) (mt) (mt) tones (mt) 1970-75 103.02 - 2.62 1.83 - - 1975-80 120.04 17.02 4.19 2.93 1.10 15.49 1980-85 138.07 18.03 6.78 4.75 1.81 9.94 1985-90 155.03 16.96 9.70 6.79 2.04 8.30 1990-95 180.00 24.97 12.67 8.87 2.08 12.01 1995-2000 197.11 17.11 15.85 11.10 2.23 7.69 2000-2005 198.85 1.74 17.07 11.95 0.85 2.04 *Assuming 70% of the fertilizers were used for food grains **Ignoring the effect of area expansion, irrigated area and the high yielding varieties (Up to 1990, calculations were made by Dr. D.R. Bhumbla) Along with unsustainable yields, nutrient imbalances encourage continuous build up of those nutrients that remain unutilized by growing crop plants. The left over nutrients are the principal cause of fertilizer use related environmental pollution. For instance: unutilized P can cause eutrophication of lakes and rivers, whereas unused N can lead to ground water pollution (as nitrate) or promote breakdown of protective ozone layer (as nitrous oxide) which shields earth against the harmful effects of ultraviolet radiation. It thus appears that the same factors (irrigation and fertilizer nutrients), which ushered in green revolution are being blamed to pull it down also. What is required is to emphasize integrated nutrient management (man made and native nutrient sources combined). This time tested strategy will assure balanced nutrition, sustainable yields and good soil health (Katyal). The sustainability of agriculture is ostensibly imperiled by the lack of adequate land management systems and inputs in the fragile and marginal environments like dryland regions. For example, rice, wheat and sugarcane - the three predominantly irrigated crops, usurp about 80% of the fertilizer - N used in the country. Share of fertilizer-N for sorghum, which is chiefly rainfed and ranks third after rice and wheat in area, does not exceed even 2% of the total consumption. Without intensification in fertilizer use along with organic manure, sustainable productivity from rainfed areas will remain a mirage (ref., J.C. Katyal). Animal Production, its carrying capacity and fodder needs: From the agricultural standpoint, India is endowed with very significant diversity among domesticated animals. These represent. some 26 breeds of cattle, 8 of buffaloes, 40 of sheep, 20 of goats, 8 of camels, 14 of horses and 18 of poultry. Another vital issue on sustenance of cattle wealth is related to their overflowing number. Thus, the rate of growth of animal production (including the total fish production) is remarkable (Fig. 5). The estimated population (year 2001) of cattle (220 million), buffaloes (94 million), camels, sheep, goats etc. is remarkable in the country compared to the world population. This animal population exceeds the carrying capacity of India's natural resources. According to one estimate, the ideal number of 16
  • 17. livestock, keeping in view the carrying capacity of land to support grazing, is only about 50 million heads, i.e., one-ninth of the current population. As a result of mismatch between the number of livestock and inability of natural resources to sustain them, sub-optimal nutrition is rampant. National Commission on Agriculture estimated that only 56% of the dry fodder and 27% of the green fodder requirement were being met (Katyal). The demand supply gap is likely to widen further in future. It is the poor availability of fodder which forces uncontrolled grazing, leading to diminished vegetative cover and accelerated degradation of land. In rain fed areas with possibility of double cropping farmers are constrained to take a post rainy season crop because of uncontrolled grazing. Clearly, improvement in forage production is an important strategy to increase animal productivity and saving natural resources from degradation. Milk, egg, wool and fish production in India 100 Milk (million tonnes) million tonnes/ billion nos/ million kg/ lakh 90 Eggs (billion nos) 80 Wool (million kg) Fish (lakh tonnes) 70 60 tonnes 50 40 30 20 10 0 19 19 19 19 19 19 19 19 19 19 19 19 19 19 19 19 19 19 19 19 19 19 19 20 20 20 20 50- 60- 70- 80- 81- 82- 83- 84- 85- 86- 87- 88- 89- 90- 91- 92- 93- 94- 95- 96- 97- 98- 99- 00- 01- 02- 03- 51 61 71 81 82 83 84 85 86 87 88 89 90 91 92 93 94 95 96 97 98 99 00 01 02 03 04 Year Fig.5: Production of Animal Products in India (Source: Fertilizer Statistics, 2005-06) Advances in agricultural production technology has considerably raised farm output but has created problems of land degradation, declining of soil organic carbon, pesticide residues in farm produce, degradation of genetic resource base, environmental pollution, climate change, shrinkage in water reservoir capacity, problems of water scarcity, water pollution etc. Emission of smoke and gases from industry and automobiles etc. increase CO2 content of the atmosphere. Effluents of the industry and mining are contaminating water bodies and are degrading the land. High dose of N- fertilizers in some areas are polluting water bodies with high level of nitrates. Pesticide residue in soil contaminates water bodies. The pace of agricultural activities hastens the process of degradation, denudation of forests, and loss of arable land, desertification and reduction of genetic diversity. The natural resource base is degraded and the quality of the environment sustaining human life is adversely affected. The remedial measures to combat these problems rely on the adoption of conservation farming techniques. The suitable measures include conservation of genetic resources, integrated nutrient management, efficient on-farm water management, participatory watershed management, integrated pest management, etc. The soil and water conservation measures should be adopted for successful conservation farming. The management of crop 17
  • 18. residues through conservation tillage (zero or minimum tillage), mulch farming rather than residue burning is encouraged. The recycling of farm waste (crop residues and animal dung, urine etc.) to the crop field should be practiced considering the farm as a self-sustaining system. The selection of efficient crop rotation is important for successful sustainable agriculture. Thus, the conservation farming approach and practices only will ensure long- term sustainability in the agricultural systems. Maintenance of Production Base in Irrigated Agriculture Compared to 1950, the net area under irrigation is increased by about three times. The net irrigated area of 52.96 million ha is distributed among canals (30.4%), tanks (5.1%), wells (20.7%), tube wells (37.3%) and others (6.5%) (Fertiliser Statistics 2005-06). While there is no doubt on the valuable contribution of irrigated area to ushering in of green revolution, it is the vast gap (~10 million ha) between the irrigation potential created (94.73 million ha) and utilized (84.7 million ha) by the end of 1999-200, which is quite disturbing. The Table 12 indicates the area covered under irrigation by the major crops in India. The actual potential of an irrigation project is diminished due to difficulties in reaching by gravity flow to high ground patches, changes in cropping pattern favouring high water requiring crops and the greedy use of water by the farmers at the top end of the distributaries. Unscrupulous use of canal water is the root cause of widespread poor water use efficiency, which produces side effects like water logging, soil salinity and alkalinity. As per the available data, the total area suffering from water logging is 8.53 million ha, while that affected by salinity and alkalinity is around 9 million ha. Compared to canal water, ground water is used more efficiently. With groundwater the problems are more of social nature. For instance, wealthy groundwater farmers continue to extract more water despite falling depth of water table. Unabated deepening of wells and withdrawals cause drying of open shallow wells which usually poorer farmers depends for irrigation. Table 12: Percentage Area covered under Irrigation for Principal Crops (2000-2001) S. Crops Area Percentage covered No. (million ha) under irrigation 1 Rice 44.71 53.6 2 Wheat 25.73 88.1 3 Maize 6.61 22.4 5 Jowar 9.86 7.9 6 Bajra 9.83 8.0 7 Total cereals 100.77 49.8 8 Gram 5.19 30.9 9 Arhar 3.63 4.2 10 Total pulses 20.35 12.5 11 Total foodgrains 121.05 43.4 12 Groundnut 6.56 17.6 13 Rapeseed&Mustard 4.48 66.1 14 Soybean 6.42 1.4 15 Total oilseeds 22.77 23.0 16 Cotton 8.53 34.3 17 Tobacco 0.26 52.8 18 Sugarcane 4.32 92.1 19 Total area under all crops 140.88 40.2 (Source: Agricultural Statistics at a Glance (2004), Fertilizer Statistics (2005-06)) 18
  • 19. In the tracts where ground water recharge is limited, it is the sustainability of agriculture, which becomes at stake. Deepening of water tables in the areas where less rainwater is captured than necessary to off set the withdrawals is likely to lead ultimately to permanent water deficit situation. Further, overdraft of ground water aggravates surfacing of harmful fluorides and salts. To reverse the situation, apparently the priority area of activity is to rationalize ground water withdrawals. More important than that from the sustainable agriculture point of view is the maximization of the ground water recharge through appropriate but farmer supported interventions favouring minimization of runoff water. This is reiterating the point made earlier on reining the rainwater if agriculture in India has to remain sustainable. Thus, in the green revolution areas/ irrigated areas it is the prosperity and overuse of inputs, which threaten sustainability; while in marginal and fragile environments it is the poverty and over-exploitation, which endanger sustainability. Modernization of Agriculture and its relation with Sustainability The Low External Input Sustainable Agriculture (LEISA) relies mostly on the inputs from the local farm, village or region and deliberate action is taken to ensure sustainability. The principles are: i) Securing favourable soil conditions for plant growth particularly managing organic matter and enhancing soil life, ii) Optimizing the nutrient availability and balancing the nutrient flow, particularly by means of nitrogen fixation, nutrient acquisition and complementary use of external fertilizers, iii) Minimizing the losses due to plant and animal pests by means of prevention and safety treatment, iv) Minimizing losses due to flows of solar radiation, air, water by way of microclimate management, water management and erosion control. In the High External Input Agriculture (HEIA), production for the far off markets necessitated use of external inputs like chemical fertilizers, hybrid seeds, pesticides, irrigation etc. Increased dependency on high cost external inputs in agriculture also made farmers to depend on external credit on a regular basis. Cultivation of cash crops like cotton and tobacco, also led to scarcity of fodder. This resulted in farmers giving up animal husbandry, thereby resulting in acute scarcity of farmyard manure and making the use of chemical fertilizers inevitable. Adoptions of modern technologies in agriculture like tractors and pump sets have resulted in the neglect of draught animals. Even the livestock production has been totally changed into industrial type of production from backyard system. Animals provide manure, food and income and are used for cultivation and transport economically. Different animals can be fed on farm wastes efficiently, which provide financial security at the time of distress. In Indian culture, cattle are treated as an integral part of the family. After undergoing the huge loses from adapting crossbred cows like Holstein, Frisien and Jersey, farmers are fast changing towards indigenous cattle, since their maintenance is cheaper and the male calves can be used for cultivation and transport. Agriculture in India, was an integrated cultivation of crops, animals and trees to meet most of the family and community needs rather than market. Trees played an important role in 19
  • 20. providing green manure, fodder, fruits, fuel and timber besides conserving soil water and hosting beneficial insects and birds. Now, it is necessary to revive the traditional knowledge on seed selection and preservation to bring back the self-reliance and seed availability at the time of sowing. Similarly, rural population is fast changing their medical treatments since synthetic drugs have become more expensive and found to create side effects. They now started growing medicinal plants like Neem, Aswagandha, Asparagus, Aloevera, Adathoda etc., for medication of both humans and their livestock. The Government’s concern of impending scarcity of fossil fuel resources is an encouraging factor for promotion of ecological agriculture. However, the fear of lower food production and availability of biomass is coming in the way of progressing towards organic farming. The goal of LEISA, therefore, should be based on economic interests by popularizing production of seeds, vermicompost, botanical pesticides etc. LEIA vis-à-vis HEIA: A brief account of LEIA vis-à-vis HEIA is presented in Table 13. Table 13: LEIA vis-à-vis HEIA S. Characteristics of HEIA Characteristics of LEIA No. 1 The farming pattern depends heavily on LEIA relies on the optimal use of natural external and chemical inputs. processes. Although yields have increased substantially, contributing to raising total production, farmers and the environment have had to pay the price for keeping up with this development. 2 The focus of agricultural development The focus is on the sustainability of farming and research has mainly been on system maximizing yields coupled with increasing specialization of production 3 There is a great damage to the Environmentally sound and that have the environment potential to contribute to the long-term sustainability of agriculture. 4 The continuing drop in prices of farm Greater emphasis is on the long-term produce and the rising costs of sustenance and balance between the profit and agricultural inputs have made farming livelihood. increasingly unprofitable 5 HEIA depends on the higher production Sustainable ecological practices depend largely and profit, without consideration of the on local agro-ecological conditions and on local local needs and local market socio-economic circumstances, as well as on farmers’ individual needs and aspirations. 6 Primarily one or two commodity driven One way of LEIA is to diversification of farms; development, lack of diversity in the with a range of crops and/or animals, farmers farming practices, as a result, there is will suffer less from price fluctuations or drops greater risk of failure and price in yield of single crops. Maintaining diversity fluctuation. The number of products and will also provide a farm family with a range of commodities are very minimum. products to eat or sell throughout a large part of the year. 20
  • 21. 7 Under HEIA system, soil quality LEIA maintains a healthy soil, recycling deteriorates, and there is resurgence of nutrients on the farm, and utilizing approaches pests, lack of resilience in the soil-plant such as integrated pest management (IPM). system 8 In HEIA, there is lack of use of Best bet technologies, for example, soil and indigenous technologies. water conservation (terraces, ditches, and vegetation strips on sloping land), better timing of operations, improved crop spacing and densities, manure or compost and water application based on local conditions. Conventional vis-à-vis Organic Farming for Sustainability: Escalating production costs, heavy reliance on non-renewable resources, reduced biodiversity, water contamination, chemical residues in food, soil degradation and health risks to farm workers handling pesticides all bring into question the sustainability of conventional farming systems. It has been reported, however, that organic farming systems are less efficient, pose greater health risks and produce half the yields of conventional farming systems. Nevertheless, the importance is fastest growing in favour of organic farming in selected crops and agro ecological conditions. Organic management practices should be made popular which are combined with traditional conservation-minded farming methods with modern farming technologies but conventional inputs such as synthetic pesticides and fertilizers are excluded, instead greater emphasis on building up the soil fertility with compost additions and animal and green manures, controlling pests naturally, rotating crops and diversifying crops and livestock. Just because a system is organic or integrated does not ensure its sustainability; nor does sustainability readily lend itself to quantification. To be sustainable, a farm must produce adequate yields of high quality, be profitable, protect the environment, conserve resources and be socially responsible in the long run. But under conventional economic systems, market and social forces can change the viability of a production system independent of its environmental sustainability. However, ecological and economic systems should be linked so that sustainable land management is a prerequisite for economic sustainability. Basic Ecological Principles of LEISA (i)A living soil: Soil can be regarded as a non-renewable resource, as soil formation is such a slow process. The soil provides a medium to anchor plant roots, but is also a very complex ecosystem. A productive agricultural soil is full of life, with millions of microorganisms which all interact chemically and physically with their soil environment. These processes regulate the release of nutrients from minerals and organic matter to feed the plants. A living soil has a better structure and can absorb and retain more water and air than a sterile soil. Sound ecological production therefore begins with improving the soil. Good practices, which can help improve the condition of the soil, are (LEISA, 2006): (i) Growing legumes to fix nitrogen from the air and provide it to the following crop, (ii) Feeding the soil with as much organic matter as possible through green manure, compost, cover crops, returning of non-toxic organic wastes and agroforestry; (iii) Keeping the soil covered at all times with mulch or cover crops 21
  • 22. (iv) No or reduced tillage which enhances water availability and soil conservation, (v) Cultivating a range of crops and animals to reduce risks of disease and pest outbreaks, maintain a balanced nutrient supply and provide resilience; (vi) Planting trees on contours or making terraces to prevent soil erosion by wind or water. (ii) Biological diversity: The diversity of different species of plants and animals, and the genetic variation within each species, provides the vital resource of biological diversity, which enables life on earth. Healthy ecosystems are relatively stable and the diversity they contain enables them to adapt to changing circumstances. For many small-scale farmers the available agrobiodiversity is the basis of survival. A mix of different locally adapted crops and animals and different varieties of the same increases on- farm diversity, increasing the chances of producing something even under adverse conditions. These principles of traditional farming can be further developed and used systematically in ecological farming. Some examples of such practices are (LEISA, 2006): (i) Intercropping in time and space: planting different crops together in different combinations or formations, or in sequence, can optimize the use of available resources and reduce the pressure of pests. (ii) Different plant species can also be used to support the ecological functioning of the whole farm system: examples are trees or bushes for windbreaks, flowering plants which provide food and habitat for beneficial insects that help control pests, shade trees for light-sensitive plants, trees to provide green manure and fuel wood. (iii) Integration of different crops or weeds with animals to better utilizes resources, for example fish in rice fields, integrated crop-chicken-fish systems and other combinations of crops and animals. (iii)Water: Growing populations, rapid urbanization and increasing industrial and agricultural production are all increasing competition for and pressure on water. As agriculture is one of the major users of water, and one of the major polluters of water resources, it is imperative that water use in agriculture is as efficient as possible and that leaching of surplus nutrients and in small scale farming it is important to make the best possible use of the limited amounts of available water. Infiltration can be improved by keeping the soil covered, through minimum disturbance of the soil, adding organic matter from cover crops and mulching. When introduced, water-harvesting systems are generally multi-purpose. Farm ponds, earth dams and sub-surface tanks will often serve as a source of drinking water and water for livestock during periods of water scarcity. Water harvesting can open up new livelihood options. Subsistence farmers, who invest in water harvesting systems with a storage component, often diversify their farming system to include cash crop production, for the local market during off-season when prices are high. This diversification increases the resilience of farm households, as they are better equipped to cope with periods of climatic hazards such as droughts and floods. (iv) Energy: Solar energy is captured by plants that are able to transform it into biomass. This is the basis for all higher life forms, animals as well as humans, and is a process that is unique for green plants. Biomass contains stored energy as well as nutrients, and agriculture 22
  • 23. should focus on maximizing the amount of solar energy, which is captured and transformed into plant growth and thereby food and fodder resources. But additional energy is required for cooking and heating and is useful for irrigation, threshing and processing. Fortunately there are many opportunities to make use of renewable energy, most frequently fuel wood, straw, crop residues and even manure are used. There are also other possibilities to make use of renewable energy: small scale bio-digesters which use manure, solar energy devices, small scale hydropower generators, wind-power and wood lots for fuel wood. (v) Exploiting Animal-Plant Interaction: In nature, nothing functions in isolation; everything depends on the other factors present. In animal production, to optimize the performance of cattle, it is very important that management practices should enhance the ecological functioning of the web of living organisms within the production system - climate, soil and soil life, vegetation and cattle - by influencing their interactions. For cattle production, it is important that the breed is selected first, then the pasture suited to that breed and finally the soil is corrected with proper fertilizer or amendment (if needed) to make the pasture grow. This order has to be reversed. The pasture has to be adapted to the soil and the cattle to the pasture, and all of it has to fit the climate. In addition, the forage crops are to be grown. Of course, in dry areas, forage yields depend strongly on the availability of water. In a well-structured soil, roots are able to explore a larger soil volume for more water and nutrients. Integrating deep-rooting crops and trees into the pasture system will further increase the production of biomass and the overall performance of the system (LEISA, 2006). In native grassland, cattle always first eat the plants it likes most. The plants that are not eaten get old, hard and are not tasty. The eaten plants sprout again and are grazed on another time. This goes on until these palatable plants disappear. But the less appreciated plants continue to grow and multiply and with time the entire pasture gets hard, rough and has little nutritive value. Then the ranchers set fire to the pasture. Many plants die, and only those that can protect their growing points against fire survive. Thus the pasture becomes worse and the forage volume smaller. Thus all organic matter that nourishes soil microorganisms is burned out, resulting in their death. The soil compacts, water runs off and the vegetation gets scantier. Thus, the division of pastures into smaller sub-units for grazing rotation is fundamental for sustainability of pasturelands. However, to prevent ‘global climate change’ by ‘greenhouse gases’, it is important to reduce methane emission by cattle. This obliges farmers to speed up animal production per unit area and to reduce the slaughter age to get a lower ratio of kg methane/kg animal protein (meat). The use of grains for animal feed has to be reduced as well, giving priority to human consumption. This then increases the dependence on forage. But, as grass cellulose is the main source of methane emission, management practices that contribute to an increase of forage yield per unit area and maintain stocking rate without weight losses, all year long, are needed. (vi) Towards Local Resources-based Integrated Crop- Livestock Systems: The present livestock production systems in most industrialized countries are in direct competition with human needs. Livestock presently consume almost 50% of world cereal grain supplies. In the intensive large-scale production systems, increasingly promoted by corporate agriculture, livestock wastes contaminate soil and water resources, create less than favourable working conditions for the personnel involved in feeding and cleaning, and decrease employment 23
  • 24. opportunities. To meet food needs in 2050, it is necessary to develop livestock production systems, which do not depend on cereal grain. In developing countries like India, instead of grain-based livestock systems, alternative production systems must be developed which make optimal use of locally available resources. Close integration of livestock in the farming system, with recycling of all excreta, will be the basis of agriculture, which can be highly productive and also sustainable. In tropical countries, especially in the humid zone, there are many crops and farming systems that considerably exceed the productive capacity of grain cereals. Key plants in this scenario are sugar cane, cassava, and the palm family, especially the oil and sugar palms. The yield potential of the sugar palm (Borassus flabellifer) is extremely impressive. An annual average yield equivalent to 18 tonnes of soluble sugars per hectare has been documented in a study with 12 family farm households in Cambodia. Some Promising LEISA Techniques and Practices (i) Nutrient management: Nutrient management is managing the amount, source, placement, form, and timing of the application of nutrients and soil amendments to ensure adequate soil fertility for plant production and to minimize the potential for environmental degradation, particularly water quality impairment. Nutrient management has taken on new connotations in recent times. Soil fertility traditionally dealt with supplying and managing nutrients to meet crop production requirements, focusing on optimization of agronomic production and economic returns to crop production (LEISA, 2006). Contemporary nutrient management deals with these same production concerns, but recognizes that ways of farming must now balance the limits of soil and crop nutrient use with the demands of intensive animal production. Farmers in the hill agriculture follow a system of close integration of crop, livestock and forestry/grassland management. Farmers maintain traditional practices such as terracing, manure management, legumes inter cropping, and mulching where appropriate. Farm yard manure quality can be increased by better decomposition and the N-content can be increased by at least 2 to 3 times from about 0.5% N to 1.5% N through proper management of urine and manure. Liquid manure can be prepared from urine and various plants extracts rich in minerals or secondary plant compounds. These “manure teas” were shown to be effective liquid fertilizers on crops such as vegetables and also for organic pest and disease management. Local marketing systems for such “manure teas” are emerging in some areas. The use of urea fertilizer declined in several areas due to liquid manure use. In Nepal, some of the LEISA practices are: Bio-pesticide (cow urine, neem products, tobacco, ash etc), composting (pit), tree plantation, green manuring, vermicomposting, liquid compost, NADEP compost, seed treatment, seed production. (ii) Integrated pest management (IPM): IPM is an ecologically based approach to pest (animal and weed) control that utilizes a multi-disciplinary knowledge of crop/pest relationships, establishment of acceptable economic thresholds for pest populations and constant field monitoring for potential problems. Management may include such practices as (LEISA, 2006): • use of resistant varieties; 24
  • 25. crop rotation; • cultural practices; • optimal use of biological control organisms; • certified seed; • protective seed treatments; • disease-free transplants or rootstock; • timeliness of crop cultivation; • improved timing of pesticide applications; • removal or 'plow down' of infested plant material." The term biointensive IPM emphasizes a range of preventive tactics and biological controls to keep pest population within acceptable limits. Reduced risk pesticides are used if other tactics have not been adequately effective, as a last resort and with care to minimize risks. Biological control is, generally, man's use of a specially chosen living organism to control a particular pest. This chosen organism might be a predator, parasite, or disease, which will attack the harmful insect. A complete biological control program may range from choosing a pesticide which will be least harmful to beneficial insects, to raising and releasing one insect to have it attack another, almost like a 'living insecticide.'" (iii) Crop Residue Management and Conservation Tillage: Conservation tillage is a term that covers a broad range of soil management systems that leave residue cover on the soil surface, substantially reducing the effects of soil erosion from wind and water. These practices minimize nutrient loss, decreased water storage capacity, crop damage, and improve soil quality. The soil is left undisturbed from harvest to planting except for nutrient amendment. Weed control is accomplished primarily with herbicides, limited cultivation, and, in more sustainable systems, with cover crops. The National Crop Residue Management Survey (Conservation Technology Information Center (CTIC)) specifies that 30 percent or more of crop residue must be left after planting to qualify as a conservation tillage system. Some specific types of conservation tillage are Minimum Tillage, Zone Tillage, No-till, Ridge-till, Mulch-till, Reduced-till, Strip-till, Rotational Tillage and Crop Residue Management. (iv) Converting Farm Wastes into useful Organic Manure under LEISA System: The ingredients required are green leaves, dry leaves, weeds from adjacent farms, cow dung and urine, fodder wastes from cattle sheds, gobar gas slurry, coir pith, tank silt, quarry dust and rock phosphate. These items are put in alternate layers (cow dung in between layers) in a heap and left for 45 days. The heap is turned once or twice. In 45 days, the items get semi- decomposed. The partially decomposed material can be used in two ways- for vermi compost preparation, which gets converted to vermi compost in 45 days, and the other way is to add coir pith, tank silt and quarry dust to semi decomposed material, which turns into good quality manure in 45 days. (v) Green Manuring and Cover Crops: Green manure and cover crop species should fit the agroecological condition. In general, these crops should have the characteristics as: easy establishment, vigorous growth under local conditions, ability to cover weeds quickly, ability to either fix atmospheric nitrogen or concentrate plenty of phosphorus, should also have multiple uses. 25
  • 26. The green manure and cover crops can be grown intercropped with another food for example beans with maize or cassava, or perennial peanut with coffee. These crops can be grown on wasteland or on fields under fallow. The species should survive on very poor soils, such as beans, tephrosia, or particularly hardy trees. Farmers in Vietnam, for example, seed Tephrosia candida into their first year fallow, thereby reducing the normal five-year fallow to just one or two years. These crops can be grown during the dry season, planted after the normal crops like the rice bean/ rice system in Vietnam, or intercropped with the normal crop and then allowed to grow through the dry season such as the sweet clover/maize system in Mexico. It can also be planted as a relay crop amongst rainy season crops at the end of the wet season to take advantage of the residual moisture, such as the cowpea/maize and lablab/maize systems in Thailand. Green manuring adds organic matter to the soil; green manure crops return to the upper top soil the plant nutrients taken up by the crop from deeper layers; improves the soil structure and other soil physical properties; leguminous crops add nitrogen to soil; increases the availability of certain plant nutrients like P, K, Ca, K, Mg and Fe; facilitates infiltration of water thus decreasing runoff and soil erosion; green manure crops hold plant nutrients that would otherwise be lost by leaching. The main problem in adoption of green manuring is that the land on which green manure crop is raised could have been profitably utilized for growing a crop of economic importance. Another problem is adequate soil moisture either through rainfall or irrigation is essential for in-situ decomposition of green manure crop. Under rainfed condition, if sufficient rainfall is not received proper decomposition may not take place, and the germination of the succeeding crop is hampered. There is a possibility of incidence of diseases and pests, even nematodes. (vi) Practices for Land Degradation: A good plant cover is very important for preventing soil degradation and achieving soil rehabilitation. A vegetative cover has a number of beneficial effects on soil aeration, soil moisture and organic matter content, physical characteristics and biological activity in the soil. In addition, a plant cover protects against soil erosion. Cover crops can be quite aggressive creepers and may compete with the main crop. On the other hand if leguminous plants are used as cover crops they add nutrients because they fix atmospheric nitrogen and make it available for the crop. Selection of crops is very important while dealing with degraded soils. Sodic soils in South Indian region were corrected for their soil pH by including cucumber in the cropping pattern. Similarly, raising Eucalyptus plantation along the canal bunds helped in solving the drainage problem in low-lying delta areas. Farmers follow their own traditional practices in maintaining soil physical structure and health. Practices like application of sand, groundnut shell, sal leaves, retention of sunflower stalks are a few among those followed by the farmers for mulching in South Indian condition. (vii) Intercropping: Intercropping is defined as growing of two or more crops simultaneously on the same piece of land; crop diversification is in both temporal and spatial dimension; there is intercrop competition during all or part of the crop growth. There are many types of intercropping viz., mixed intercropping, row intercropping, strip intercropping and relay intercropping. 26