Más contenido relacionado
La actualidad más candente (19)
Similar a Brainstorming (20)
Brainstorming
- 1. Tools
©2005 Joe Tidd, John Bessant, Keith Pavitt
www.wileyeurope.com/college/tidd
1
Continuous Improvement: Specific Techniques
CI involves an extended journey, gradually building up skills and capabilities within the
organisation to find and solve problems. Not surprisingly there are many different
techniques which can help enable the process, and for a full account of them you should look
at the further information sources. What follows here are some brief explanations of basic
tools.
Specifically we will look at:
• problem-solving cycle;
• brainstorming;
• cause and effect diagrams;
• checksheets;
• flow diagrams;
• and an outline of policy deployment.
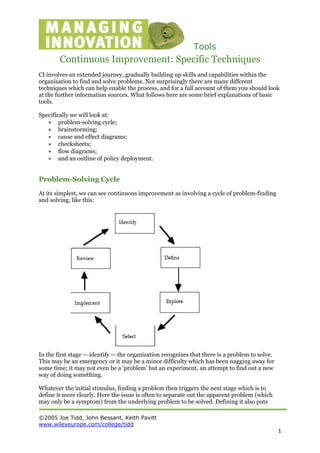
Problem-Solving Cycle
At its simplest, we can see continuous improvement as involving a cycle of problem-finding
and solving, like this:
In the first stage — identify — the organization recognizes that there is a problem to solve.
This may be an emergency or it may be a minor difficulty which has been nagging away for
some time; it may not even be a ‘problem’ but an experiment, an attempt to find out a new
way of doing something.
Whatever the initial stimulus, finding a problem then triggers the next stage which is to
define it more clearly. Here the issue is often to separate out the apparent problem (which
may only be a symptom) from the underlying problem to be solved. Defining it also puts
- 2. Tools
©2005 Joe Tidd, John Bessant, Keith Pavitt
www.wileyeurope.com/college/tidd
2
some boundaries around the problem; it may be necessary to break a big problem down into
smaller sub-problems which can be tackled — ‘eating the elephant a spoonful at a time’. It
can also clarify who ‘owns’ the problem — and thus who ought to be involved in its solution,
if the solution is to stick for the longer-term.
Having analysed the nature of the problem, the next stage is to explore ways of solving it.
There may be a single correct answer, as in crossword puzzles or simple arithmetic — but it is
much more likely to be an open-ended problem for which there may be a number of possible
solutions. The challenge at this stage is to explore as widely as possible — perhaps through
the use of brainstorming or other group tools — to generate as many potential solutions as
possible.
Next comes the selection of the most promising solutions to try out — essentially the reverse
of the previous stage since this involves trying to close down and focus from a wide range of
options. The selected option is then put into practice — and the results, successful or
otherwise, reviewed. On the basis of this evaluation, the problem may be solved, or it may
need another trip around the loop. It may even be the case that solving one problem brings
another to light.
In terms of learning, this is essentially a model for experimenting and evaluating. We gain
knowledge at various steps in the process — for example, about the boundaries of the
problem in defining it, or about potential solutions in exploring it or about what works and
what doesn’t work in implementing it. The point is that if we capture this learning it puts us
in a much better position to meet the next problem; if it is a repeat, we already know how to
solve it. If it is similar, we have a set of possible solutions which would be worth trying. And
if it is completely new, we still have the experience of a structured approach to problem
solving.
Brainstorming
Brainstorming is the rapid pooling of all and any ideas that a group of people can come up
with before any discussion or judgement takes place. Every idea is recorded no matter how
bizarre or irrational.
How to Brainstorm
1. Keep a relaxed atmosphere. Meetings should be disciplined but informal. If possible,
choose an informal venue.
2. Get the right size of team. The technique seems to work best with groups of 5 to 7
people.
3. Choose a leader. The leader checks that everyone understands what is going on and
why.
4. Define the problem clearly.
5. Generate as many ideas as possible.
6. Do not allow any evaluation and discussion.
7. Give everyone equal opportunity to contribute.
8. Write down EVERY idea — clearly and where everyone can see them.
9. When all the ideas are listed, review them for clarification, making sure everyone
understands each item. At this point you can eliminate duplications and remove ideas
the group feels are no longer appropriate.
- 3. Tools
©2005 Joe Tidd, John Bessant, Keith Pavitt
www.wileyeurope.com/college/tidd
3
10.Allow ideas to incubate. Brainstorm in sessions with perhaps a few days in between.
This gives time for the team to let the ideas turn over in their mind, which often
results in new ideas at a later session.
Approaches to Brainstorming
One-at-a-time
A member of the group offers one idea and the session continues this way until everyone
has had a chance to add to the list.
Open Door or Freewheeling
Anyone who has a contribution speaks whenever he or she wants.
Write-it down
Ideas are written down rather than stated out loud, but everyone must be able to see
each idea listed.
Cause and effect diagram
Also called the ‘Fishbone Diagram’, this participatory exercise explores the links between
the effects and the possible causes of an issue. This tool encourages a group setting for
problem —solving and demonstrates that problems can have a number of causes.
What is it?
Cause and effect analysis is a technique for identifying the possible causes of a problem
or effect. The technique uses a Cause and Effect Diagram to record the possible causes as
they are suggested.
When should you use it?
Use this tool when you want to establish the cause of an effect. The effect may be either a
problem or a desirable effect — when something desirable has happened it is useful to
find out what caused it so you can make it happen again.
Constructing a Cause and Effect Diagram
1. Establish what the problem, or effect, is. It must be stated in clear and concise terms,
agreed by everyone.
2. Write the effect (problem) in a box on the right and draw a long line pointing to the
box.
3. Decide the major categories of causes. This may be done in several ways:
• Brainstorming.
• Using standard categories such as the 4Ms (Machines, Materials, Methods,
Manpower) or PEMPEM (Plant, Equipment, Materials, People, Environment,
Methods).
• When the effect results from a recognisable process or set of activities, the
major steps in the process can be used.
4. Write the major categories in boxes parallel to, and some distance from, the main
line. Connect them to the main line with slanting arrows.
5. Brainstorm for possible causes.
• Add the causes to the diagram clustered around the major causes they
influence. Divide and sub-divide the causes to show how they interact, and
- 4. Tools
©2005 Joe Tidd, John Bessant, Keith Pavitt
www.wileyeurope.com/college/tidd
4
draw links between causes that are related. If the diagram becomes too
crowded, move one or more categories to a new sheet of paper.
6. Evaluate and analyse the possible causes.
7. Decide and act.
• This will probably involve using other tools. For example, in order to verify
some of the possible causes identified you may need to collect data (using
checksheets) and analyse it (Pareto Analysis, graphs, etc.).
Example of a cause and effect diagram
Checksheets
What is it?
A Checksheet is a tool for recording and organising data.
There are three kinds of Checksheets:
1. Recording Checksheet :
• Counts how many times something happens in pre-specified categories
2. Checklist Checksheet:
• A list of items to be addressed in some predetermined manner e.g. an
inspection sequence that prevents steps or procedures from being left out.
3. Location Checksheet:
• Records the relative or specific locations of defects, injuries, accidents etc …
Usually it is a picture or map of the item/area under consideration on which
the location of the defect etc. is marked with a dot or a cross.
Why use it?
Checksheets will help you to gather and classify data. Checksheets ensures that everyone
collects comparable data in the same form, and in a format that allows easy analysis.
Constructing a Checksheet
1. Decide what data you need to collect.
2. Decide how often the events will be observed (the frequency) and over what total
period (the duration).
3. Design a draft Checksheet. Put the items to be monitored on the left and the time
periods across the top. Allow space for totals on the right for each item being
observed and along the bottom for the observation periods. Label the Checksheets
clearly.
- 5. Tools
©2005 Joe Tidd, John Bessant, Keith Pavitt
www.wileyeurope.com/college/tidd
5
4. Test the draft Checksheet by getting someone who did not help design it to use it.
5. Make any revisions that are necessary as a result of step 4.
6. Distribute the Checksheets to the people collecting the data and explain how to use
them.
7. Act on the data collected.
Flow Charting
What is it?
A flowchart is a diagram illustrating the activities in a process.
Why use it?
A flowchart can tell you a lot about a process and the activities involved eg Are all the
activities really necessary? What controls are in place?
Flowcharts are a useful tool to use when improving a process, especially when you are
planning to collect data or to implement a solution. They can also be used to document a new
process or to compare an existing process with an ‘ideal’ process.
Flowcharts are a good communication tool — by using standard symbols everyone will have
the same understanding of the process.
Constructing a flowchart
1. Decide what level of detail the flowchart is to represent.
This will depend on the purpose for constructing the flowchart. On a higher level
flowchart several tasks which make up an activity will be shown as one activity
whereas on a lower level flowchart each task will be shown separately.
2. List the activities in the process.
3. Draw the flowchart (sometimes this is done using standard symbols — for example:
Stretched circle Start or end of process
Rectangle Step or activity in the process
Diamond Decision point
Arrow Direction of flow
This flow chart looks at the process of servicing a car:
- 6. Tools
©2005 Joe Tidd, John Bessant, Keith Pavitt
www.wileyeurope.com/college/tidd
6
Policy deployment
As the name suggests the basic concept in policy deployment is the development of
mechanisms for breaking overall strategic objectives of the business down into small units,
each of which can provide the target for groups or individuals in their CI activities over a
sustained period. For example, in Nissan Cars the overall strategic target is cascaded down
through the organisation via the appraisal process, where everyone has the chance to discuss
and agree to certain objectives over the coming year, including a range of targets for their
own CI activities. This process — which is essentially ‘management by objectives’ — is a two-
way one but the outcome is agreed targets and a commitment on the part of the employee to
achieving them, a recognition that this is what will be used to assess performance over the
coming year, and an understanding that achievement will be related to rewards.
Its value in CI is to provide a focus and targeting process which moves on from simply
improving things on a project by project basis. In policy deployment targets are linked to
strategic objectives and local activities mesh together to contribute to meeting these. For
example, if the overall target includes an objective to become competitive by reducing
customer lead-time by 25%, then policy deployment would ask, for each area, how they
could cut 25% of time out of their overall operations. In turn this would cascade down to
the individual units within the area, and down to the individual teams, with the same
question. Each individual team will then use CI tools to explore the sources of wasted
time, and the kinds of thing which might cut it down — and on a project by project basis
they would chip away at the time taken within their area. In aggregate form this would
result in major savings.
Two key features are important here — the use of ‘stretch’ targets which give impetus,
and the use of monitoring and measurement against these targets as a way of guiding the
process and maintaining momentum. In addition there is a strong component of ‘know
why’ as well as know-how — in other words, there is an attempt to explain the rationale
behind the strategy and how improvements in a particular area contribute to it. For
example, in a chemical plant working towards the target of ‘zero breakdowns’ each
machine has detailed operating and maintaining instructions attached. These have been
developed through CI activity and include not only the new operating procedures but
also a section on why these steps are important. There is thus an element of
organisational learning, of turning tacit into formal knowledge. Similar functions are
performed by the storyboards which characterise progress along the road to meeting
strategic targets.
Policy deployment is concerned with strategic objectives so the timescales for typical
‘campaigns’ are long. For example, in Japan the ‘mid-term plan is the key driver in firms,
and this represents a clear statement of objectives and targets over the next 3 years.