
Recomendados
Más contenido relacionado
Destacado
Similar a Media bar chart
Similar a Media bar chart (20)
Más de ayakhaireh1
Media bar chart
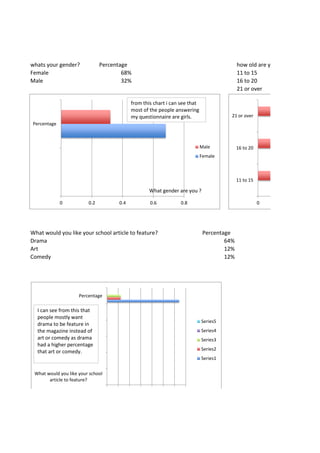
- 1. whats your gender? Percentage how old are you? Female 68% 11 to 15 Male 32% 16 to 20 21 or over What would you like your school article to feature? Percentage Drama 64% Art 12% Comedy 12% 0 0.2 0.4 0.6 0.8 Percentage Male Female What gender are you ? 0 11 to 15 16 to 20 21 or over 0 0.1 0.2 0.3 0.4 0.5 0.6 0.7 What would you like your school article to feature? Percentage Series5 Series4 Series3 Series2 Series1 from this chart i can see that most of the people answering my questionnaire are girls. I can see from this that people mostly want drama to be feature in the magazine instead of art or comedy as drama had a higher percentage that art or comedy.
- 2. 0 0.1 0.2 0.3 0.4 0.5 0.6 0.7
- 3. how old are you? percentage Do you read the school article? 26% Yes 54% No 20% What would you like the text to be? percentage What would you like to see in your Blackoak std 49% Colourful adamsky sk 0 Image berlin sans fb demi 51% Bold interesting text 0.1 0.2 0.3 0.4 0.5 0.6 percentage from this i can see that the highest age range that the people that answerd my questionnaire are girls 0 0.1 Do you read the school article? Percentage from the data i can see that there isnt that many people that read the school article 0 0.1 0.2 0.3 0.4 0.5 0.6 What would you like the text to be? percentage Series4 Series3 Series2 Series1 from the data i got from my questionnaire i can see that my audience would prefer to have the text to be berlin sana fb demi than adamsky sk 0.26 percentage from this i can that the audience would want to seeimages in the magazine they want it to be bold and colourful as there isnt any difference from the chart. only a 5% diffrence between images ,bold intersting text compared to colourful
- 4. 0 0.1 0.2 0.3 0.4 0.5 0.6 0.26
- 5. the school article? Percentage What would you like the school article to be called? 36% Plumzine 64% Megazine Megastar What would you like to see in your school article? percentage 30% 35% Bold interesting text 35% 0.1 0.2 0.3 0.4 0.5 0.6 0.7 Series3 Series2 Series1 0.26 0.28 0.3 0.32 0.34 0.36 Bold interesting text Image Colourful this i can that the audience would want to see images in the magazine they it to be bold and colourful as there isnt any difference from the chart. a 5% diffrence between images ,bold intersting text compared to colourful 0 0.1 0.2 What would you like the school article to be called? Percentage From the data that i have collected i can see that see that my audience would prefer the magazine to be called plumzine than megastar however there wasnt much of a difference between plumzine and What would you like to see in your school article?
- 6. 0.26 0.28 0.3 0.32 0.34 0.36
- 7. school article to be called? Percentage 50% 45% 5% 0.2 0.3 0.4 0.5 0.6 Series4 Series3 Series2 Series1