Keith C. Clarke Computer Models and Big Data: What can computation contribute?
•
0 recomendaciones•1,165 vistas

Computer models and big data enable environmental modeling at unprecedented scales. Big data provides detailed spatial, temporal, and radiometric resolution data for modeling. Cellular automata (CA) models like SLEUTH are well-suited for modeling complex urban systems. SLEUTH uses large datasets to calibrate transition rules and model land use change over time. It can generate scenarios by modifying parameters, transportation networks, and exclusion layers. Parallel and distributed computing allow SLEUTH to model vast areas quickly. Integrating models with big data and advanced computing removes barriers to simulating real-world systems.

Recomendados
Recomendados
Más contenido relacionado
Similar a Keith C. Clarke Computer Models and Big Data: What can computation contribute?
Similar a Keith C. Clarke Computer Models and Big Data: What can computation contribute? (20)
Más de Beniamino Murgante
Más de Beniamino Murgante (20)
Último
Último (20)
Keith C. Clarke Computer Models and Big Data: What can computation contribute?
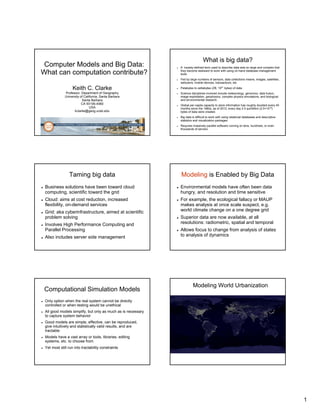
- 1. What is big data? Computer Models and Big Data: A loosely-defined term used to describe data sets so large and complex that What can computation contribute? they become awkward to work with using on-hand database management tools Fed by large numbers of sensors, data collections means, images, satellites, webcams, mobile devices, transactions, etc Keith C. Clarke Petabytes to zettabytes (ZB, 1021 bytes) of data. Professor, Department of Geography Science disciplines involved include meteorology, genomics, data fusion, University of California, Santa Barbara image exploitation, geophysics, complex physics simulations, and biological Santa Barbara and environmental research. CA 93106-4060 Global per-capita capacity to store information has roughly doubled every 40 USA months since the 1980s, as of 2012, every day 2.5 quintillion (2.5×10¹⁸) kclarke@geog.ucsb.edu bytes of data were created. Big data is difficult to work with using relational databases and descriptive statistics and visualization packages Requires massively parallel software running on tens, hundreds, or even thousands of servers Taming big data Modeling is Enabled by Big Data Business solutions have been toward cloud Environmental models have often been data computing, scientific toward the grid hungry, and resolution and time sensitive Cloud: aims at cost reduction, increased For example, the ecological fallacy or MAUP flexibility, on-demand services makes analysis at once scale suspect, e.g. Grid: aka cyberinfrastructure, aimed at scientific world climate change on a one degree grid problem solving Superior data are now available, at all Involves High Performance Computing and resolutions: radiometric, spatial and temporal Parallel Processing Allows focus to change from analysis of states Also includes server side management to analysis of dynamics Modeling World Urbanization Computational Simulation Models Only option when the real system cannot be directly controlled or when testing would be unethical All good models simplify, but only as much as is necessary to capture system behavior Good models are simple, effective, can be reproduced, give intuitively and statistically valid results, and are tractable Models have a vast array or tools, libraries, editing systems, etc. to choose from Yet most still run into tractability constraints 1
- 2. Modeling Cities Computer modeling and the city Rates of urbanization world wide are Many computer-based models of city growth, unprecedented in human history, fastest rates services, and flows were developed during the in China's Pearl River Delta 1970s based on the Forrester Systems Urban expansion and land use change are Dynamics approach good examples of complex systems Douglass B. Lee in 1973 published “Requiem High degree of dependence on initial conditions for Large Scale Models” JAIP 39, 3, 162-178. Multiple influences on change Seven Deadly sins: Hypercomprehensiveness, grossness, hungriness, wrongheadedness, Non-linear feedbacks complicatedness, mechanicalness, and Phases and phase changes, boom and bust expensiveness. A new generation of models Data for Modeling cities Two new types of models emerged during the 1990s: Greatly facilitated by remote sensing Cellular Automata and Agent Based Models Resolutions have improved from 80m to 1m in ABM best suited to hypothesis testing within cities and two decades (but makes cross time comparison for demography. Appear difficult to apply geocomputational methods hard) CA are ideal, strike down each of the seven sins New methods have been devised to accurately map land use and detect what areas are urban Simple to implement and understand, spatially explicit and apparently accurate in modeling and forecasting RS data can be matched to local city-wide GIS A perfect match to raster GIS and two dimensional data, management data bases and maps arrays GIS enables layer matching, which must be exact The impact of resolution Many CA models CA models consist of: A set of existing conditions (Land use at some time on the past) A regular grid of cells (the framework) A neighborhood over which the rules apply A set of mutually exclusive and non-overlapping states (e.g. urban, forest, water, agriculture) 100m 30m Rules governing transitions in each cell based on 5m the states of its neighbors Almost all differences among models are in the rules 2
- 3. Elements of CA CA transition rules Can be derived empirically if before and after images are available (e.g. City in 1990 and 2010), but assumes rules do not change for a Cell states forecast in 2030 Can be devised by combinations of causative factors SLEUTH uses topographic slope, prior land Kernel pixel, to which use, urban status, proximity to transportation Rule is applied, e.g. if two Neighborhood or more neighbors are and exclusions Magenta, turn magenta What is SLEUTH How does SLEUTH work? A popular CA urban growth and land use change Assemble data in standard file naming model convention Open source for over 15 years Download and test model against supplied test 100+ applications data set, duplicate results Source code in C, using gd graphics libraries with Unix Use in test mode to validate input data or Linux. PC use possible under cygwin Calibrate in three phases Supported by NSF, USGS, and the USEPA Many bug fixes, user for a, papers, on line Using best calibration parameters, determine documentation, etc output values at forecast start date Parallel version uses MPI Run forecasts, examine statistics and graphics 1900 1925 1950 1975 2000 Behavior Rules Slope T0 T1 Land Cover spreading road deltatron spontaneous center organic influenced Excluded Urban Transportation Hillshade 3
- 4. Spontaneous Growth Creation of new Spreading Centers Some new urban settlements will become centers of further growth. urban settlements may occur anywhere on a landscape Others will remain isolated. f (diffusion coefficient, slope resistance) f (spontaneous growth, breed coefficient, slope resistance) Organic Growth Road Influenced Growth The most common type of development Urbanization has a tendency to follow lines occurs at urban edges and as in-filling of transportation f (spread coefficient, slope resistance) f (breed coefficient, road_gravity coefficient, slope resistance, diffusion coefficient) Deltatron Land Cover Model Land cover transitions Phase 2: Perpetuate change search for change in the neighborhood find associated land cover transitions delta space Transition Probability Matrix YEL ORN GRN YEL 0.9 0.05 0.05 ORN 0.05 0.9 0.05 create deltatrons Age or kill deltatrons impose change in land cover 4
- 5. Deltatrons at work Behavior Rules T0 T1 spreading road spontaneous organic deltatron center influenced f (slope f (slope f (slope f (slope resistance, resistance, resistanc resistanc diffusion coefficient, diffusion e, breed e, spread breed coefficient, coefficient) coefficien coefficien road gravity) t) t) For i time periods (years) Calibr The Method past ation Predicting the present “Brute force calibration” from the past Phased exploration of parameter space Start with coarse parameter steps and coarsened spatial data (no longer necessary) Step to finer and finer data as calibration proceeds For n “Good” rather than best solution Monte Carlo iterations 5 parameters 0-100 = 101^5 permutations Initial runs in the late 1990s ran for 5000 hours For n coefficient Application in 2010 ran for 6 CPU months sets “present” Prediction (the future from the present) SLEUTH in parallel Probability Images Monte Carlo iteration and time steps are embarrassingly parallel! Massive speed-up attained Have tested with clusters, Beowulf groups, Alternate Scenarios (Exclusion, roads) supercomputers, etc. Entire eastern USA modeled at 100m in 1 Cray hour pSLEUTH uses pRPL, plans for USA at 30m Land Cover Uncertainty Code modifications and optimization allow use even on a PC under Windows/cygwin Also explored genetic algorithms (80% reduction) 5
- 6. A decade of SLEUTHing SLEUTH and Scenarios Approximately 100 papers on applications Urban pattern in the future Used on every continent except Antarctica Transportation network Applied at scales from 1m to 1km Exclusion layer Many lessons learned: three review papers now in Change parameters “Cross-breeding” print Can couple with other models Some applications as examples follow Starting to integrate policy: At first land protection, e.g. Lisbon, now MCE and differential assessment (CA Williamson Act) Future Scenarios Santa Barbara Tulare Land 2003 Part 2: Input Images Tulare excluded. Wac. (Used for the Williamson Act Excluded Layer) 6
- 7. Scenario 1. Business As Usual (Current Administration) Model integration Westernport Project: DPI Parkville Conceptual Framework Stakeholders Define a problem Evaluate Solutions User Interface (Maps, Tables and Graphics) Output Input MSE Model Management System Scenario Management Terrestrial Component Marine Multi-criteria Model Model Land Use change Hydrological Marine Models Model (SLEUTH) Model (Spatial) Database Management System (GIS-based) Land Topography (Slope, Vegetation (EVC – Species (Animal Climate (Rainfall, Socio-economic Soil Attributes Use Elevation, Orientation) Native Plantation) Habitat) Temperature) characteristics Study Area (Source: Claudia Pelizaro) Scenario 2 • Land development is not controlled by any statutory regulation. • Land use change follows past trends • Google Earth Leão, S., Bishop, I. and Evans, D. 2004. Spatial-temporal model for demand SLEUTH Model Output allocation of waste landfills in growing urban regions. Computers Environment and Urban Systems 28: 353-385. 7
- 8. Conclusion Al-Awadhi, T. (2007), Monitoring and Modeling Urban Expansion Using GIS & RS: Case Study from Muscat, Oman, 2007 Urban Remote Sensing Joint Event, ©2007 IEEE. •Cyberinfrastructure, the grid, and HPC have removed many computational barriers to big data scale simulation modeling •SLEUTH urban growth and land use change model was used as an example of the most successful model type (CA) show how advanced computing techniques have advanced modeling by increasing tractability •Most promise for scientific modeling lies in parallelization, for which CA is a natural •However an issue remains: few bother to learn parallel programming or how to use grid tools •Geoportals to HPC tools may be the best option Thank you for your time 8