SlideShare una empresa de Scribd logo
1 de 23
Descargar para leer sin conexión
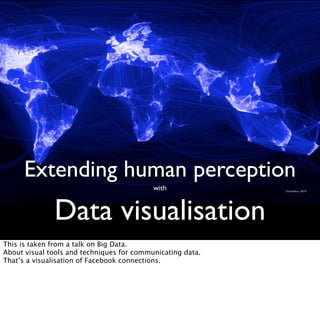
Extending human perception
with
Data visualisation
This is taken from a talk on Big Data.
About visual tools and techniques for communicating data.
That’s a visualisation of Facebook connections.
Visualisations of big data are often beautiful but useless.
This is art, not insight.
Communicating insights are not just about pretty graphics, that’s just design porn.
“Visualization allows people to
offload cognition to the
perceptual system, using
carefully designed images as a
form of external memory.”
Tamara Munzner
Department of Computer Science
University of British Columbia
Visualisation extends perception & memory.
http://www.cs.ubc.ca/labs/imager/tr/2009/VisChapter/akp-vischapter.pdf
A visualisation turns something you want to find into something you can see.
0"
5"
10"
15"
20"
25"
30"
35"
40"
45"
50"
6/01/08"
6/03/08"
6/05/08"
6/07/08"
6/09/08"
6/11/08"
6/01/09"
6/03/09"
6/05/09"
6/07/09"
6/09/09"
6/11/09"
6/01/10"
6/03/10"
6/05/10"
6/07/10"
6/09/10"
6/11/10"
6/01/11"
6/03/11"
6/05/11"
6/07/11"
6/09/11"
6/11/11"
6/01/12"
6/03/12"
6/05/12"
6/07/12"
6/09/12"
6/11/12"
Late%&mesheets%
A visualisation turns something you want to find into something you can see.
How do we extend
the human ability to
perceive data?
We make it possible for our eyes to see trends and identify differences.
Work with human perception: Senses, memory, cognition.
This can be done by using a variety of “visual search” techniques to make data “Pop out”.
Colour, size, orientation, shape, grouping, motion,
This can be done by using a variety of “visual search” techniques to make data “Pop out”.
Colour, size, orientation, shape, grouping, motion,
This can be done by using a variety of “visual search” techniques to make data “Pop out”.
Colour, size, orientation, shape, grouping, motion,
This can be done by using a variety of “visual search” techniques to make data “Pop out”.
Colour, size, orientation, shape, grouping, motion,
This can be done by using a variety of “visual search” techniques to make data “Pop out”.
Colour, size, orientation, shape, grouping, motion,
This can be done by using a variety of “visual search” techniques to make data “Pop out”.
Colour, size, orientation, shape, grouping, motion,
This can be done by using a variety of “visual search” techniques to make data “Pop out”.
Colour, size, orientation, shape, grouping, motion,
Don’t show it all at once.
Filter, Animate, Summarise,
Don’t show it all at once.
Filter, Animate, Summarise,
Don’t show it all at once.
Filter, Animate, Summarise,
x 133
Don’t show it all at once.
Filter, Animate, Summarise,
Look at
me!
Annotate and label – help people not get lost.
Text
Clusters
Outliers
Correlations
Patterns to look for: Clusters, outliers, extents, correlations.
http://www.google.com/publicdata/explore?
ds=d5bncppjof8f9_&ctype=b&strail=false&nselm=s&met_x=sp_dyn_le00_in&scale_x=lin&ind_x=false&met_y=sp_dyn_tfrt_in&sc
ale_y=lin&ind_y=false&met_s=sp_pop_totl&scale_s=lin&ind_s=false&dimp_c=country:region&ifdim=country&hl=en&dl=en&icon
Size=0.5&uniSize=0.035#!
ctype=b&strail=false&bcs=d&nselm=s&met_x=sp_dyn_le00_in&scale_x=lin&ind_x=false&met_y=sp_dyn_tfrt_in&scale_y=lin&ind
_y=false&met_s=sp_pop_totl&scale_s=lin&ind_s=false&dimp_c=country:region&ifdim=country&pit=-153914400000&hl=en_US
&dl=en&ind=false
Look at
me!
Look at
me!
Look at
me!
Minimum necessary difference.
Reduce visual noise.
Tufte: What is the minimum number of pixels required to highlight the difference between
data.
Look at
me!
Look at
me!
Look at
me!
Minimum necessary difference.
Reduce visual noise.
Tufte: What is the minimum number of pixels required to highlight the difference between
data.
You are here
You can’t look at big data sets all at once, you can look at 2 parts of it at once to try to make
sense of them together in your mind.
Interface extends perception, allowing us to understand what it is telling us.
Total Perspective Vortex - Zaphod Bebblebrox

Más contenido relacionado

Similar a Extending human perception with data visualisation notes

Infographics for the social sector webinar
Infographics for the social sector webinarInfographics for the social sector webinar
Infographics for the social sector webinarStephen MacKley
 
Introduction to Data Visualisation
Introduction to Data VisualisationIntroduction to Data Visualisation
Introduction to Data VisualisationShiralee Saul
 
Introduction to Information Visualization (Part 2)
Introduction to Information Visualization (Part 2)Introduction to Information Visualization (Part 2)
Introduction to Information Visualization (Part 2)Andrew Vande Moere
 
Everything you ever wanted to know about Google Analytics, but were afraid to...
Everything you ever wanted to know about Google Analytics, but were afraid to...Everything you ever wanted to know about Google Analytics, but were afraid to...
Everything you ever wanted to know about Google Analytics, but were afraid to...SoCal UX Camp
 
Frontiers of Computational Journalism week 8 - Visualization and Network Anal...
Frontiers of Computational Journalism week 8 - Visualization and Network Anal...Frontiers of Computational Journalism week 8 - Visualization and Network Anal...
Frontiers of Computational Journalism week 8 - Visualization and Network Anal...Jonathan Stray
 
The Visual Data Discovery Tool
The Visual Data Discovery ToolThe Visual Data Discovery Tool
The Visual Data Discovery ToolLisa Brown
 
Interaction design
Interaction designInteraction design
Interaction designmarkguy
 
Posters @ Mercy
Posters @ MercyPosters @ Mercy
Posters @ Mercyhcollazo1
 
A Pixar Twist on Presenting Data
A Pixar Twist on Presenting DataA Pixar Twist on Presenting Data
A Pixar Twist on Presenting DataAmanda Makulec
 
Introduction to Data Visualization
Introduction to Data Visualization Introduction to Data Visualization
Introduction to Data Visualization Ana Jofre
 
Denis Boudreau - 2017 Design Trends
Denis Boudreau - 2017 Design TrendsDenis Boudreau - 2017 Design Trends
Denis Boudreau - 2017 Design TrendsWeb à Québec
 
The Architecture of Understanding (Peter Morville at Enterprise UX 2015)
The Architecture of Understanding (Peter Morville at Enterprise UX 2015)The Architecture of Understanding (Peter Morville at Enterprise UX 2015)
The Architecture of Understanding (Peter Morville at Enterprise UX 2015)Rosenfeld Media
 
The Architecture of Understanding
The Architecture of UnderstandingThe Architecture of Understanding
The Architecture of UnderstandingPeter Morville
 
Why do we need to understand data visualisations There are more .docx
Why do we need to understand data visualisations There are more .docxWhy do we need to understand data visualisations There are more .docx
Why do we need to understand data visualisations There are more .docxgauthierleppington
 
Why do we need to understand data visualisations There is more and
Why do we need to understand data visualisations There is more andWhy do we need to understand data visualisations There is more and
Why do we need to understand data visualisations There is more andjonghollingberry
 
Why do we need to understand data visualisations There is more and.docx
Why do we need to understand data visualisations There is more and.docxWhy do we need to understand data visualisations There is more and.docx
Why do we need to understand data visualisations There is more and.docxgauthierleppington
 
Why do we need to understand data visualisations There is more and .docx
Why do we need to understand data visualisations There is more and .docxWhy do we need to understand data visualisations There is more and .docx
Why do we need to understand data visualisations There is more and .docxgauthierleppington
 
Multivariate Data Visualization
Multivariate Data VisualizationMultivariate Data Visualization
Multivariate Data Visualizationanilash
 

Similar a Extending human perception with data visualisation notes (20)

Infographics for the social sector webinar
Infographics for the social sector webinarInfographics for the social sector webinar
Infographics for the social sector webinar
 
Introduction to Data Visualisation
Introduction to Data VisualisationIntroduction to Data Visualisation
Introduction to Data Visualisation
 
Introduction to Information Visualization (Part 2)
Introduction to Information Visualization (Part 2)Introduction to Information Visualization (Part 2)
Introduction to Information Visualization (Part 2)
 
Everything you ever wanted to know about Google Analytics, but were afraid to...
Everything you ever wanted to know about Google Analytics, but were afraid to...Everything you ever wanted to know about Google Analytics, but were afraid to...
Everything you ever wanted to know about Google Analytics, but were afraid to...
 
Frontiers of Computational Journalism week 8 - Visualization and Network Anal...
Frontiers of Computational Journalism week 8 - Visualization and Network Anal...Frontiers of Computational Journalism week 8 - Visualization and Network Anal...
Frontiers of Computational Journalism week 8 - Visualization and Network Anal...
 
Visual Thinking
Visual ThinkingVisual Thinking
Visual Thinking
 
The Visual Data Discovery Tool
The Visual Data Discovery ToolThe Visual Data Discovery Tool
The Visual Data Discovery Tool
 
Interaction design
Interaction designInteraction design
Interaction design
 
Posters @ Mercy
Posters @ MercyPosters @ Mercy
Posters @ Mercy
 
A Pixar Twist on Presenting Data
A Pixar Twist on Presenting DataA Pixar Twist on Presenting Data
A Pixar Twist on Presenting Data
 
Introduction to Data Visualization
Introduction to Data Visualization Introduction to Data Visualization
Introduction to Data Visualization
 
Denis Boudreau - 2017 Design Trends
Denis Boudreau - 2017 Design TrendsDenis Boudreau - 2017 Design Trends
Denis Boudreau - 2017 Design Trends
 
The Architecture of Understanding (Peter Morville at Enterprise UX 2015)
The Architecture of Understanding (Peter Morville at Enterprise UX 2015)The Architecture of Understanding (Peter Morville at Enterprise UX 2015)
The Architecture of Understanding (Peter Morville at Enterprise UX 2015)
 
The Architecture of Understanding
The Architecture of UnderstandingThe Architecture of Understanding
The Architecture of Understanding
 
Why do we need to understand data visualisations There are more .docx
Why do we need to understand data visualisations There are more .docxWhy do we need to understand data visualisations There are more .docx
Why do we need to understand data visualisations There are more .docx
 
Class 5
Class 5Class 5
Class 5
 
Why do we need to understand data visualisations There is more and
Why do we need to understand data visualisations There is more andWhy do we need to understand data visualisations There is more and
Why do we need to understand data visualisations There is more and
 
Why do we need to understand data visualisations There is more and.docx
Why do we need to understand data visualisations There is more and.docxWhy do we need to understand data visualisations There is more and.docx
Why do we need to understand data visualisations There is more and.docx
 
Why do we need to understand data visualisations There is more and .docx
Why do we need to understand data visualisations There is more and .docxWhy do we need to understand data visualisations There is more and .docx
Why do we need to understand data visualisations There is more and .docx
 
Multivariate Data Visualization
Multivariate Data VisualizationMultivariate Data Visualization
Multivariate Data Visualization
 

Más de Ben Melbourne

Agile Enabled Product Innovation
Agile Enabled Product InnovationAgile Enabled Product Innovation
Agile Enabled Product InnovationBen Melbourne
 
Pecha Kucha - Edward Tufte Information Design books review
Pecha Kucha - Edward Tufte Information Design books reviewPecha Kucha - Edward Tufte Information Design books review
Pecha Kucha - Edward Tufte Information Design books reviewBen Melbourne
 
Finding time for design within agile software delivery
Finding time for design within agile software deliveryFinding time for design within agile software delivery
Finding time for design within agile software deliveryBen Melbourne
 
Gameification & gen y
Gameification & gen yGameification & gen y
Gameification & gen yBen Melbourne
 
IxDA QGov Single Website Experience
IxDA QGov Single Website ExperienceIxDA QGov Single Website Experience
IxDA QGov Single Website ExperienceBen Melbourne
 
Improving video rating performance – focusing on user & interface
Improving video rating performance – focusing on user & interfaceImproving video rating performance – focusing on user & interface
Improving video rating performance – focusing on user & interfaceBen Melbourne
 
Agile UX: User Experience Design in the world of Agile Software Development
Agile UX: User Experience Design in the world of Agile Software Development Agile UX: User Experience Design in the world of Agile Software Development
Agile UX: User Experience Design in the world of Agile Software Development Ben Melbourne
 
General UX activities & process overview
General UX activities & process overviewGeneral UX activities & process overview
General UX activities & process overviewBen Melbourne
 
Interaction design trends 2001
Interaction design trends 2001Interaction design trends 2001
Interaction design trends 2001Ben Melbourne
 
What is UX? Or How We're Learning to Build the Right Thing, The Right Way
 What is UX? Or How We're Learning to Build the Right Thing, The Right Way What is UX? Or How We're Learning to Build the Right Thing, The Right Way
What is UX? Or How We're Learning to Build the Right Thing, The Right WayBen Melbourne
 
Service Design vs Experience Design: Chicken & Egg or Wild Goose
Service Design vs Experience Design: Chicken & Egg or Wild GooseService Design vs Experience Design: Chicken & Egg or Wild Goose
Service Design vs Experience Design: Chicken & Egg or Wild GooseBen Melbourne
 

Más de Ben Melbourne (11)

Agile Enabled Product Innovation
Agile Enabled Product InnovationAgile Enabled Product Innovation
Agile Enabled Product Innovation
 
Pecha Kucha - Edward Tufte Information Design books review
Pecha Kucha - Edward Tufte Information Design books reviewPecha Kucha - Edward Tufte Information Design books review
Pecha Kucha - Edward Tufte Information Design books review
 
Finding time for design within agile software delivery
Finding time for design within agile software deliveryFinding time for design within agile software delivery
Finding time for design within agile software delivery
 
Gameification & gen y
Gameification & gen yGameification & gen y
Gameification & gen y
 
IxDA QGov Single Website Experience
IxDA QGov Single Website ExperienceIxDA QGov Single Website Experience
IxDA QGov Single Website Experience
 
Improving video rating performance – focusing on user & interface
Improving video rating performance – focusing on user & interfaceImproving video rating performance – focusing on user & interface
Improving video rating performance – focusing on user & interface
 
Agile UX: User Experience Design in the world of Agile Software Development
Agile UX: User Experience Design in the world of Agile Software Development Agile UX: User Experience Design in the world of Agile Software Development
Agile UX: User Experience Design in the world of Agile Software Development
 
General UX activities & process overview
General UX activities & process overviewGeneral UX activities & process overview
General UX activities & process overview
 
Interaction design trends 2001
Interaction design trends 2001Interaction design trends 2001
Interaction design trends 2001
 
What is UX? Or How We're Learning to Build the Right Thing, The Right Way
 What is UX? Or How We're Learning to Build the Right Thing, The Right Way What is UX? Or How We're Learning to Build the Right Thing, The Right Way
What is UX? Or How We're Learning to Build the Right Thing, The Right Way
 
Service Design vs Experience Design: Chicken & Egg or Wild Goose
Service Design vs Experience Design: Chicken & Egg or Wild GooseService Design vs Experience Design: Chicken & Egg or Wild Goose
Service Design vs Experience Design: Chicken & Egg or Wild Goose
 

Último

Exploring Multimodal Embeddings with Milvus
Exploring Multimodal Embeddings with MilvusExploring Multimodal Embeddings with Milvus
Exploring Multimodal Embeddings with MilvusZilliz
 
Six Myths about Ontologies: The Basics of Formal Ontology
Six Myths about Ontologies: The Basics of Formal OntologySix Myths about Ontologies: The Basics of Formal Ontology
Six Myths about Ontologies: The Basics of Formal Ontologyjohnbeverley2021
 
Cloud Frontiers: A Deep Dive into Serverless Spatial Data and FME
Cloud Frontiers:  A Deep Dive into Serverless Spatial Data and FMECloud Frontiers:  A Deep Dive into Serverless Spatial Data and FME
Cloud Frontiers: A Deep Dive into Serverless Spatial Data and FMESafe Software
 
DEV meet-up UiPath Document Understanding May 7 2024 Amsterdam
DEV meet-up UiPath Document Understanding May 7 2024 AmsterdamDEV meet-up UiPath Document Understanding May 7 2024 Amsterdam
DEV meet-up UiPath Document Understanding May 7 2024 AmsterdamUiPathCommunity
 
Rising Above_ Dubai Floods and the Fortitude of Dubai International Airport.pdf
Rising Above_ Dubai Floods and the Fortitude of Dubai International Airport.pdfRising Above_ Dubai Floods and the Fortitude of Dubai International Airport.pdf
Rising Above_ Dubai Floods and the Fortitude of Dubai International Airport.pdfOrbitshub
 
MINDCTI Revenue Release Quarter One 2024
MINDCTI Revenue Release Quarter One 2024MINDCTI Revenue Release Quarter One 2024
MINDCTI Revenue Release Quarter One 2024MIND CTI
 
FWD Group - Insurer Innovation Award 2024
FWD Group - Insurer Innovation Award 2024FWD Group - Insurer Innovation Award 2024
FWD Group - Insurer Innovation Award 2024The Digital Insurer
 
Architecting Cloud Native Applications
Architecting Cloud Native ApplicationsArchitecting Cloud Native Applications
Architecting Cloud Native ApplicationsWSO2
 
[BuildWithAI] Introduction to Gemini.pdf
[BuildWithAI] Introduction to Gemini.pdf[BuildWithAI] Introduction to Gemini.pdf
[BuildWithAI] Introduction to Gemini.pdfSandro Moreira
 
TrustArc Webinar - Unlock the Power of AI-Driven Data Discovery
TrustArc Webinar - Unlock the Power of AI-Driven Data DiscoveryTrustArc Webinar - Unlock the Power of AI-Driven Data Discovery
TrustArc Webinar - Unlock the Power of AI-Driven Data DiscoveryTrustArc
 
How to Troubleshoot Apps for the Modern Connected Worker
How to Troubleshoot Apps for the Modern Connected WorkerHow to Troubleshoot Apps for the Modern Connected Worker
How to Troubleshoot Apps for the Modern Connected WorkerThousandEyes
 
Apidays New York 2024 - Scaling API-first by Ian Reasor and Radu Cotescu, Adobe
Apidays New York 2024 - Scaling API-first by Ian Reasor and Radu Cotescu, AdobeApidays New York 2024 - Scaling API-first by Ian Reasor and Radu Cotescu, Adobe
Apidays New York 2024 - Scaling API-first by Ian Reasor and Radu Cotescu, Adobeapidays
 
Repurposing LNG terminals for Hydrogen Ammonia: Feasibility and Cost Saving
Repurposing LNG terminals for Hydrogen Ammonia: Feasibility and Cost SavingRepurposing LNG terminals for Hydrogen Ammonia: Feasibility and Cost Saving
Repurposing LNG terminals for Hydrogen Ammonia: Feasibility and Cost SavingEdi Saputra
 
Apidays New York 2024 - Accelerating FinTech Innovation by Vasa Krishnan, Fin...
Apidays New York 2024 - Accelerating FinTech Innovation by Vasa Krishnan, Fin...Apidays New York 2024 - Accelerating FinTech Innovation by Vasa Krishnan, Fin...
Apidays New York 2024 - Accelerating FinTech Innovation by Vasa Krishnan, Fin...apidays
 
Mcleodganj Call Girls 🥰 8617370543 Service Offer VIP Hot Model
Mcleodganj Call Girls 🥰 8617370543 Service Offer VIP Hot ModelMcleodganj Call Girls 🥰 8617370543 Service Offer VIP Hot Model
Mcleodganj Call Girls 🥰 8617370543 Service Offer VIP Hot ModelDeepika Singh
 
Platformless Horizons for Digital Adaptability
Platformless Horizons for Digital AdaptabilityPlatformless Horizons for Digital Adaptability
Platformless Horizons for Digital AdaptabilityWSO2
 
Web Form Automation for Bonterra Impact Management (fka Social Solutions Apri...
Web Form Automation for Bonterra Impact Management (fka Social Solutions Apri...Web Form Automation for Bonterra Impact Management (fka Social Solutions Apri...
Web Form Automation for Bonterra Impact Management (fka Social Solutions Apri...Jeffrey Haguewood
 
WSO2's API Vision: Unifying Control, Empowering Developers
WSO2's API Vision: Unifying Control, Empowering DevelopersWSO2's API Vision: Unifying Control, Empowering Developers
WSO2's API Vision: Unifying Control, Empowering DevelopersWSO2
 
Elevate Developer Efficiency & build GenAI Application with Amazon Q​
Elevate Developer Efficiency & build GenAI Application with Amazon Q​Elevate Developer Efficiency & build GenAI Application with Amazon Q​
Elevate Developer Efficiency & build GenAI Application with Amazon Q​Bhuvaneswari Subramani
 
Strategize a Smooth Tenant-to-tenant Migration and Copilot Takeoff
Strategize a Smooth Tenant-to-tenant Migration and Copilot TakeoffStrategize a Smooth Tenant-to-tenant Migration and Copilot Takeoff
Strategize a Smooth Tenant-to-tenant Migration and Copilot Takeoffsammart93
 

Último (20)

Exploring Multimodal Embeddings with Milvus
Exploring Multimodal Embeddings with MilvusExploring Multimodal Embeddings with Milvus
Exploring Multimodal Embeddings with Milvus
 
Six Myths about Ontologies: The Basics of Formal Ontology
Six Myths about Ontologies: The Basics of Formal OntologySix Myths about Ontologies: The Basics of Formal Ontology
Six Myths about Ontologies: The Basics of Formal Ontology
 
Cloud Frontiers: A Deep Dive into Serverless Spatial Data and FME
Cloud Frontiers:  A Deep Dive into Serverless Spatial Data and FMECloud Frontiers:  A Deep Dive into Serverless Spatial Data and FME
Cloud Frontiers: A Deep Dive into Serverless Spatial Data and FME
 
DEV meet-up UiPath Document Understanding May 7 2024 Amsterdam
DEV meet-up UiPath Document Understanding May 7 2024 AmsterdamDEV meet-up UiPath Document Understanding May 7 2024 Amsterdam
DEV meet-up UiPath Document Understanding May 7 2024 Amsterdam
 
Rising Above_ Dubai Floods and the Fortitude of Dubai International Airport.pdf
Rising Above_ Dubai Floods and the Fortitude of Dubai International Airport.pdfRising Above_ Dubai Floods and the Fortitude of Dubai International Airport.pdf
Rising Above_ Dubai Floods and the Fortitude of Dubai International Airport.pdf
 
MINDCTI Revenue Release Quarter One 2024
MINDCTI Revenue Release Quarter One 2024MINDCTI Revenue Release Quarter One 2024
MINDCTI Revenue Release Quarter One 2024
 
FWD Group - Insurer Innovation Award 2024
FWD Group - Insurer Innovation Award 2024FWD Group - Insurer Innovation Award 2024
FWD Group - Insurer Innovation Award 2024
 
Architecting Cloud Native Applications
Architecting Cloud Native ApplicationsArchitecting Cloud Native Applications
Architecting Cloud Native Applications
 
[BuildWithAI] Introduction to Gemini.pdf
[BuildWithAI] Introduction to Gemini.pdf[BuildWithAI] Introduction to Gemini.pdf
[BuildWithAI] Introduction to Gemini.pdf
 
TrustArc Webinar - Unlock the Power of AI-Driven Data Discovery
TrustArc Webinar - Unlock the Power of AI-Driven Data DiscoveryTrustArc Webinar - Unlock the Power of AI-Driven Data Discovery
TrustArc Webinar - Unlock the Power of AI-Driven Data Discovery
 
How to Troubleshoot Apps for the Modern Connected Worker
How to Troubleshoot Apps for the Modern Connected WorkerHow to Troubleshoot Apps for the Modern Connected Worker
How to Troubleshoot Apps for the Modern Connected Worker
 
Apidays New York 2024 - Scaling API-first by Ian Reasor and Radu Cotescu, Adobe
Apidays New York 2024 - Scaling API-first by Ian Reasor and Radu Cotescu, AdobeApidays New York 2024 - Scaling API-first by Ian Reasor and Radu Cotescu, Adobe
Apidays New York 2024 - Scaling API-first by Ian Reasor and Radu Cotescu, Adobe
 
Repurposing LNG terminals for Hydrogen Ammonia: Feasibility and Cost Saving
Repurposing LNG terminals for Hydrogen Ammonia: Feasibility and Cost SavingRepurposing LNG terminals for Hydrogen Ammonia: Feasibility and Cost Saving
Repurposing LNG terminals for Hydrogen Ammonia: Feasibility and Cost Saving
 
Apidays New York 2024 - Accelerating FinTech Innovation by Vasa Krishnan, Fin...
Apidays New York 2024 - Accelerating FinTech Innovation by Vasa Krishnan, Fin...Apidays New York 2024 - Accelerating FinTech Innovation by Vasa Krishnan, Fin...
Apidays New York 2024 - Accelerating FinTech Innovation by Vasa Krishnan, Fin...
 
Mcleodganj Call Girls 🥰 8617370543 Service Offer VIP Hot Model
Mcleodganj Call Girls 🥰 8617370543 Service Offer VIP Hot ModelMcleodganj Call Girls 🥰 8617370543 Service Offer VIP Hot Model
Mcleodganj Call Girls 🥰 8617370543 Service Offer VIP Hot Model
 
Platformless Horizons for Digital Adaptability
Platformless Horizons for Digital AdaptabilityPlatformless Horizons for Digital Adaptability
Platformless Horizons for Digital Adaptability
 
Web Form Automation for Bonterra Impact Management (fka Social Solutions Apri...
Web Form Automation for Bonterra Impact Management (fka Social Solutions Apri...Web Form Automation for Bonterra Impact Management (fka Social Solutions Apri...
Web Form Automation for Bonterra Impact Management (fka Social Solutions Apri...
 
WSO2's API Vision: Unifying Control, Empowering Developers
WSO2's API Vision: Unifying Control, Empowering DevelopersWSO2's API Vision: Unifying Control, Empowering Developers
WSO2's API Vision: Unifying Control, Empowering Developers
 
Elevate Developer Efficiency & build GenAI Application with Amazon Q​
Elevate Developer Efficiency & build GenAI Application with Amazon Q​Elevate Developer Efficiency & build GenAI Application with Amazon Q​
Elevate Developer Efficiency & build GenAI Application with Amazon Q​
 
Strategize a Smooth Tenant-to-tenant Migration and Copilot Takeoff
Strategize a Smooth Tenant-to-tenant Migration and Copilot TakeoffStrategize a Smooth Tenant-to-tenant Migration and Copilot Takeoff
Strategize a Smooth Tenant-to-tenant Migration and Copilot Takeoff
 

Extending human perception with data visualisation notes

  • 1. Extending human perception with Data visualisation This is taken from a talk on Big Data. About visual tools and techniques for communicating data. That’s a visualisation of Facebook connections.
  • 2. Visualisations of big data are often beautiful but useless. This is art, not insight.
  • 3. Communicating insights are not just about pretty graphics, that’s just design porn.
  • 4. “Visualization allows people to offload cognition to the perceptual system, using carefully designed images as a form of external memory.” Tamara Munzner Department of Computer Science University of British Columbia Visualisation extends perception & memory. http://www.cs.ubc.ca/labs/imager/tr/2009/VisChapter/akp-vischapter.pdf
  • 5. A visualisation turns something you want to find into something you can see.
  • 7. How do we extend the human ability to perceive data? We make it possible for our eyes to see trends and identify differences. Work with human perception: Senses, memory, cognition.
  • 8. This can be done by using a variety of “visual search” techniques to make data “Pop out”. Colour, size, orientation, shape, grouping, motion,
  • 9. This can be done by using a variety of “visual search” techniques to make data “Pop out”. Colour, size, orientation, shape, grouping, motion,
  • 10. This can be done by using a variety of “visual search” techniques to make data “Pop out”. Colour, size, orientation, shape, grouping, motion,
  • 11. This can be done by using a variety of “visual search” techniques to make data “Pop out”. Colour, size, orientation, shape, grouping, motion,
  • 12. This can be done by using a variety of “visual search” techniques to make data “Pop out”. Colour, size, orientation, shape, grouping, motion,
  • 13. This can be done by using a variety of “visual search” techniques to make data “Pop out”. Colour, size, orientation, shape, grouping, motion,
  • 14. This can be done by using a variety of “visual search” techniques to make data “Pop out”. Colour, size, orientation, shape, grouping, motion,
  • 15. Don’t show it all at once. Filter, Animate, Summarise,
  • 16. Don’t show it all at once. Filter, Animate, Summarise,
  • 17. Don’t show it all at once. Filter, Animate, Summarise,
  • 18. x 133 Don’t show it all at once. Filter, Animate, Summarise,
  • 19. Look at me! Annotate and label – help people not get lost.
  • 20. Text Clusters Outliers Correlations Patterns to look for: Clusters, outliers, extents, correlations. http://www.google.com/publicdata/explore? ds=d5bncppjof8f9_&ctype=b&strail=false&nselm=s&met_x=sp_dyn_le00_in&scale_x=lin&ind_x=false&met_y=sp_dyn_tfrt_in&sc ale_y=lin&ind_y=false&met_s=sp_pop_totl&scale_s=lin&ind_s=false&dimp_c=country:region&ifdim=country&hl=en&dl=en&icon Size=0.5&uniSize=0.035#! ctype=b&strail=false&bcs=d&nselm=s&met_x=sp_dyn_le00_in&scale_x=lin&ind_x=false&met_y=sp_dyn_tfrt_in&scale_y=lin&ind _y=false&met_s=sp_pop_totl&scale_s=lin&ind_s=false&dimp_c=country:region&ifdim=country&pit=-153914400000&hl=en_US &dl=en&ind=false
  • 21. Look at me! Look at me! Look at me! Minimum necessary difference. Reduce visual noise. Tufte: What is the minimum number of pixels required to highlight the difference between data.
  • 22. Look at me! Look at me! Look at me! Minimum necessary difference. Reduce visual noise. Tufte: What is the minimum number of pixels required to highlight the difference between data.
  • 23. You are here You can’t look at big data sets all at once, you can look at 2 parts of it at once to try to make sense of them together in your mind. Interface extends perception, allowing us to understand what it is telling us. Total Perspective Vortex - Zaphod Bebblebrox