Más contenido relacionado
Más de Bertotools Limited (20)
Excel Constructing Charts
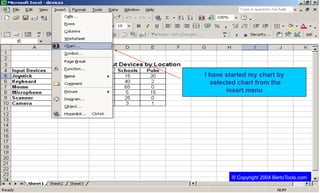
- 1. I have started my chart by selected chart from the insert menu © Copyright 2004 BertoTools.com
- 2. I have selected a 3-D Column Chart for this particular Data Set © Copyright 2004 BertoTools.com
- 3. I have selected Series for this particular Data Set since I have 6 series of data © Copyright 2004 BertoTools.com
- 4. I have clicked on Add to add my 1st Series © Copyright 2004 BertoTools.com
- 5. I have clicked on Cell A5 to Name my 1st Series “Joystick” & then clicked on the Red button to confirm it. © Copyright 2004 BertoTools.com
- 6. Cell A5 is now the Series Name. I need to insert the values of this Series by clicking on the Red button. © Copyright 2004 BertoTools.com
- 7. I have highlighted Cells B5 to E5 as My 1st Series data For Joystick & then clicked on the Red button to confirm it. © Copyright 2004 BertoTools.com
- 8. Cell B5 to E5 are now the Series Data Points. I need to insert the X axis data points by clicking on the red button. © Copyright 2004 BertoTools.com