SlideShare una empresa de Scribd logo
1 de 38
Descargar para leer sin conexión
THE JOURNAL OF FINANCE • VOL. LXIII, NO. 4 • AUGUST 2008


                   Presidential Address: The Cost
                         of Active Investing

                                    KENNETH R. FRENCH∗


                                            ABSTRACT
      I compare the fees, expenses, and trading costs society pays to invest in the U.S.
      stock market with an estimate of what would be paid if everyone invested passively.
      Averaging over 1980–2006, I find investors spend 0.67% of the aggregate value of the
      market each year searching for superior returns. Society’s capitalized cost of price
      discovery is at least 10% of the current market cap. Under reasonable assumptions,
      the typical investor would increase his average annual return by 67 basis points over
      the 1980–2006 period if he switched to a passive market portfolio.


HOW MUCH DO INVESTORS SPEND TRYING to beat the market? To answer this question,
I start by estimating the total amount society spends to invest. I measure four
components: the fees and expenses investors pay for mutual funds, including
open-end funds, closed-end funds, and exchange-traded funds; the investment
management costs of institutional investors; the fees investors pay for hedge
funds and funds of hedge funds; and the costs all investors pay to trade. I then
compare these costs to what society would pay if all investors held a passive
market portfolio. The difference is the cost of active investing.
   Consider a small but representative investor whose initial investment strat-
egy is the value-weight combination of all investors’ strategies. Because the
value-weight combination of all investors’ portfolios is the market portfolio, the
representative investor’s initial return is the gross return on the market mi-
nus the value-weight average of all investors’ costs. How would his return be

   ∗ Kenneth R. French is at the Amos Tuck School of Business, Dartmouth College. I had an
extraordinary amount of help on this project. Keith Ambachsteer, Van Anthony, Brad Asness,
Cliff Asness, Paul Bennett, Jack Bogle, David Booth, Stephen Brown, Kent Clark, Sean Collins,
Shrikant Dash, Bob Deere, Doug Diamond, Robert Dintzner, Jim Dunne, Scott Esser, Maribeth Far-
ley, Beth French, Will Goetzmann, Henry Gray, John Griswold, David Hall, Frank Hatheway, Ken
Heinz, Terry Hendershot, Sarah Holden, John Howard, Susan Hume McIntosh, Antti Ilmanen,
John Liew, Ananth Madhavan, Bernie Madoff, Kevin Maloney, Dave Martin, Charles McNickle,
Mike Mendelson, Nir Messafi, Mark Mitchell, Catherine Newell, Terry Odean, John Rekenthaler,
Eduardo Repetto, Savina Rizova, Mark Rubinstein, Dave Schneider, Bob Shiller, Jeff Smith, George
Sofianos, Hans Stoll, Dick Thaler, Ingrid Tierens, Paula Volent, and Wayne Wagner gave me valu-
able information and advice, and Robert Batt, Bob Burnham, Marianna Paskar, Savina Rizova,
and Blake Tatsuta provided excellent research assistance. I have also benefited from extensive
conversations with Brad Barber, Jon Lewellen, Hubert Lum, Sunil Wahal, and especially Gene
Fama. I thank TD Ameritrade, CEM Benchmarking, the Common Fund, Dimensional Fund Ad-
visors, Greenwich Associates, Hedge Fund Research, Morningstar, Standard and Poor’s, and the
Securities and Exchange Commission for data.

                                                1537
1538                                 The Journal of Finance

affected if he switched to a passive market portfolio? My answer depends on a
key assumption: There is no net transfer between the passive market portfolio
and other investors. The manager of the passive portfolio, for example, does not
lose to or take advantage of other investors when he trades. With this assump-
tion, which I support with empirical evidence below, the return on a passive
market portfolio is the gross market return minus the cost of investing pas-
sively. Thus, a small representative investor who switches to a passive market
portfolio increases his return by the difference between the value-weight aver-
age of all investors’ costs and the cost of investing passively. Equivalently, his
premium for switching is the difference, per dollar invested, between society’s
total cost of investing and the cost in the passive scenario. (The logic here is
similar to the logic of Malkiel (1973), Sharpe (1991), Buffett (2006), and others.)
   The no-net-transfer assumption guarantees that, in aggregate, the search for
trading gains is doomed. Before considering costs, a trading gain for one active
investor must be a loss for another. When we include their higher fees, expenses,
and trading costs, it is clear that active investors are playing a negative sum
game. This does not mean, however, that the cost of active investing is a pure
loss to society. In aggregate, active investors almost certainly improve the accu-
racy of financial prices. This, in turn, improves society’s allocation of resources.
Thus, my estimate of the cost of active investing also measures society’s cost
of price discovery. I offer no evidence on whether society is buying too little or
too much of this good. Price discovery, however, is an externality—each active
investor pays the full cost of his efforts but captures only a tiny slice of the
benefit—so there is no reason to think active investors purchase the optimal
amount of price discovery.
   I limit the scope of the paper by considering only the costs of investing in U.S.
equity. Most of the results are for 1980–2006, but when they are available, I in-
clude data for 2007. The average of the annual estimates for 1980–2006 implies
investors spend 0.67% of the value of all NYSE, Amex, and NASDAQ stocks
each year trying to beat the market.1 Under the no-net-transfer assumption,
this means that an investor who holds a passive market portfolio outperforms
the value-weight average of all active and passive investors by 67 basis points
a year from 1980 to 2006.
   If the expected real return on U.S. equity is roughly 6.7% and we assume
the annual dollar cost of active investing will not increase in the future, soci-
ety’s capitalized cost of price discovery is about 10% of the current value of the
market. Estimates of the equity risk premium in Fama and French (2002) and
Graham and Harvey (2005), however, suggest that the expected real return on
the market is substantially below 6.7%. If so, the capitalized cost of price dis-
covery is above 10% of the current market cap. Moreover, the data imply that
the cost of active investing will grow with the aggregate market cap. This ex-
pected growth pushes the capitalized cost even higher. Thus, 10% of the current
value of the market is a conservative estimate of the capitalized cost of price
discovery.

  1
      Bogle (2008) offers a more inclusive estimate of society’s cost of investing for 2007.
The Cost of Active Investing                       1539

   The first step in my analysis, in Section I, is to estimate the allocation of
publicly traded U.S. equity among groups of investors. Direct holdings by indi-
viduals decline a lot over time. Individuals hold 47.9% of the market in 1980
and only 21.5% in 2007. This decline is matched by an increase in the holdings
of open-end mutual funds, from 4.6% in 1980 to 32.4% in 2007. The shift from
direct holdings to open-end funds has an important implication. Some argue
that mistakes by retail investors are a reliable source of trading gains for other
investors. If so, competition for these gains must be fierce later in the sample
as an expanding group of professional investors fights for a shrinking pool of
mistakes.
   I examine the cost of mutual funds in Section II. Driven by a steady decline in
the loads open-end fund investors pay, the fees and expenses for mutual funds
fall from 2.08% of assets under management in 1980 to 0.95% in 2006. The
investment management costs for institutions, which I estimate in Section III,
are lower. Their value-weight average cost is only 34 basis points in 1980 and
23 basis points in 2006. Institutional costs decline over time for two reasons.
First, the costs they pay for active and passive investments decline. Second, and
more interesting, institutions shift a large portion of their U.S. equity holdings
from active to passive over time.
   In Section IV, I use data on individual hedge funds to estimate the fees clients
pay to invest in U.S. equity-related funds. The average annual hedge fund fee for
1996–2007 is a hefty 4.26% of assets, and, because they pay two layers of fees,
the average for clients who buy through funds of hedge funds is even higher,
6.52% per year. My analysis of trading costs, in Section V, follows Stoll (1993).
I use data from the Securities and Exchange Commission (SEC) to measure
the total commissions and market-making gains brokers and dealers earn by
trading U.S. stocks.
   My bottom line is in Section VI. I compare the resources investors actually
spend in the U.S. market—the fees and expenses paid for mutual funds, the
investment management costs paid by institutions, the fees paid to hedge funds
and funds of funds, and the transaction costs paid by all traders—with what
investors would spend if everyone followed a passive strategy. The difference
between the actual and passive estimates is the cost of active investors’ search
for superior returns.
   Standardized by the total value of NYSE, Amex, and NASDAQ stocks, the
amount investors spend trying to beat the market is surprisingly stable; the
cost is between 61 and 74 basis points in 24 of the 27 years from 1980 to 2006
and in every year after 1990. Although the total amount is relatively constant,
the components change a lot over time. Because the amount invested in mutual
funds increases so much through time, for example, the expenditures on fund
fees and expenses increase from 0.11% of total market cap in 1980 to 0.32% in
2006. The fees for U.S. equity-related hedge fund investments also grow a lot,
from essentially zero early in the period to 0.13% of the total value of U.S. equity
in 2006. These increases are offset by a dramatic drop in the cost of trading.
Despite a sharp increase in trading volume, the aggregate cost of trading U.S.
equity falls from 0.55% of total market cap in 1980 to only 0.21% in 2006. Thus,
1540                        The Journal of Finance

measured relative to the value of U.S. equity, investors shift their expenditures
from trading to asset management, but the total amount spent to beat the
market is never far from the 1980–2006 average of 67 basis points.
   My estimate of the resources consumed in the search for superior returns
does not include several potentially important costs. Retail brokers, for ex-
ample, borrow from their customers at below market rates and make margin
loans to them at above market rates. Although the income from these activities
is part of the revenue firms earn for trading—and part of their customers’ cost
of trading—I miss this in my estimate of the resources investors spend trying
to beat the market. Fees for wealth management, such as financial and estate
planning, are not a cost of active investing, but my estimate should include ad-
visor fees that are for advice about undervalued stocks and winning investment
strategies.
   I intentionally omit transfers between investors. An active investor, for ex-
ample, may pay a large market impact cost to trade quickly. If the counterparty
is a broker, this trading cost is included in the market-making gains the broker
reports to the SEC, and it is in my estimate of the resources society spends to
trade. If the counterparty is another investor, however, the market impact cost
is just a transfer, reducing one investor’s return and increasing another’s by
the same dollar amount. Thus, it is not a cost to society. Similarly, to a taxable
investor choosing between active and passive strategies, the extra tax burden
that typically accompanies active trading is a cost. From society’s perspective,
however, extra taxes are just a transfer, so I do not include them in my estimate
of the resources society spends to beat the market.
   Most security lending payments are also transfers—one investor pays to bor-
row the security and the other receives the payment—so they are appropriately
excluded from my estimate of the cost of active investing. The trading desk that
arranges a security loan, however, typically retains part of the payment as com-
pensation for its services and this does belong in my estimate. Similarly, the
interest retail brokers earn lending securities held in street name is part of
their compensation for providing trading services. The results below miss both
of these costs.
   I overstate the cost of active investing in at least two ways. First, the fees
and expenses I measure include manager compensation. Many managers in-
vest in their own funds, so my estimates include payments managers make to
themselves. This is not much of a problem for mutual funds since managers
own only a small fraction of aggregate fund assets, but it may be significant for
hedge funds.
   More important, I assume most investors switch to a market portfolio in the
passive scenario. (Individuals with direct stock holdings and employee stock
ownership plans continue to hold their actual portfolios.) There are several
reasons, however, why passive investors might choose something other than a
market portfolio. Taxable investors have an incentive to avoid realizing short-
term gains and to defer long-term gains. Investors with specific social concerns
might favor some securities over others. And, in the spirit of Merton (1973) or
Ross (1976), some investors might shift away from the market portfolio because
The Cost of Active Investing                      1541

they prefer a different multifactor risk-return trade-off. To the extent that such
deviations from the market portfolio increase the cost of investing in the passive
scenario, I overstate the incremental cost of active investing.
  Finally, I focus on the monetary cost of active investing, but most active
investors bear a second cost: Their portfolios are not as well diversified as the
market portfolio. The fact that the average investor could increase his return
and lower his risk simply by switching to a passive market portfolio raises
an obvious question. Why do active investors continue to play a negative sum
game? I summarize the paper and address this question in Section VII. An
extensive Appendix completes the paper.


                                I. Allocations
   Table I describes the ownership of U.S. common equity from 1980 to 2007.
Most of the information I use to measure these allocations is from the December
6, 2007 release of the Federal Reserve Board’s Flow of Funds Accounts, which
reports the total amount of corporate equity held by various investor groups.
The adjustments I make to convert these estimates to the allocations in Table
I are described in the Appendix.
   There are several interesting patterns in the allocations in Table I. In 1980
individuals hold the biggest share of U.S. common equity, 47.9%. Direct holdings
shrink to about 27% in 1994–1996, jump back to 36% in 1999, 2000, and 2001,
and then fall steadily to only 21.5% at the end of October 2007. The growth in
open-end mutual funds is equally dramatic, from 4.6% in 1980 to 32.4% in 2007,
and although the yearly changes are not perfectly aligned, the total increase
about matches the reduction in direct holdings.
   The shift from direct holdings to open-end funds has at least two important
implications. First, in the analysis below, only the fees and expenses for hedge
funds are higher than those for open-end funds. Since I assume there are no
fees or expenses associated with direct holdings, the shift to funds pushes up
my estimate of society’s cost of investing. But there is also a benefit. Most
people who hold stocks directly are more poorly diversified. (See, for example,
Barber and Odean (2000), or Goetzmann and Kumar (2008).) Thus, although
the shift to open-end funds increases my estimate of society’s overall cost of
investing, it also reduces the typical investor’s risk. Second, some claim that
retail investors are a reliable source of trading gains for mutual funds, hedge
funds, and other institutional investors. If so, the shift from direct holdings to
open-end funds suggests these gains become scarcer later in the sample as an
expanding pool of professional managers competes for a shrinking pool of retail
mistakes.
   The Fed’s allocations include not only the U.S. equity I focus on, but also
foreign equity owned by U.S. residents and institutions. Table I reports the value
of these foreign holdings as a fraction of U.S. investors’ total equity portfolio.
Readers familiar with the literature seeking to explain why investors do not
diversify internationally (e.g., French and Poterba (1991), Karolyi and Stulz
(2003), and Ahearne, Griever, and Warnock (2004)) may be surprised that this
Table I
                        Allocation of Publicly Traded U.S. Common Equity, in Percent, 1980–2007
                                                                                                                                                                  1542


The table reports the percent of U.S. equity held by various investors. Most of the data are from the December 6, 2007 release of the Federal Reserve’s Flow
of Funds Accounts. The steps used to compute the allocations are described in the Appendix. Direct holdings is the fraction of U.S. equity held by individuals.
The allocation to closed-end funds, CEFs, includes unit investment trusts. The holdings of foreign investors are included in the other categories and foreign
holdings is the fraction of U.S. investors’ equity portfolio in foreign stock.

          Direct      Open-end                          DB        DC                  Public                   Banks and      Hedge      Foreign     Foreign
         Holdings      Funds        CEFs      ETFs     Plans     Plans     ESOPs      Funds     Nonprofits     Insurance      Funds     Investors    Holdings

1980       47.9          4.6         0.5       0.0     18.1       3.9        2.8       4.4          8.3           9.4          0.0         7.6           2.0
1981       45.9          4.4         0.5       0.0     19.0       3.7        3.5       5.1          7.9          10.1          0.0         8.1           1.9
1982       42.4          5.0         0.4       0.0     21.1       3.5        4.6       5.5          7.2          10.2          0.0         8.2           1.7
1983       39.5          6.3         0.4       0.0     21.4       3.4        5.0       6.7          6.7          10.5          0.0         8.4           2.2
1984       37.3          7.0         0.3       0.0     21.8       3.0        6.7       7.4          6.3          10.2          0.0         8.4           2.2
1985       35.4          7.6         0.3       0.0     22.5       3.3        7.7       7.2          6.0          10.1          0.0         8.4           2.9
1986       37.4          9.4         0.4       0.0     20.3       2.6        6.6       7.6          6.2           9.4          0.0         9.7           4.1
1987       36.1         10.4         0.6       0.0     18.4       3.9        6.9       8.5          6.0           9.3          0.0         9.9           5.2
1988       39.3          9.6         0.7       0.0     15.5       3.8        6.1       9.5          6.5           8.9          0.0        10.2           6.4
1989       38.3         10.3         0.7       0.0     14.8       3.7        6.6       9.9          7.2           8.5          0.0        10.6           7.8
1990       35.4         10.5         0.9       0.0     15.3       4.3        6.4      11.1          7.6           8.2          0.3        10.1           8.5
1991       35.0         10.4         0.9       0.0     15.5       4.0        6.9      11.8          6.3           8.7          0.4         9.3           9.1
1992       33.0         12.4         0.9       0.0     14.9       3.8        7.4      11.9          6.5           8.6          0.5         9.0           9.4
1993       29.7         15.7         0.9       0.0     14.4       4.1        7.4      11.8          6.1           9.1          0.8         8.6          13.7
                                                                                                                                                                  The Journal of Finance


1994       26.8         17.9         1.0       0.0     14.1       4.3        6.9      11.9          6.8           9.5          0.8         8.9          15.4
1995       26.7         19.6         1.1       0.0     13.2       4.1        6.3      12.3          6.6           9.5          0.7         9.2          14.7
1996       27.2         22.2         1.1       0.0     11.5       3.9        5.4      12.1          6.5           9.3          0.8         8.8          14.8
1997       29.5         23.4         1.0       0.1      9.8       3.9        4.4      11.7          6.1           9.3          0.8         9.4          13.6
1998       30.2         24.3         1.0       0.2      9.2       4.3        4.0      11.1          5.8           9.4          0.7        10.4          13.9
1999       36.0         24.7         0.8       0.2      7.4       3.5        3.1       9.9          4.9           8.9          0.6        10.3          14.3
2000       36.2         24.4         0.6       0.5      8.1       3.6        2.6       9.5          4.6           9.1          0.7        10.8          13.7
2001       36.0         23.6         0.5       0.7      8.8       3.5        3.0      10.0          4.0           9.2          0.8        11.4          13.1
2002       32.1         23.7         0.5       1.1      9.9       3.6        3.0      10.8          3.6          10.5          1.3        12.3          14.5
2003       29.9         25.5         0.6       1.2      9.8       3.7        3.2      11.0          3.4          10.4          1.3        13.2          16.8
2004       27.1         27.6         0.8       1.6      9.7       3.9        3.1      11.0          3.1          10.7          1.4        13.6          18.6
2005       26.1         28.8         0.9       2.0      9.1       3.9        3.0      10.9          2.9          10.8          1.5        14.0          22.3
2006       24.2         30.5         1.0       2.5      8.6       4.0        2.8      10.7          2.6          11.2          1.9        15.1          25.3
2007       21.5         32.4         1.1       3.0      8.5       3.8        2.8      10.6          2.3          11.8          2.2        16.3          27.2
The Cost of Active Investing                        1543

fraction grows from 2.0% in 1980 and 8.5% in 1990 to a substantial 27.2% in
2007. Thus, in 2007 more than one-fourth of the average U.S. investor’s equity
portfolio is in foreign stocks.
   Table I shows a fairly steady decline in the share of U.S. equity owned by
foundations, endowments, and other nonprofits, from 8.3% in 1980 to 6.0%
in 1985 and 2.3% in 2007. One might be tempted to attribute the decline to
the well-known shift by endowments toward alternative investments. However,
Greenwich Associates, a consulting and research firm, reports that the fraction
of endowment assets invested in domestic equity drops by less than one-third
between 1985 and 2006, from 47.4% to 34.2%, so this is not the full explanation.
Part of the decline may be an artifact of the process I use to disentangle allo-
cations to nonprofits and households in the Flow of Funds Accounts (described
in the Appendix). If so, the decline in the direct holdings of individuals is even
bigger than the estimates in Table I imply.
   The allocation to defined contribution (DC) plans in Table I remains close to
4% throughout the period, but this is a bit misleading. To avoid double counting,
the allocations to DC and defined benefit (DB) plans in Table I do not include
the mutual funds they own. The omission has only a modest impact on the
estimates for DB plans, but it has a big impact on the estimates for DC plans.
Supplemental data in the Flow of Funds Accounts imply that the mutual fund
holdings of DC plans grow from 0.3% of the value of the U.S. market in 1985
to a substantial 8.5% in 2006. Although these estimates include fixed income
and foreign equity funds, it is clear that by 2006 DC plans own much more U.S.
equity than the 3.8% allocation in Table I suggests.
   Finally, in terms of their net holdings of U.S. equity, hedge funds are relatively
unimportant. They grow from 0.3% of U.S. equity in 1990 to 2.2% in 2007. But
we shall see that hedge funds play a big role when we look at costs.


            II. Average Fees and Expenses for Mutual Funds
   My estimates of the resources spent trying to beat the market combine the
allocations to various groups, in Table I, with estimates of each group’s cost
of investing. To be conservative, I assume the only expenses individuals incur
when they hold shares directly are trading costs, which are included in the ag-
gregate estimates below. I ignore, for example, the time they spend managing
their portfolios and the cost of subscriptions to Value Line and Morningstar.
Similarly, I assume employee stock ownership plans (ESOPs) have no invest-
ment management costs.
   I use reported expense ratios, from the mutual fund database maintained by
the Center for Research in Security Prices (CRSP), and estimates of annuitized
loads, from the Investment Company Institute (ICI), to measure the cost of in-
vesting in open-end funds. The average expense ratios in Table II weight funds
by their assets under management at the beginning of the year, and include
only those that invest predominantly in U.S. common equity. (The Appendix
describes the steps used to identify U.S. equity funds. Fama and French (2008)
analyze the returns on this set of funds.)
1544                               The Journal of Finance

                                             Table II
    Fees and Expenses for Mutual Funds, in Basis Points, 1980–2006
The expense ratio for open-end mutual funds is the value-weight average of the reported values for
U.S. equity funds in the CRSP mutual fund database. The annuitized load is from the Investment
Company Institute and measures the value-weight average load paid by investors in equity funds.
Total is the sum of the open-end expense ratio and annuitized load. Percent passive is also from the
ICI and measures the fraction of U.S. equity fund assets invested in index funds. The value-weight
average expense ratios for U.S. equity closed-end funds (CEFs) and U.S. equity exchange-traded
funds (ETFs) are estimated using data from Morningstar.

                               Open-end Mutual Funds                              Expense Ratio
              Expense       Annuitized                        Percent
               Ratio          Load             Total          Passive          CEFs           ETFs

1980             70             149             219
1981             71             167             237
1982             75             128             203
1983             76             113             190
1984             82             114             196             1.0
1985             80             105             185             1.1
1986             81             101             183             0.8
1987             86              96             182             0.9
1988             96              97             193             1.2
1989             94              84             178             1.6
1990             93              76             169             2.3
1991             90              65             155             2.9
1992             96              59             155             3.6
1993             96              50             146             3.9
1994             98              47             145             3.9
1995             96              42             139             4.7
1996             93              40             134             5.8
1997             92              35             126             7.3
1998             90              30             120             9.0
1999             91              27             117             9.7
2000             96              24             119             9.8              96
2001             97              19             116            10.9              92            20
2002             98              18             116            12.4             101            17
2003             96              17             113            12.4              98            18
2004             91              18             108            12.7             104            19
2005             87              16             103            12.5             103            20
2006             85              15             100            12.6             109            21


  The value-weight average expense ratio for open-end funds grows from 70
basis points in 1980 to 96 basis points in 1988. It remains in a narrow band
over the next 14 years and then falls from 98 basis points in 2002 to 85 in 2006.
One might suspect that the decline in the average expense ratio at the end of
the period ref lects a shift from active open-end funds to lower priced passive
funds. Table II shows that there is a shift to passive funds, from 1.0% of fund
assets in 1984 to 12.4% in 2002, but it occurs before the average expense ratio
falls. The growth of exchange-traded funds (ETFs) and competitive pressure
from passive open-end funds, however, probably contribute to the decline.
The Cost of Active Investing                     1545

   The behavior of the average annuitized load in Table II is striking. It falls
almost monotonically from 149 basis points in 1980 to only 15 basis points in
2006. (Barber, Odean, and Zheng (2005) make a similar point.) This drop, which
is driven mostly by a shift toward no-load funds, has a big impact on the total
fees and expenses paid by investors. The annual costs of open-end funds shrink
from 2.19% of assets under management at the beginning of the period to 1.00%
at the end.
   Because closed-end funds and ETFs trade on exchanges, customers pay bro-
kerage commissions rather than loads when they buy and sell these funds. The
commissions are part of the aggregate trading costs measured below. Thus, I
include only expense ratios in the fees and expenses for investments in U.S.
equity closed-end funds and ETFs. The data I have on these funds, from Morn-
ingstar, are not as complete as those for open-end funds; I can compute annual
value-weight average expense ratios for closed-end funds only from 2000 to
2006 and for ETFs from 2001 to 2006. I use the averages of these annual esti-
mates before 2000 and 2001. Fortunately, ETFs are 0.5% or less of U.S. equity
before 2001 and the allocation to closed-end funds never exceeds 1.1%, so im-
precise estimates of the annual average expense ratios have little effect on my
results. The average of the annual estimates for U.S. equity closed-end funds
in Table II, 1.01%, is a bit higher than the average expense ratio for open-end
funds over the same period, 0.93%. The 2001–2006 average for ETFs is only
19 basis points, which is not surprising given that most ETFs are variants of
passive funds in that period.


                           III. Institutional Costs
   The information I use to measure the investment expenses of institutional
investors comes from two sources. CEM Benchmarking, Inc., a Toronto-based
firm that monitors the investment activities of pension plan sponsors, provided
annual estimates of the costs incurred by DB and DC plans when they make
active and passive investments in the U.S. stock market. I combine these with
estimates of the active and passive U.S. equity allocations of institutional in-
vestors from Greenwich Associates.
   The Greenwich estimates are from surveys of DB plans, DC plans, public
funds, and nonprofits, which include foundations and endowments through
1999 and only endowments thereafter. Greenwich has conducted surveys annu-
ally since 1986 and the respondents control a substantial portion of all institu-
tional investments. For example, 1,950 institutions with more than six trillion
dollars participated in the 2006 survey.
   The results of the Greenwich surveys are in Table III. All four groups of
institutions increase their allocation to passive over time. DB plans show the
smallest increase, from 21.1% in 1986 to 31.2% in 2006. Nonprofits start with
a meager 2.8% of their U.S. equity holdings invested passively, but finish with
28.7%. Public funds have the highest passive allocation throughout the period,
with 25.8% in 1986 and a substantial 52.7% in 2006.
1546                               The Journal of Finance

                                             Table III
  Percent of U.S. Equity Investments Allocated to Passive Strategies
     by Institutions and Investment Management Costs Incurred
               by Institutions, in Basis Points, 1986–2006
The percent invested passively, from Greenwich Associates, is the value-weight average fraction
of their U.S. equity investments institutions allocate to passive strategies. The four institutional
groups are defined benefit (DB) plans, defined contribution (DC) plans, public funds, and nonprofits,
which include foundations and endowments through 1999 and only endowments thereafter. The
passive and active investment management costs for DB plans are value-weight averages, from
CEM benchmarking. The investment management costs for DB plans, public funds, and nonprofits
are weighted averages of the passive and active DB costs. The investment management costs for
DC plans use the annual passive and active DB costs plus the average annual difference between
DC and DB costs. The average difference is 3.4 basis points for passive and 18.2 basis points for
active. I use the 1991 estimates of passive and active costs for 1986–1990.

                                                          Investment Management Cost
            Percent Invested Passively
                                                 DB Plans
        DB      DC                                                 DB      DC
       Plans   Plans   Public   Nonprofits   Passive     Active   Plans   Plans   Public   Nonprofits

1986    21.1    17.9    25.8        2.8                            34      50      32         39
1987    24.6    26.2    29.0        9.6                            32      46      31         37
1988    22.3    29.6    39.0        9.2                            33      45      28         37
1989    25.6    29.7    46.0       12.7                            31      45      25         36
1990    28.5    29.4    43.1       12.5                            31      43      26         36
1991    32.5    31.9    44.6       14.3         7.9      40.4      30      43      28         36
1992    26.8    35.0    39.2       11.1         5.9      42.1      32      42      28         37
1993    25.6    33.8    46.4       17.0         6.7      43.1      34      44      26         37
1994    27.8    31.7    43.4       19.0         7.4      45.4      35      47      29         38
1995    27.5    32.2    40.0       23.8         6.0      43.4      33      45      28         34
1996    30.7    32.1    48.5       23.2         5.4      37.9      28      41      22         30
1997    29.5    33.7    52.2       18.1         4.9      36.3      27      39      20         31
1998    27.1    30.6    52.9       17.9         4.6      34.2      26      39      19         29
1999    30.0    34.0    54.2       20.2         3.8      34.0      25      37      18         28
2000    29.4    35.1    57.1       20.7         4.3      35.6      26      38      18         29
2001    30.5    32.5    51.9       22.0         4.5      37.2      27      40      20         30
2002    30.4    35.0    52.4       23.5         4.2      41.3      30      41      22         33
2003    32.7    34.6    55.2       36.4         2.8      37.8      26      39      18         25
2004    34.4    33.2    53.6       29.4         2.6      35.8      24      38      18         26
2005    31.2    34.6    53.7       25.8         2.7      37.0      26      38      19         28
2006    31.2    35.7    52.7       28.7         2.9      36.0      26      37      19         27


  CEM Benchmarking’s estimates of the cost of active and passive investing
are based on a smaller sample of institutions. In 2006, for example, CEM has
information on 141 DB plans and 99 DC plans. CEM tends to focus on larger
plans, however, so those in the 2006 sample have 2.78 trillion dollars in total
assets, with more than one trillion invested in publicly traded U.S. equity. The
underrepresentation of smaller institutions probably has little impact on my
estimates of the cost of active investing. First, because they have more assets
to invest, larger institutions are more important for the aggregate values I am
The Cost of Active Investing                      1547

trying to measure. Second, estimates of what society spends to beat the market
depend on the difference between the costs of active and passive investing.
CEM’s emphasis on large plans may reduce my overall estimates of the insti-
tutional cost of investing, but because economies of scale affect both active and
passive costs, it has less effect on the difference.
   CEM provides annual value-weight averages of the costs incurred by DB
and DC pension plans for passive and active investments in U.S. common eq-
uity. The costs include auditing, consulting, oversight, and custodial charges,
compensation and other employee costs, and investment management fees for
externally managed strategies. The estimates for DB plans, which are avail-
able for 1991–2006, are in Table III. As expected, active strategies cost a lot
more than passive strategies. The average of the annual estimates for active,
38.6 basis points, is eight times the average for passive, 4.8 basis points. Both
passive and active costs decline over time. The average cost for active strategies
in DB plans falls from 40.4 basis points in 1991 to 36.0 basis points in 2006,
and the average cost for passive strategies falls from 7.9 basis points to only
2.9 basis points. The decline in costs is not caused by a change in the DB plans
sampled. Similar declines are observed if the sample is limited to only plans
with data for the whole 16-year period.
   My annual estimates of the costs paid by (i) DB plans, (ii) public plans and
state and local governments, and (iii) foundations, endowments, and other non-
profits, in Table III, combine the average costs of passive and active strategies
in DB plans from CEM with the allocations between passive and active from
Greenwich. Specifically, the investment management cost for a group is the
passive cost for DB plans times the group’s allocation to passive strategies plus
the active cost times the group’s allocation to active strategies. Since the CEM
data are not available before 1991, I use the 1991 estimates of the cost of active
and passive strategies for 1986–1990.
   The CEM data for DC plans do not start until 1997. Perhaps because the
sample of DC plans is smaller than the sample of DB plans, the annual cost
estimates for DC plans (not reported) are more volatile than the estimates for
DB plans. Because of this volatility, I use the annual DB cost plus the average
difference between the costs for DC and DB plans for 1997–2006 to measure
the annual cost of active and passive DC strategies. The investment costs for
DC plans are generally higher than the costs for DB plans. The average differ-
ence is 3.4 basis points for passive strategies and 18.2 basis points for active
strategies.
   The estimated costs for all four institutional groups in Table III decline be-
tween 1986 and 2006. The smallest drop is for DB plans, from 34 to 26 basis
points. The cost for each of the other three groups declines by 12 or 13 basis
points—from 50 to 37 basis points for DC plans, from 32 to 19 basis points for
public funds, and from 39 to 27 basis points for nonprofits. These reductions are
the result of the decline in the costs of active and passive strategies and, more
important, the shift over time from active to passive investments. This shift
toward passive strategies is in sharp contrast to the contemporaneous growth
of hedge funds, examined next.
1548                              The Journal of Finance

                                  IV. Hedge Fund Fees
   Hedge fund fees often have two components. A fee of “2 and 20,” for example,
means that investors pay an annual management fee of 2% of the assets in the
fund plus a performance fee of 20% of profits. Because of the performance fee,
the aggregate compensation paid to hedge fund managers each year depends on
the specific return earned by each fund in the industry. I use data from Hedge
Fund Research (HFR) to estimate the fees on individual hedge funds and funds
of hedge funds from May 1996 to December 2007.
   Hedge funds trade stocks, bonds, currencies, and other securities in markets
around the world. Since I am measuring the resources spent trying to beat the
U.S. stock market, I have to estimate the fraction of hedge fund assets used in
U.S. equity strategies. HFR assigns hedge funds to one of several categories,
such as merger arbitrage, event driven, and sector funds. I use their categories
to sort funds into three groups. I assume funds in the first group use 100% of
their assets for equity strategies, those in the second use 50%, and those in the
third do not use any of their assets for equity trading. I then use the weight of
the U.S. in the world equity portfolio to estimate the fraction of equity-related
assets used for trading in the U.S. (The Appendix describes this process in
detail.)
   Table IV shows HFR’s annual estimates of the assets invested in the hedge
fund industry and my estimates of the assets in U.S. equity-related strate-
gies. Total hedge fund assets grow rapidly during the sample period, from less
than 40 billion dollars in 1991 to 185.8 billion in 1996 and 1,464.5 billion at
the beginning of 2007. Investment in U.S. equity-related strategies keeps pace
with the total; at the beginning of 2007 there are 458.6 billion dollars in these
strategies.2
   A large fraction of hedge fund assets is held by funds of funds. In 2007,
for example, 655.9 billion dollars—about 45% of all hedge fund assets—are
invested in funds of funds. The HFR database puts all funds of funds in the
same category, so I am unable to isolate those that focus on U.S. equity-related
strategies. In the analysis below I assume that funds of funds are invested
proportionately between hedge funds that are related to U.S. equity and those
that are not.
   Table IV also reports annual value-weight averages of the fees for funds of
funds and U.S. equity-related hedge funds for 1996–2007. Quoted hedge fund
fees increase over the sample period. The value-weight average management
fee rises from 0.92% in 1996 to 1.28% in 2007, and the average quoted per-
formance fee rises from 18.24% to 19.15% over the same period. There is less
variation in the average management fee for funds of funds, but their average
quoted performance fee declines a lot over time, from 9.45% in 1996 and 11.41%
in 1998 to 6.94% in 2007.


   2
     Because hedge funds use leverage and take long and short positions, the total assets in U.S.
equity-related strategies, in Table IV, differ from the net holdings of U.S. equity implied by the
allocations in Table I. The Appendix explains how I calculate the estimates in both tables.
Table IV
       Assets Invested in Hedge Funds and Funds of Hedge Funds, 1991–2007, and Hedge Fund and Fund
                                          of Fund Fees, 1996–2007
Assets invested are in billions of dollars and are measured at the beginning of the year. The total for all hedge funds is from Hedge Fund Research (HFR). I use
HFR’s categorization of funds and the U.S. weight among all developed equity markets to estimate the U.S. equity-related hedge fund assets. The estimate of U.S.
equity-related fund of fund assets assumes funds of funds invest proportionately among hedge fund categories. All but the last column of fees are value-weight
averages of individual fund fees computed using the HFR database and are in percent. The last column is in billions of dollars. The management fee (Mgmt Fee)
is a fixed percent of assets in the fund. The quoted performance fee is a fraction of the fund’s profits. The actual performance fee is measured relative to the
beginning-of-year assets. The Appendix describes how the actual performance fee is computed. Averages of the annual fees (and standard errors) are reported for
1996–2007 and 2000–2007. The data for 1996 start in May. The management fee and quoted performance fee for 1996 are annualized, but the actual performance
fee is not.

                                                                                                        Fees
                        Assets Invested
                                                      U.S. Equity-related Hedge Funds                    Funds of Hedge Funds
                           U.S. Equity-related                                                                                               Hedge Fund plus
                All
                                                               Performance Fee                             Performance Fee                    Fund of Fund
               Hedge      Hedge      Funds of      Mgmt                                        Mgmt
               Funds      Funds       Funds         Fee       Quoted      Actual     Total      Fee       Quoted      Actual     Total      Percent     Dollars

1991             38.9        8.3            0.4
1992             58.4       14.1            4.8
1993             95.7       24.9            9.6
1994            167.8       39.8           17.9
1995            167.4       38.6           17.2
1996            185.8       46.2           14.0     0.92      18.24        3.79       4.71      1.16       9.45        3.41       4.57        9.27         2.8
1997            256.7       72.4           14.8     1.05      18.40        5.40       6.45      1.28       9.29        2.57       3.85       10.30         5.2
1998            367.6      126.5           25.5     0.98      18.25        2.56       3.54      1.18      11.41        0.21       1.39        4.93         4.8
                                                                                                                                                                   The Cost of Active Investing


1999            374.8      141.4           28.6     1.03      18.24        5.91       6.94      1.33       8.24        1.68       3.01        9.95        10.7
2000            456.4      176.1           29.4     1.09      18.42        2.35       3.44      1.26       7.99        0.38       1.64        5.08         6.5
2001            490.6      203.3           34.6     1.20      18.93        1.51       2.71      1.24       7.22        0.27       1.51        4.22         6.0
2002            539.1      243.4           46.3     1.24      19.09        1.38       2.62      1.11       7.12        0.34       1.45        4.07         7.0
2003            625.6      253.1           83.7     1.25      19.12        3.40       4.65      1.14       6.96        1.23       2.37        7.02        13.8
2004            820.0      313.4          112.1     1.23      19.03        2.28       3.51      1.12       6.98        0.78       1.90        5.41        13.1
2005            972.6      348.1          128.4     1.26      19.03        2.18       3.44      1.15       7.09        0.47       1.62        5.06        14.1
2006           1105.4      372.8          133.1     1.27      18.95        3.25       4.52      1.17       7.12        0.76       1.93        6.45        19.4
2007           1464.5      458.6          205.4     1.28      19.15        3.35       4.63      1.12       6.94        0.73       1.85        6.48        25.0
1996–2007                                           1.16      18.74        3.11       4.26      1.20        7.98       1.07       2.26        6.52
                                                   (0.03)     (0.11)      (0.41)     (0.39)    (0.02)      (0.41)     (0.29)     (0.30)      (0.63)
2000–2007                                           1.23      18.97        2.46       3.69      1.16        7.18       0.62       1.78        5.47
                                                                                                                                                                   1549


                                                   (0.02)     (0.08)      (0.28)     (0.29)    (0.02)      (0.12)     (0.11)     (0.10)      (0.38)
1550                             The Journal of Finance

   The often mentioned “2 and 20” overstates the typical hedge fund fee. In 2007,
for example, the value-weight average management fee is 1.28%, not 2%, and
the value-weight average quoted performance fee is 19.15%, not 20%. (These
averages do not change much if I use all funds, not just U.S. equity-related
assets.) The standard “1 and 10” is a better description of the average manage-
ment fee for funds of funds, but it overstates the average quoted performance
fee by about 3% after 2001.
   How much do hedge fund investors pay to beat the market? Averaging over
the annual value-weight averages for 1996–2007, the typical investor in U.S.
equity-related hedge funds pays a management fee of 1.16% of assets and a
realized performance fee of 3.11%. Equivalently, the hedge fund industry must
generate average annual abnormal returns of 4.26% over this period for the
typical investor to break even. The average performance fee is extraordinarily
high in 2 of the first 4 years of the sample, 5.40% in 1997 and 5.91% in 1999.
If we focus on the results for 2000–2007, the average drops a bit, but investors
still pay an annual combined fee of 3.69% over this 8-year period.
   Hedge fund clients who invest through funds of funds pay two layers of fees.
Averaging over the annual averages for 1996–2007, the typical fund of fund
investor pays 2.26% in fund of fund fees and 4.26% in hedge fund fees. Thus,
the underlying hedge funds must generate an average abnormal annual return
of 6.52% for him to break even. If we throw out the first 4 years, the averages
are lower—1.78% for the fund of fund fee and 5.47% for the total fee—but the
threshold for investor success is still high.3
   These estimates include only hedge fund and fund of fund fees. Among other
things, they ignore the legal expenses, accounting and auditing fees, custody
costs, and board fees that are paid by the funds. Although I am not able to
measure these costs for hedge funds, I can use data from CRSP to infer the cost
of comparable services for mutual funds. Specifically, the cost is the difference
between a mutual fund’s reported expense ratio and the sum of its management
and 12b-1 fees, which are both available in the CRSP database after 2000. The
average of the annual value-weight averages for U.S. equity mutual funds for
2001 to 2006 is 21 basis points.
   My estimates of hedge fund costs also miss most of the payments they make
to their prime brokers. These include financing costs, security lending fees, and
charges for settling transactions done at other brokers. I do, however, capture
the trading costs of hedge funds in the estimates I discuss next.


                                    V. Trading Costs
  Stoll (1993) develops a simple way to measure the aggregate cost of trading.
The total commissions, bid-ask spreads, and other costs investors pay for trad-
ing services must equal the total revenue brokers and dealers receive for those

  3
    Brown, Goetzmann, and Liang (2004) use the TASS hedge fund database to estimate realized
performance fees for 1995–2003, and their annual average is higher than mine in 6 of the 8 years
our periods overlap.
The Cost of Active Investing                      1551

services. As Stoll (1993) shows, one can measure this revenue with informa-
tion from the Financial and Operational Combined Uniform Single (FOCUS)
reports that registered securities firms must file with the Securities and Ex-
change Commission each year. The trading revenue in the FOCUS reports in-
cludes commissions, which firms earn when they facilitate agency trades as a
broker, and the gains or losses firms earn from market making. The process I
use to extract this information, which is described in the Appendix, is almost
identical to that used in Stoll (1993).
   The FOCUS reports do not allow me to estimate three important components
of trading revenue. Firms trading for retail investors are able to borrow money
from clients at below market rates (typically through cash sweep accounts),
make margin loans to clients at above market rates, and earn revenue by lend-
ing securities held in street name, including those in margin accounts.
   Consider Charles Schwab, a large discount brokerage firm. The firm’s finan-
cial statements show that in 2006 Schwab brokerage clients had an average
daily balance of 17.86 billion dollars in interest-bearing cash accounts, with an
average return of 2.38%. At the same time, Schwab lent clients 10.25 billion
in margin loans at an average rate of 8.17%. As a rough estimate, the 5.79%
spread in interest implies Schwab added 590 million dollars to its 2006 revenue
by borrowing 10.25 billion dollars from some clients and lending it to others.
And that still leaves 7.61 billion in the cash accounts. If Schwab invested this
money in 30-day Treasury bills, which returned 4.81% in 2006, the opportunity
to borrow 7.61 billion at 2.38% added another 185 million to its income. The
total revenue Schwab earned by borrowing from and lending to its brokerage
clients in 2006, 775 million dollars, almost matches the 785 million it reported
in commissions and trading gains for the year.
   Of course, this revenue is not free. In a competitive market, it is simply part
of the compensation Schwab and other firms receive for providing brokerage
services. This revenue and the revenue retail brokers earn by lending securities
held in street name belong in my estimates of the total cost of trading. Unfor-
tunately, I cannot isolate this income in the FOCUS data and few firms provide
Schwab’s level of detail in their financial statements. As a result, the revenue
is missing from my estimates of trading costs.
   Before turning to the estimates of cost, it is useful to look at the amount
of trading investors do each year. Figure 1 shows the annual turnover of U.S.
stocks from 1926 to 2007. The estimates use data from CRSP and include NYSE,
Amex (starting in July 1962), and NASDAQ (1973) stocks with share codes of
10 or 11. (The Appendix explains how I deal with the double counting of trades
on NASDAQ.) The turnover for a year is the sum of the 12 monthly estimates,
which I measure as the ratio of the total dollar volume for the month (shares
traded times beginning-of-month price) divided by the total market cap at the
beginning of the month.
   The general pattern in Figure 1 is striking. Turnover is above 110% in the
1920s. It reaches a high of 143% in 1928, then plunges with the market to 52%
in 1932. By 1938 it is below 20%. In light of recent experience, it is perhaps
surprising that annual turnover remains close to or below 20% from 1938 to
1552                        The Journal of Finance


Figure 1. Annual turnover of NYSE, Amex, and NASDAQ stocks, in percent, 1926–2007.


1975. Turnover rises fairly steadily over the next three decades from 20% in
1975 and 59% in 1990, to an impressive 173% in 2006 and 215% in 2007.
   Because they are not operating companies with CRSP share codes of 10 or
11, ETFs are not in the turnover in Figure 1. During the last few years of
the sample, however, ETFs are heavily traded. Standard & Poor’s Depository
Receipts (Spiders) are the most extreme, with total volume of 2.3 billion dollars
in 2006 and 5.9 billion in 2007. If I include domestic equity ETFs in my measure,
aggregate turnover jumps from 173% to 208% in 2006 and from 215% to 284%
in 2007.
   What explains the extraordinary growth in trading between 1975 and 2007?
Reduced costs are surely part of the story. The introduction of negotiated bro-
kerage commissions in 1975, the development of electronic trading networks,
the decimalization of stock prices in 2000 and 2001, and the SEC’s implemen-
tation of rules designed to increase market transparency and liquidity, such as
Reg NMS, all reduce the cost of trading U.S. equities during this period. But
even at the end of the sample, trading is not free. From the perspective of the
negative sum game, it is hard to understand why equity investors pay to turn
their aggregate portfolio over more than two times in 2007.
   The estimates from the FOCUS data, in Table V, confirm that the cost of
trading falls a lot between 1980 and 2006. In fact, despite the explosive growth
of trading during the last 6 years of the period, the total amount investors pay
to trade declines by more than 35%, from 50.7 billion dollars in 2000 to 32.1
billion in 2006. The decline in the cost of trading is even more striking if we
The Cost of Active Investing                                1553

                                            Table V
 Annual Revenue Received by Securities Firms for Executing Trades
                    of U.S. Equity, 1980–2006
The data come from the FOCUS reports that broker and dealers file annually with the SEC.
Commissions from exchange trades and OTC trades are commissions received for executing trades
on an exchange and over the counter. Gains from market making include trading profits from
OTC equities, gains on derivative trading desks in equity products, and gains on firm security
trading accounts with associated hedges. Total revenue and the three components of total revenue
are measured in billions of dollars. The Appendix describes how these values are calculated. Cost
relative to volume, in basis points, is total revenue divided by total dollars traded on the NYSE,
Amex, and NASDAQ.

                Commissions from
             Exchange           OTC             Gains from             Total        Cost Relative
              Trades           Trades          Market Making          Revenue        to Volume

1980            4.1              1.0                 1.0                6.1             146
1981            3.8              1.1                 0.8                5.8             131
1982            4.3              1.2                 0.9                6.4             117
1983            5.9              2.0                 1.9                9.8             106
1984            5.0              1.7                 1.3                8.0              88
1985            5.8              2.2                 1.8                9.7              82
1986            7.2              2.8                 2.5               12.5              73
1987            8.7              3.2                 2.6               14.5              63
1988            6.2              2.5                 2.0               10.7              66
1989            7.2              2.6                 2.2               12.1              64
1990            6.1              2.6                 2.0               10.7              64
1991            7.2              3.3                 3.2               13.8              71
1992            7.8              4.1                 3.9               15.8              69
1993            9.1              5.3                 4.8               19.2              64
1994            8.6              5.2                 4.5               18.3              57
1995           10.3              6.5                 5.5               22.2              51
1996           11.3              8.3                 6.6               26.2              45
1997           13.2              9.5                 7.2               29.8              37
1998           14.6             10.4                 7.7               32.7              32
1999           16.3             14.2                 9.3               39.8              27
2000           18.2             17.6                14.9               50.7              23
2001           16.3             12.7                 8.0               36.9              23
2002           16.0             12.8                 4.6               33.4              21
2003           14.0             13.8                 3.8               31.7              22
2004           13.8             15.0                 3.6               32.4              16
2005           13.0             13.9                 3.9               30.7              13
2006           12.2             13.7                 6.2               32.1              11


standardize by the amount traded. Measured relative to total volume, the cost
of trading declines (or remains constant) in all but 3 years between 1980 and
2006. The cumulative effect is a 92% reduction in trading costs, from 146 basis
points in 1980 to a tiny 11 basis points in 2006. As we see next, this reduction
has a significant effect on the resources investors spend in their search for
superior returns.
1554                                 The Journal of Finance

                     VI. The Cost of Trying to Beat the Market
  Table VI summarizes my estimates of the amount society pays to invest in
the U.S. stock market. There are four components: the fees and expenses paid
by those who purchase open-end funds, closed-end funds, and exchange-traded
funds; investment management costs paid by institutions; fees paid by hedge
fund investors; and trading costs paid by all investors. To make the costs easier
to interpret, I standardize each year’s dollar cost by the average capitalization

                                                Table VI
 Society’s Standardized Cost of Investing, in Basis Points, 1980–2006
The standardized cost is the total dollar cost of investing divided by the aggregate market cap, which is
the average of the 12 beginning-of-month values of all NYSE, Amex, and NASDAQ stocks with CRSP
share codes of 10 or 11. The aggregate market cap is in billions of dollars. The contribution of mutual
funds to the standardized cost is the total percent of U.S. equity in funds, from Table I, (Allocation, in
percent) times the value-weight average of the fees and expenses of mutual funds, in Table II (Fees,
in basis points). Similarly, the contribution of institutions is the sum of their allocations, from Table I,
times the average of their investment management costs, from Table III. The contribution of hedge
funds is the dollar cost of hedge fund and fund of fund fees, in Table IV, divided by total market cap,
and the contribution of trading costs is the dollar cost, in Table V, divided by total market cap. The
four components of the standardized cost and the total standardized cost are in basis points.

                                                                        Standardized Cost
                   Mutual Funds         Institutions
       Market                                 Mutual             Hedge
        Cap   Allocation Fees Allocation Fees Funds Institutions Funds Trading Total

1980    1,103        5.2       208      46.9       34       11          16                    55       82
1981    1,269        4.9       225      49.1       33       11          16                    46       73
1982    1,166        5.5       196      52.1       32       11          17                    55       82
1983    1,635        6.6       185      53.9       32       12          17                    60       89
1984    1,639        7.3       192      55.4       31       14          17                    49       80
1985    1,853        7.9       182      56.7       30       14          17                    53       84
1986    2,335        9.8       180      52.8       31       18          16                    54       87
1987    2,720       11.0       178      53.0       29       20          16                    53       88
1988    2,470       10.4       187      50.3       30       19          15                    43       78
1989    2,824       11.1       173      50.7       28       19          14                    43       76
1990    2,837       11.4       165      52.9       28       19          15                    38       71
1991    3,210       11.4       151      53.2       27       17          14                    43       74
1992    3,771       13.3       152      53.1       28       20          15                    42       77
1993    4,344       16.6       144      52.8       29       24          15                    44       83
1994    4,624       19.0       143      53.4       30       27          16                    40       83
1995    5,381       20.7       137      52.0       29       28          15                    41       85
1996    6,881       23.3       132      48.8       25       31          12           4        38       85
1997    8,768       24.5       125      45.1       24       31          11           6        34       82
1998   10,864       25.4       119      43.6       23       30          10           4        30       75
1999   13,235       25.7       116      37.6       22       30           8           8        30       76
2000   15,675       25.6       117      37.5       24       30           9           4        32       75
2001   13,068       24.8       114      38.4       25       28          10           5        28       71
2002   11,288       25.3       112      41.3       27       28          11           6        30       75
2003   10,814       27.3       109      41.5       23       30          10          13        29       81
2004   13,183       30.0       104      41.5       22       31           9          10        25       75
2005   14,324       31.7        98      40.6       24       31          10          10        21       72
2006   15,450       34.0        95      40.0       23       32           9          13        21       75
The Cost of Active Investing                         1555


Figure 2. Fees, expenses, and trading costs relative to aggregate market cap, in basis
points, 1980–2006.


of NYSE, Amex, and NASDAQ stocks during the year. The components of the
standardized cost are in Figure 2.


A. The Total Cost of Investing
  The average of the total standardized costs for 1980–2006, in Table VI, is 79
basis points. On average, society spends 0.79% of the aggregate value of U.S.
equity to invest each year. Although the path is not smooth, the sum of the
four components in Figure 2 falls gradually over time. The investment process
consumes 0.82% of total market cap in 1980 and 0.75% in 2006.
  There is a much larger drop in the standardized cost of trading. Investors
spend 0.55% of the value of NYSE, Amex, and NASDAQ stocks to trade in
1980 and only 0.21% in 2006. Thus, during a 26-year period in which annual
turnover grows from 42% to 173%, the trading revenue of brokers and dealers
declines from about two-thirds of society’s total cost of investing to less than
one-third.
  Much of the decline in trading costs is offset by an increase in the cost of mu-
tual funds. Driven mostly by falling open-end loads, the value-weight average
cost per dollar invested in U.S. equity funds, in Table VI, drops fairly steadily
from a stiff 2.08% in 1980 to 0.95% in 2006. But the allocation to mutual funds
increases by more, from only 5.2% of U.S. equity in 1980 to 34.0% in 2006. The
net result is a tripling of the standardized cost, from 11 basis points in 1980 to
1556                         The Journal of Finance

32 basis points in 2006. Almost all of this growth occurs before 1995. During the
last 12 years of the sample, society’s annual cost of investing in mutual funds
is between 0.28% and 0.32% of aggregate market cap.
   Institutional investors hold between 37.5% and 56.7% of the U.S. market
during the 1980–2006 period. Because of their large allocation, the manage-
ment costs institutions incur have a big impact on the total resources society
spends to invest. Per dollar invested, the value-weight average cost for insti-
tutions is always much lower than the average fees and expenses of mutual
funds (Table VI). (I use the costs of the four groups in 1986 to compute the
value-weight average for institutions in 1980–1985.) The biggest difference is
in 1981, when the value-weight average cost is 2.25% for funds and only 0.33%
for institutions. Although institutional costs do not fall as quickly as fund costs,
the shift by institutions toward passive equity strategies and the reduction in
the costs institutions pay for both active and passive investments (Table III)
lower their average cost substantially, from 0.34% of institutional assets in 1980
to 0.23% in 2006. This decline, coupled with first an increase then a decrease
in the institutional allocation, creates almost a step function in Figure 2. From
1980 to 1995, institutional investors pay between 0.14% and 0.17% of the value
of all NYSE, Amex, and NASDAQ stocks to manage their U.S. equity portfolios.
The annual cost to society drops by about six basis points during the next 2
years, and remains between 8 and 11 basis points from 1997 to 2006.
   If we ignored hedge funds, Figure 2 would say that society’s cost of investing
in U.S. equity falls a lot over time, from 0.82% of aggregate market cap in 1980
to 0.62% in 2006. Although the big shift from direct holdings to mutual funds
pushes up the cost of investing, this effect is overwhelmed by the reduction in
trading costs and, to a lesser extent, the decline in institutional management
costs. The net effect would be a 24% reduction in the cost of investing per dollar
of stock market wealth.
   But we cannot ignore hedge funds. Measured in dollars, hedge fund and fund
of fund fees on U.S. equity-related assets jump from 2.8 billion in 1996 to 19.4
billion in 2006 and 25.0 billion in 2007 (Table IV). The standardized cost is
equally impressive. Fees on U.S. equity-related hedge fund assets, in Table VI,
grow from 0.04% of the value of the market in 1996 to 0.13% in 2006. Given
the relatively small size of the industry, these seem like big numbers. The fees
hedge fund and fund of fund clients pay to invest 458.6 billion dollars in 2006,
for example, are 36% higher than all the costs institutions pay to invest 6.18
trillion.
   Hedge fund fees absorb about two-thirds of the reduction in the other costs
of investing, but they do not claim them all. Though the process is not smooth,
the total cost of investing—including hedge fund fees—falls from 0.82% of ag-
gregate market cap in 1980 to 0.75% in 2006.


B. The Cost of Investing if Everyone Is Passive
  Passive investors incur some costs. Thus, the incremental cost of active in-
vesting is the difference between society’s total cost, in Table VI and Figure 2,
The Cost of Active Investing                               1557

and the resources that would be consumed if all investors followed a passive
strategy. I make several assumptions to estimate society’s cost of investing pas-
sively. First, investors in mutual funds switch to a passive mutual fund whose
cost matches the highest expense ratio among the share classes of Vanguard’s
Total Stock Market Index, an open-end fund that holds NYSE, Amex, and NAS-
DAQ stocks.4 (Vanguard started the fund in 1992, so I use the expense ratio
for that year as the cost before 1992.) Second, institutions also move their U.S.
equity investments to a passive market portfolio. For most institutions, the
cost of this portfolio is the cost of the passive DB investments monitored by
CEM Benchmarking. Defined contribution plans pay a bit more. As in the esti-
mates in Table III, their cost is the passive DB cost plus the average difference
between the costs of passive DC and DB plans. (I use the 1991 estimates for
1980–1990.) Third, I continue to assume that there are no fees and expenses
associated with direct holdings and ESOPs. Fourth, in the passive scenario
hedge fund investments are reallocated proportionately among direct holdings,
mutual funds, and institutions.
   Finally, I assume that if all investors follow a passive strategy, total turnover
is 10% a year. This assumption has a big impact on my results and, because
the cost of trading declines over time, the impact is bigger early in the period.
Lowering the assumed turnover to 5%, for example, cuts my estimate of the
cost of passive investing by 6.7 basis points in 1980 and only 0.5 basis points in
2006. Passive investors trade for two reasons, to accommodate cash f lows and
to maintain target risk-return tradeoffs. When thinking about the appropriate
turnover for the passive scenario, it is important to remember that a large slice
of the market would be held by passive institutions with only modest inf lows
and outf lows. Moreover, most f lows from mutual fund clients would cross at the
fund level, without any need for trading. Although a lower passive turnover may
be appropriate, the 10% assumption is conservative because it pushes up the
estimated cost of passive investing and lowers my estimate of the resources
investors spend to beat the market.
   The results of these calculations are in Table VII. The components of society’s
cost of investing in the passive scenario are muted versions of the actual costs
in Table VI. Because of the shift from direct holdings to mutual funds (Table I),
the standardized cost of mutual funds increases from 1.1 basis points in 1980 to
6.5 basis points in 2006. The 60% reduction in the institutional cost of passive
investing (Table III) and the modest reduction in the allocation to institutions
over time (Table VI) combine to lower institutional costs from 3.6 basis points
to only 1.2 basis points. Though not surprising, the drop in trading costs is
most dramatic. The standardized cost in 1980, 13.3 basis points, is 11 times
the cost of 1.2 basis points in 2006. The net result is a 50% reduction in the
standardized cost of passive investing, from 0.180% of the value of all NYSE,
Amex, and NASDAQ stocks in 1980 to 0.089% in 2006.

  4
    Vanguard holds large stocks in proportion to their market caps, but it samples small stocks,
overweighting some and holding no shares of others. Sampling reduces the fund’s custodial costs
and expense ratio. Its impact on trading costs is ambiguous.
1558                                The Journal of Finance

                                              Table VII
      Standardized Cost of Passive Investing, in Basis Points, and
   Incremental Cost of Active Investing, in Basis Points and Billions
                        of Dollars, 1980–2006
The standardized cost of passive would be the cost of investing if all U.S. equity were held passively
and is measured relative to the market cap of all NYSE, Amex, and NASDAQ stocks. Actual −
Passive, the incremental cost of active in basis points, is the standardized cost of investing (Table VI)
minus the passive cost. The average of the annual differences is reported for 1980–2006. Price
discovery, the incremental cost of active in billions of dollars, is Actual − Passive times the aggregate
market cap.

                            Standardized Cost of Passive                   Incremental Cost of Active
                 Mutual                                         Total       Actual −           Price
                 Funds         Institutions      Trading        Cost        Passive           Discovery

1980               1.1             3.6             13.3         18.0            64                7.0
1981               1.0             3.7             11.7         16.5            56                7.2
1982               1.1             3.9             10.8         15.8            67                7.8
1983               1.4             4.0             10.6         15.9            74               12.0
1984               1.5             3.9              8.7         14.2            66               10.8
1985               1.7             4.0              8.1         13.8            70               13.1
1986               2.1             3.7              7.2         13.0            74               17.4
1987               2.3             3.8              6.3         12.4            76               20.7
1988               2.2             3.6              6.6         12.4            65               16.1
1989               2.3             3.6              6.4         12.3            64               18.0
1990               2.4             3.8              6.4         12.6            59               16.6
1991               2.4             3.8              7.0         13.2            61               19.6
1992               2.7             2.9              6.9         12.4            65               24.4
1993               3.3             3.2              6.4         13.0            70               30.5
1994               4.7             3.6              5.7         14.1            69               31.9
1995               4.1             2.9              5.1         12.2            73               39.1
1996               4.7             2.5              4.5         11.6            73               50.5
1997               4.9             2.2              3.7         10.7            71               62.1
1998               5.1             2.0              3.2         10.2            65               70.5
1999               5.1             1.4              2.7          9.3            67               88.8
2000               5.1             1.6              2.3          9.1            66              103.9
2001               5.0             1.7              2.3          9.0            62               80.4
2002               5.1             1.7              2.1          8.9            66               74.8
2003               5.5             1.2              2.2          8.9            72               78.3
2004               5.7             1.2              1.8          8.6            66               87.3
2005               6.0             1.2              1.4          8.6            63               90.7
2006               6.5             1.2              1.2          8.9            66              101.8
1980–2006                                                                       67


C. The Cost of Active Investing
  We are now ready to answer the central question. The average difference
between the actual standardized cost of investing and the passive cost for the
1980–2006 period, in Table VII, is 67 basis points. On average, active investors
spend 0.67% of the total market cap each year on what, in aggregate, is a futile
search for superior returns. If we assume that society will continue to spend
The Cost of Active Investing                       1559

the current real dollar cost of active investing forever and that the expected
real return on the U.S. stock market is a constant 6.7%, the capitalized cost is
10% of the current value of the market. This estimate is conservative. First, the
estimates in Fama and French (2002) and Graham and Harvey (2005) suggest
that the long-term equity risk premium is far below 6.7%. If so, the expected real
return on the market is almost certainly below 6.7%. Second, the data imply
that the annual dollar cost of active investing will grow with the aggregate
market cap. Positive expected growth and a lower discount rate both push the
capitalized cost above 10%. In short, if the social benefit of active investing is
price discovery, the annual cost is 0.67% of the aggregate value of the market
and the capitalized cost is at least 10% of the value.
   Figure 3 plots the difference between the actual and passive costs of invest-
ing. Standardized by aggregate market cap, the cost of active investing is re-
markably stable. All but 3 of the 27 estimates for 1980–2006—including all of
the estimates after 1990—are between 61 and 74 basis points. There is also
little evidence of a time trend in the incremental cost. The average difference
between the actual and passive costs in Table VII is 66 basis points for the
first half of the period and 68 basis points for the second half. Of course,
the lack of a time trend is driven in part by the assumption of 10% turnover
in the passive scenario. If passive turnover is 5%, the standardized cost of try-
ing to beat the U.S. stock market falls by three basis points from 1980 to 2006,
and if passive turnover is 15%, the standardized cost rises by eight basis points
over the period.


Figure 3. The difference between the actual and passive costs of investing, in basis
points, 1980–2006.
1560                         The Journal of Finance

   Table VII also reports the dollar cost of active investing. This is the aggregate
market cap (from Table VI) times the difference between the standardized ac-
tual and passive costs of investing. With 10% passive turnover, the incremental
cost per dollar invested is relatively constant over time, so the total dollar cost
grows with the market. The cost of active investing is 7.0 billion dollars in 1980,
30.5 billion in 1993, and 101.8 billion in 2006. Thus, in 2006 investors searching
for superior returns in the U.S. stock market consume more than 330 dollars
in resources for every man, woman, and child in the United States.
   Finally, the results in Table VII allow me to address a closely related question.
How would a small but representative investor’s return change if he switched
from the value-weight combination of all investors’ strategies to a passive mar-
ket portfolio? Because the combination of all investors’ portfolios is the market
portfolio, the representative investor’s initial return is the gross return on the
market minus the value-weight average of all investors’ costs. Any trading
gains, losses, and other transfers between investors happen within his portfo-
lio and have no effect on his return. This is not the case if the representative
investor switches to a passive market portfolio. Trading gains and security
lending fees paid by active investors to borrow shares from the passive portfo-
lio, for example, push up his return and trading losses lower it. Thus, to use
the cost of investing in the passive scenario to measure the return when the
representative investor switches, I have to assume there is no net transfer be-
tween the passive market portfolio and other investors. With this assumption,
the return on the passive market portfolio is the gross return minus the passive
cost in Table VII, and the representative investor increases his return by the
difference between the actual and passive costs when he switches to the passive
market portfolio.
   The performance of Vanguard’s Total Stock Market Index suggests the no-net-
transfer assumption is reasonable. The fund underperforms the value-weight
market return from the Center for Research in Security Prices (CRSP) by only
2.1 basis points a month, or about 25 basis points a year, from its inception
in 1992 to September 2006. If we add the fund’s average expense ratio of 21
basis points to its return, the shortfall drops to 4 basis points per year. A small
fraction of the fund’s assets is typically in cash. Reversing this cash drag would
add another 7 basis points to the fund’s average gross return, pushing it 3
basis points above the average market return. This positive net transfer is
almost exactly equal to the fund’s average annual revenue from security lending
from 1998 to 2007. And if I were able to add back the commissions the fund
pays to trade, the difference between the fund’s gross return and the market
return would rise even further. The standard error of the monthly difference
between the fund return and the market return is about 1.5 basis points, so it
is important to not put too much weight on these results. Nonetheless, there
is no evidence that investors in Vanguard’s Total Stock Market Index suffer at
the hands of active investors. Analysis of Fidelity’s Spartan Total Market Index
Fund produces a similar conclusion.
   The evidence from the Vanguard and Fidelity funds suggests the no-net-
transfer assumption is conservative. Thus, it seems safe to use the cost of
The Cost of Active Investing                       1561

investing in the passive scenario to estimate the returns one could earn on
a passive market portfolio. If so, a representative investor who switches to a
passive market portfolio would increase his average annual return by 67 basis
points from 1980 to 2006.


                      VII. Summary and Conclusions
   I compare the resources society spends to invest in the U.S. stock market
with what would be spent if everyone followed a passive strategy. My estimate
of the actual cost of investing—the fees and expenses paid for mutual funds, the
investment management costs paid by institutions, the fees paid to hedge funds
and funds of funds, and the transaction costs paid by all traders—is 0.82% of
the value of all NYSE, Amex, and NASDAQ stocks in 1980 and 0.75% in 2006.
In the passive scenario, investors pay passive fees, annual turnover is 10%, and
there are no hedge funds. As a result, the cost of investing is only 0.18% of the
aggregate market cap in 1980 and 0.09% in 2006.
   The difference between the actual and passive estimates measures the cost
of active investing. The average difference for 1980–2006 is 0.67%. Thus, from
society’s perspective, the average annual cost of price discovery is 0.67% of the
total value of domestic equity and the capitalized cost is at least 10% of the
current market value. From a typical investor’s perspective, the message is
more challenging. If there is no net transfer between a passive market portfolio
and other investors, the average annual return on the passive portfolio is 67
basis points higher than the value-weight average of all investors’ returns.
Thus, if a representative investor switched to a passive market portfolio, he
would increase his average annual return by 67 basis points over the 1980–
2006 period.
   Hedge fund fees in 2007 are a stark illustration of the negative sum nature of
active trading. The value-weight average fee on U.S. equity-related hedge fund
assets in 2007 is 4.63% and the average fund of fund fee is 1.85%. Since fund of
fund investors must pay both their own funds’ fees and the fees of the underlying
hedge funds, the typical fund of fund investor does not break even in 2007 unless
U.S. equity-related hedge funds generate average abnormal returns of 6.48%.
There are 458.6 billion dollars invested in hedge funds at the beginning of 2007,
so even if we ignore the other costs they incur, hedge funds must take 29.7 billion
dollars in abnormal profits from other U.S. equity investors for their fund of
fund clients to break even. The total capitalization of the U.S. market is 16.53
trillion dollars at the beginning of 2007, so a 29.7 billion dollar transfer would
reduce the value-weight average return of all nonhedge fund investors by about
18 basis points. Of course, if passive investors do not participate in the transfer
the burden for active investors is even higher. They must contribute about 22
basis points of their U.S. equity holdings in 2007 for fund of fund investors to
break even. And these losses would be on top of the active investors’ own fees,
expenses, and trading costs.
   Whether fund of fund investors break even or not, a passive market portfo-
lio produces a higher return than the aggregate of all active portfolios. Why
1562                        The Journal of Finance

do active investors continue to play a negative sum game? Perhaps the domi-
nant reason is a general misperception about investment opportunities. Many
are unaware that the average active investor would increase his return if he
switched to a passive strategy. Financial firms certainly contribute to this con-
fusion. Although a few occasionally promote index funds as a better alternative,
the general message from Wall Street is that active investing is easy and prof-
itable. This message is reinforced by the financial press, which offers a steady
f low of stories about undervalued stocks and successful fund managers.
    Overconfidence is probably the other major reason investors are willing to
incur the extra fees, expenses, and transaction costs of active strategies. There
is evidence that overconfidence leads to active trading. (See, for example, Odean
(1998), Barber and Odean (2001), and Statman, Thorley, and Vorkink (2006).)
Investors who are overconfident about their ability to produce superior returns
are unlikely to be discouraged by the knowledge that the average active trader
must lose.
    Statman (2004) offers another behavioral explanation for active investing. He
suggests that, in addition to expected return and risk, investors are concerned
with what he calls the expressive characteristics of their portfolios. Thus, some
investors may accept a lower expected return in exchange for the bragging
rights that come with a fund that has performed well. Others may give up the
low cost and diversification of a passive mutual fund for the prestige of their
own separate account.
    Finally, some investors trade actively because they really are able to produce
superior returns. The existence of superior investors, however, does not explain
the behavior of the average investor. Active investing is still a negative sum
game. Every dollar a superior investor earns must increase the aggregate losses
of all other active investors.


                                   Appendix
A. Allocation of Equity
   The main source for the allocation of U.S. publicly traded common equity in
Table I is the December 6, 2007 release of the Federal Reserve Board’s Flow of
Funds Accounts. Table L.213 of the Flow of Funds Accounts reports the value
of corporate equity held by various groups of investors, such as households and
nonprofits, mutual funds, and insurance companies. The Fed uses the house-
hold and nonprofit sector as a residual. Its allocation is the aggregate value
of corporate equity minus the combined values of the other sectors. Thus, the
household and nonprofit sector includes not only the publicly traded common
equity held by households and nonprofits, but also preferred stock and closely
held corporations. Many of the calculations in this section are to separate these
pieces.
   I start by eliminating preferred stock. In personal correspondence, Standard
and Poor’s generously provided estimates of the total value of preferred stock
from their internal stock and bond database for most of the years from 1980 to
The Cost of Active Investing                               1563

2007.5 I use exponential interpolation to fill in the missing years, 1981–1985
and 1987. To expedite the discussion, below I refer to what remains in the
household and nonprofit sector after subtracting preferred stock as simply the
value of the household and nonprofit sector.
  The Federal Reserve reports separate estimates of the holdings of nonprofits
for 1988–2000 (Flow of Funds Accounts table L.100a) and I use them to calculate
the allocations for those years in Table I. I estimate the holdings of nonprofits
in each year before 1988 as the value of the household and nonprofit sector for
the year times the 1988 ratio of nonprofit holdings to the value of the household
and nonprofit sector, and I use the ratio for 2000 to estimate nonprofit holdings
for 2001–2007.
  The direct holdings of households in Table I build on estimates in Kennickell
(2003, 2006). He uses information in the Fed’s triennial Survey of Consumer
Finances (SCF) to measure the amount of publicly traded equity households
own directly in 1989, 1992, 1995, 1998, 2001, and 2004. Kennickell’s estimates
are adjusted for inf lation. After converting them back to nominal dollars, I ad-
just his estimates by the annual value-weight average return on U.S. stocks,
from CRSP, to infer the value of direct holdings for the missing years between
1989 and 2004. My estimate for 2002, for example, is the nominal value of Ken-
nickell’s estimate for 2001 times one plus the market return for 2002 and my
estimate for 2003 is the 2004 value divided by one plus the market return for
2004. I estimate the value of direct holdings for each year before 1989 and after
2004 as the value of the household and nonprofit sector for the year times either
the 1989 or 2004 ratio of direct holdings to total household and nonprofit hold-
ings. I assume Kennickell’s measure of households’ direct holdings of publicly
traded equity includes the value of ETFs. Since the Flow of Funds Accounts
has a separate allocation for ETFs, I reduce my estimate of direct holdings by
the Fed’s estimate of the value of ETFs.
  Although investment costs differ across DB plans, DC plans, and ESOPs,
the Federal Reserve combines their allocations in table L.213 of the Flow of
Funds Accounts. The Fed does report the value of U.S. equity held by DB plans
and DC plans in 1985–2006 in tables L.118b and L.113c. To estimate the U.S.
equity held by DB plans in 2007, I assume they do not change the ratio of their
holdings of U.S. equity relative to all private pension plan assets from 2006 to
2007. The Department of Labor’s website reports the total assets in DB plans
and in DC plans (including ESOPs) for 1975–2005.6 I assume the DB plans’
share of the U.S. equity held by private pensions in 1980–1984 is proportional
to their share of the total assets in private pensions. Thus, to estimate the U.S.
equity held by DB plans in 1980–1984, I multiply the total allocation to private
pensions in table L.213 by the ratio of the total assets in DB plans divided by
the total assets in DB and DC plans.
  Both the Federal Reserve and the Department of Labor combine ESOPs with
other DC plans in their estimates. The annual survey results for 1980–2006

  5
      I thank Shrikant Dash for this information.
  6
      The information is at www.dol.gov/ebsa/pdf/privatepensionplanbulletinhistoricaltables.pdf.
1564                          The Journal of Finance

from Greenwich Associates include the value-weight average fraction of DC
plan assets allocated to a company’s own stock. I use this fraction to separate
ESOPs from other DC plans. Thus, I start by estimating the total assets in
DC plans for 1980–2007 using the approach I describe for DB plans above. I
then use the data from Greenwich Associates to split ESOPs from other DC
plans. (The 2007 split uses the Greenwich estimate for 2006.) To be clear, the
allocation to DC plans in Table I does not include ESOPs.
   The Federal Reserve’s allocations in table L.213 include the foreign equity
held by U.S. investors. Thus, my next step is to remove these securities by
assuming they are held proportionately by all U.S. investors except ESOPs.
   The Flow of Funds Accounts do not include a separate allocation to hedge
funds. As I describe in Section D below, I use estimates of the total assets in-
vested in hedge funds, from HFR, to compute hedge fund and fund of fund
fees. To avoid double counting, however, I have to reduce the U.S. equity alloca-
tions of other groups of investors by the net holdings of hedge funds. Because
hedge funds invest in a variety of assets, hold short and long positions, and use
leverage, their net holdings of U.S. equity differ from the total assets invested.
My indirect measure of net holdings multiplies HFR’s estimate of total hedge
fund assets by the slope coefficient from a regression of hedge fund returns on
U.S. market returns. For example, a 100 million dollar portfolio with long and
short U.S. equity positions of 250 and 200 million dollars has net holdings of
50 million and a slope on the U.S. market of about 0.5.
   I estimate the aggregate slope for all hedge funds by regressing the monthly
return (in excess of the U.S. Treasury bill rate) on the CSFB/Tremont Hedge
Fund Index, a broad value-weight index of hedge funds, against the excess
returns on the CRSP value-weight index of NYSE, Amex, and NASDAQ stocks.
To control for correlations with other markets, I also include excess returns on
MSCI’s Emerging Markets and World Ex-U.S. (developed markets) Indices in
the regression. The estimated slopes (and standard errors) for January 1994,
the start of the CSFB/Tremont index, to September 2007 are given by:

       R H F ,t = 0.44 + 0.19 RU S,t − 0.04 R Dev,t + 0.11 R Emr g ,t + et.      (A1)
                 (0.11) (0.06)        (0.06)         (0.03)
In this regression, RHF,t is the hedge fund return in month t and RUS,t , RDev,t , and
REmrg,t are the returns on the U.S., developed markets, and emerging markets
indices. The adjusted regression R2 is 0.34.
   Asness, Krail, and Liew (2001) find that the returns on some components
of the CFSB/Tremont index are correlated with lagged market returns during
their 1994–2000 sample. When I add lagged market returns to regression (A1),
however, the lagged slopes are indistinguishable from zero and the contempora-
neous slopes are essentially unaffected. Thus, I use regression (A1) to measure
the sensitivity of hedge fund returns to the U.S. market. In short, the alloca-
tion to hedge funds in Table I is 19% of the total hedge fund assets reported by
Hedge Fund Research.
   The Federal Reserve uses cross-border f lows to estimate the U.S. equity held
by foreign investors. As a result, the U.S. equity held by foreign-domiciled hedge
Cost ofactiveinvesting french

Más contenido relacionado

La actualidad más candente

Chapter20 International Finance Management
Chapter20 International Finance ManagementChapter20 International Finance Management
Chapter20 International Finance ManagementPiyush Gaur
 
How Wealthy People Use Professional Money Management
 How Wealthy People Use Professional Money Management How Wealthy People Use Professional Money Management
How Wealthy People Use Professional Money Managementfreddysaamy
 
Portfolio Construction and Evaluation
Portfolio Construction and EvaluationPortfolio Construction and Evaluation
Portfolio Construction and EvaluationWindham Labs
 
Behavioral finance -_an_explanation
Behavioral finance -_an_explanationBehavioral finance -_an_explanation
Behavioral finance -_an_explanationsmritipattnaik
 
Harvard Management Company Investment Analysis
Harvard Management Company Investment AnalysisHarvard Management Company Investment Analysis
Harvard Management Company Investment Analysisbensigler
 
Hybrid Portfolio Theory, 6.17.09
Hybrid Portfolio Theory, 6.17.09Hybrid Portfolio Theory, 6.17.09
Hybrid Portfolio Theory, 6.17.09Prescient Partners
 
A Study on Factors Influencing Investment Decision Regarding Various Financia...
A Study on Factors Influencing Investment Decision Regarding Various Financia...A Study on Factors Influencing Investment Decision Regarding Various Financia...
A Study on Factors Influencing Investment Decision Regarding Various Financia...ijtsrd
 
Portfolio perspectives-greatest lesson-part2-0813
Portfolio perspectives-greatest lesson-part2-0813Portfolio perspectives-greatest lesson-part2-0813
Portfolio perspectives-greatest lesson-part2-0813Better Financial Education
 
Investors behavior in stock market
Investors behavior in stock marketInvestors behavior in stock market
Investors behavior in stock marketNitin Jaiswal
 
Unit 1 behavioural finance to send
Unit 1 behavioural finance to sendUnit 1 behavioural finance to send
Unit 1 behavioural finance to sendKeshav Sharma
 
Behavioral finance and investment decision
Behavioral finance and investment decisionBehavioral finance and investment decision
Behavioral finance and investment decisionaashima1806
 

La actualidad más candente (19)

Chapter20 International Finance Management
Chapter20 International Finance ManagementChapter20 International Finance Management
Chapter20 International Finance Management
 
Chapter (10)
Chapter (10)Chapter (10)
Chapter (10)
 
Investment analysis
Investment analysisInvestment analysis
Investment analysis
 
Ratio download
Ratio downloadRatio download
Ratio download
 
How Wealthy People Use Professional Money Management
 How Wealthy People Use Professional Money Management How Wealthy People Use Professional Money Management
How Wealthy People Use Professional Money Management
 
Portfolio Construction and Evaluation
Portfolio Construction and EvaluationPortfolio Construction and Evaluation
Portfolio Construction and Evaluation
 
Behavioral finance -_an_explanation
Behavioral finance -_an_explanationBehavioral finance -_an_explanation
Behavioral finance -_an_explanation
 
Harvard Management Company Investment Analysis
Harvard Management Company Investment AnalysisHarvard Management Company Investment Analysis
Harvard Management Company Investment Analysis
 
Ratio Analysis
Ratio AnalysisRatio Analysis
Ratio Analysis
 
Hybrid Portfolio Theory, 6.17.09
Hybrid Portfolio Theory, 6.17.09Hybrid Portfolio Theory, 6.17.09
Hybrid Portfolio Theory, 6.17.09
 
investment analysis and portfolio management
investment analysis and portfolio management investment analysis and portfolio management
investment analysis and portfolio management
 
Ia1
Ia1Ia1
Ia1
 
A Study on Factors Influencing Investment Decision Regarding Various Financia...
A Study on Factors Influencing Investment Decision Regarding Various Financia...A Study on Factors Influencing Investment Decision Regarding Various Financia...
A Study on Factors Influencing Investment Decision Regarding Various Financia...
 
Active & Passive[1]
Active & Passive[1]Active & Passive[1]
Active & Passive[1]
 
Portfolio perspectives-greatest lesson-part2-0813
Portfolio perspectives-greatest lesson-part2-0813Portfolio perspectives-greatest lesson-part2-0813
Portfolio perspectives-greatest lesson-part2-0813
 
Investors behavior in stock market
Investors behavior in stock marketInvestors behavior in stock market
Investors behavior in stock market
 
Unit 1 behavioural finance to send
Unit 1 behavioural finance to sendUnit 1 behavioural finance to send
Unit 1 behavioural finance to send
 
Behavioral finance and investment decision
Behavioral finance and investment decisionBehavioral finance and investment decision
Behavioral finance and investment decision
 
Behavioral finance summary
Behavioral finance summaryBehavioral finance summary
Behavioral finance summary
 

Destacado

0large vs small bernstein
0large vs small bernstein0large vs small bernstein
0large vs small bernsteinbfmresearch
 
Can fundmanagerspickstocks baker
Can fundmanagerspickstocks bakerCan fundmanagerspickstocks baker
Can fundmanagerspickstocks bakerbfmresearch
 
Predicting returnsfundmanagers stotz
Predicting returnsfundmanagers stotzPredicting returnsfundmanagers stotz
Predicting returnsfundmanagers stotzbfmresearch
 
Short term persistence in mutual fund performance(12)
Short term persistence in mutual fund performance(12)Short term persistence in mutual fund performance(12)
Short term persistence in mutual fund performance(12)bfmresearch
 
Measuring luck in estimated alphas barras scaillet
Measuring luck in estimated alphas barras scailletMeasuring luck in estimated alphas barras scaillet
Measuring luck in estimated alphas barras scailletbfmresearch
 
Persistence performance
Persistence performancePersistence performance
Persistence performancebfmresearch
 
Smart fundmgrsstupidmoney bernhardt
Smart fundmgrsstupidmoney bernhardtSmart fundmgrsstupidmoney bernhardt
Smart fundmgrsstupidmoney bernhardtbfmresearch
 
Bfm newsletter 10_2011
Bfm newsletter 10_2011Bfm newsletter 10_2011
Bfm newsletter 10_2011bfmresearch
 
Investment beliefsystems nepc
Investment beliefsystems nepcInvestment beliefsystems nepc
Investment beliefsystems nepcbfmresearch
 

Destacado (9)

0large vs small bernstein
0large vs small bernstein0large vs small bernstein
0large vs small bernstein
 
Can fundmanagerspickstocks baker
Can fundmanagerspickstocks bakerCan fundmanagerspickstocks baker
Can fundmanagerspickstocks baker
 
Predicting returnsfundmanagers stotz
Predicting returnsfundmanagers stotzPredicting returnsfundmanagers stotz
Predicting returnsfundmanagers stotz
 
Short term persistence in mutual fund performance(12)
Short term persistence in mutual fund performance(12)Short term persistence in mutual fund performance(12)
Short term persistence in mutual fund performance(12)
 
Measuring luck in estimated alphas barras scaillet
Measuring luck in estimated alphas barras scailletMeasuring luck in estimated alphas barras scaillet
Measuring luck in estimated alphas barras scaillet
 
Persistence performance
Persistence performancePersistence performance
Persistence performance
 
Smart fundmgrsstupidmoney bernhardt
Smart fundmgrsstupidmoney bernhardtSmart fundmgrsstupidmoney bernhardt
Smart fundmgrsstupidmoney bernhardt
 
Bfm newsletter 10_2011
Bfm newsletter 10_2011Bfm newsletter 10_2011
Bfm newsletter 10_2011
 
Investment beliefsystems nepc
Investment beliefsystems nepcInvestment beliefsystems nepc
Investment beliefsystems nepc
 

Similar a Cost ofactiveinvesting french

missing return - formattedKMS
missing return - formattedKMSmissing return - formattedKMS
missing return - formattedKMSKaren M. Smith
 
Persistence inmutualfundperformance carhart
Persistence inmutualfundperformance carhartPersistence inmutualfundperformance carhart
Persistence inmutualfundperformance carhartbfmresearch
 
mutual fund in india
mutual fund in indiamutual fund in india
mutual fund in indiakeyursavalia
 
Science Of Investing Us
Science Of Investing UsScience Of Investing Us
Science Of Investing UsAegisAdvisor
 
A Study on the Performance of Mutual Fund Scheme in India
A Study on the Performance of Mutual Fund Scheme in IndiaA Study on the Performance of Mutual Fund Scheme in India
A Study on the Performance of Mutual Fund Scheme in IndiaIJAEMSJORNAL
 
Princeton ethics in finance 2013 session 6 -- ethics of investing
Princeton ethics in finance 2013 session 6 -- ethics of investingPrinceton ethics in finance 2013 session 6 -- ethics of investing
Princeton ethics in finance 2013 session 6 -- ethics of investingasoni98
 
Question 1 ETFs traded are marketable securities.pdf
Question 1 ETFs traded are marketable securities.pdfQuestion 1 ETFs traded are marketable securities.pdf
Question 1 ETFs traded are marketable securities.pdfsdfghj21
 
FE4051 Introduction To Financial Markets And Institutions.docx
FE4051 Introduction To Financial Markets And Institutions.docxFE4051 Introduction To Financial Markets And Institutions.docx
FE4051 Introduction To Financial Markets And Institutions.docx4934bk
 
Cummings_ACI_Brochure_0116
Cummings_ACI_Brochure_0116Cummings_ACI_Brochure_0116
Cummings_ACI_Brochure_0116Bobby
 
1703331 PAPER The Performance of Mutual Fund Schemes in The Framework of Risk...
1703331 PAPER The Performance of Mutual Fund Schemes in The Framework of Risk...1703331 PAPER The Performance of Mutual Fund Schemes in The Framework of Risk...
1703331 PAPER The Performance of Mutual Fund Schemes in The Framework of Risk...DR BHADRAPPA HARALAYYA
 
Financial theory of investment
Financial theory of investmentFinancial theory of investment
Financial theory of investmentDr. Mani Madhavan
 
Your Retirement April May June 2008 Newsletter
Your Retirement  April May June 2008 NewsletterYour Retirement  April May June 2008 Newsletter
Your Retirement April May June 2008 NewsletterMartin Demarest
 
7204955 mutual-funds-ppt
7204955 mutual-funds-ppt7204955 mutual-funds-ppt
7204955 mutual-funds-pptNishank Reddy H
 
Performance of investment funds berhmani frigerio pan
Performance of investment funds berhmani frigerio panPerformance of investment funds berhmani frigerio pan
Performance of investment funds berhmani frigerio panBERHMANI Samuel
 
ETFs vs index funds and the rise of smart beta ftadviser
ETFs vs index funds and the rise of smart beta   ftadviserETFs vs index funds and the rise of smart beta   ftadviser
ETFs vs index funds and the rise of smart beta ftadviserLuis Rivera
 
Arbitrage Trading
Arbitrage TradingArbitrage Trading
Arbitrage TradingAvain009
 

Similar a Cost ofactiveinvesting french (20)

AAII Los Angeles September 2014
AAII Los Angeles September 2014AAII Los Angeles September 2014
AAII Los Angeles September 2014
 
missing return - formattedKMS
missing return - formattedKMSmissing return - formattedKMS
missing return - formattedKMS
 
Persistence inmutualfundperformance carhart
Persistence inmutualfundperformance carhartPersistence inmutualfundperformance carhart
Persistence inmutualfundperformance carhart
 
mutual fund in india
mutual fund in indiamutual fund in india
mutual fund in india
 
Science Of Investing Us
Science Of Investing UsScience Of Investing Us
Science Of Investing Us
 
Key questions for the long term investor
Key questions for the long term investorKey questions for the long term investor
Key questions for the long term investor
 
A Study on the Performance of Mutual Fund Scheme in India
A Study on the Performance of Mutual Fund Scheme in IndiaA Study on the Performance of Mutual Fund Scheme in India
A Study on the Performance of Mutual Fund Scheme in India
 
Princeton ethics in finance 2013 session 6 -- ethics of investing
Princeton ethics in finance 2013 session 6 -- ethics of investingPrinceton ethics in finance 2013 session 6 -- ethics of investing
Princeton ethics in finance 2013 session 6 -- ethics of investing
 
Dfa institutional review 2007q4
Dfa institutional review 2007q4Dfa institutional review 2007q4
Dfa institutional review 2007q4
 
Question 1 ETFs traded are marketable securities.pdf
Question 1 ETFs traded are marketable securities.pdfQuestion 1 ETFs traded are marketable securities.pdf
Question 1 ETFs traded are marketable securities.pdf
 
FE4051 Introduction To Financial Markets And Institutions.docx
FE4051 Introduction To Financial Markets And Institutions.docxFE4051 Introduction To Financial Markets And Institutions.docx
FE4051 Introduction To Financial Markets And Institutions.docx
 
Cummings_ACI_Brochure_0116
Cummings_ACI_Brochure_0116Cummings_ACI_Brochure_0116
Cummings_ACI_Brochure_0116
 
1703331 PAPER The Performance of Mutual Fund Schemes in The Framework of Risk...
1703331 PAPER The Performance of Mutual Fund Schemes in The Framework of Risk...1703331 PAPER The Performance of Mutual Fund Schemes in The Framework of Risk...
1703331 PAPER The Performance of Mutual Fund Schemes in The Framework of Risk...
 
Financial theory of investment
Financial theory of investmentFinancial theory of investment
Financial theory of investment
 
Your Retirement April May June 2008 Newsletter
Your Retirement  April May June 2008 NewsletterYour Retirement  April May June 2008 Newsletter
Your Retirement April May June 2008 Newsletter
 
7204955 mutual-funds-ppt
7204955 mutual-funds-ppt7204955 mutual-funds-ppt
7204955 mutual-funds-ppt
 
Performance of investment funds berhmani frigerio pan
Performance of investment funds berhmani frigerio panPerformance of investment funds berhmani frigerio pan
Performance of investment funds berhmani frigerio pan
 
ETFs vs index funds and the rise of smart beta ftadviser
ETFs vs index funds and the rise of smart beta   ftadviserETFs vs index funds and the rise of smart beta   ftadviser
ETFs vs index funds and the rise of smart beta ftadviser
 
Arbitrage Trading
Arbitrage TradingArbitrage Trading
Arbitrage Trading
 
Fundamentals of asset class investing
Fundamentals of asset class investingFundamentals of asset class investing
Fundamentals of asset class investing
 

Más de bfmresearch

Impact ofmutualfundclosuresonfundmanagers
Impact ofmutualfundclosuresonfundmanagersImpact ofmutualfundclosuresonfundmanagers
Impact ofmutualfundclosuresonfundmanagersbfmresearch
 
Standard & poor's 16768282 fund-factors-2009 jan1
Standard & poor's 16768282 fund-factors-2009 jan1Standard & poor's 16768282 fund-factors-2009 jan1
Standard & poor's 16768282 fund-factors-2009 jan1bfmresearch
 
Performance emergingfixedincomemanagers joi_is age just a number
Performance emergingfixedincomemanagers joi_is age just a numberPerformance emergingfixedincomemanagers joi_is age just a number
Performance emergingfixedincomemanagers joi_is age just a numberbfmresearch
 
Portfolio turnover white paper
Portfolio turnover white paperPortfolio turnover white paper
Portfolio turnover white paperbfmresearch
 
Mauboussin skill manager
Mauboussin skill managerMauboussin skill manager
Mauboussin skill managerbfmresearch
 
Is alphadead researchnote
Is alphadead researchnoteIs alphadead researchnote
Is alphadead researchnotebfmresearch
 
Fis group study on emerging managers performance drivers 2007
Fis group   study on  emerging managers performance drivers 2007Fis group   study on  emerging managers performance drivers 2007
Fis group study on emerging managers performance drivers 2007bfmresearch
 
Barclays manager selection0312
Barclays   manager selection0312Barclays   manager selection0312
Barclays manager selection0312bfmresearch
 
Active managementmostlyefficientmarkets faj
Active managementmostlyefficientmarkets fajActive managementmostlyefficientmarkets faj
Active managementmostlyefficientmarkets fajbfmresearch
 
2012 0224 active share
2012 0224 active share2012 0224 active share
2012 0224 active sharebfmresearch
 
12 182-china webcast
12 182-china webcast12 182-china webcast
12 182-china webcastbfmresearch
 
Scoring For Returns-Stuart Investment
Scoring For Returns-Stuart InvestmentScoring For Returns-Stuart Investment
Scoring For Returns-Stuart Investmentbfmresearch
 
Performance persistence brown_goetzmann
Performance persistence brown_goetzmannPerformance persistence brown_goetzmann
Performance persistence brown_goetzmannbfmresearch
 
Ownership and fund performance evans
Ownership and fund performance evansOwnership and fund performance evans
Ownership and fund performance evansbfmresearch
 
Information ratio mgrevaluation_bossert
Information ratio mgrevaluation_bossertInformation ratio mgrevaluation_bossert
Information ratio mgrevaluation_bossertbfmresearch
 
Performance teammgmtvsindividual bliss
Performance teammgmtvsindividual blissPerformance teammgmtvsindividual bliss
Performance teammgmtvsindividual blissbfmresearch
 

Más de bfmresearch (20)

Impact ofmutualfundclosuresonfundmanagers
Impact ofmutualfundclosuresonfundmanagersImpact ofmutualfundclosuresonfundmanagers
Impact ofmutualfundclosuresonfundmanagers
 
Standard & poor's 16768282 fund-factors-2009 jan1
Standard & poor's 16768282 fund-factors-2009 jan1Standard & poor's 16768282 fund-factors-2009 jan1
Standard & poor's 16768282 fund-factors-2009 jan1
 
Performance emergingfixedincomemanagers joi_is age just a number
Performance emergingfixedincomemanagers joi_is age just a numberPerformance emergingfixedincomemanagers joi_is age just a number
Performance emergingfixedincomemanagers joi_is age just a number
 
Ssrn id1685942
Ssrn id1685942Ssrn id1685942
Ssrn id1685942
 
Spiva mid2011
Spiva mid2011Spiva mid2011
Spiva mid2011
 
Portfolio turnover white paper
Portfolio turnover white paperPortfolio turnover white paper
Portfolio turnover white paper
 
Mauboussin skill manager
Mauboussin skill managerMauboussin skill manager
Mauboussin skill manager
 
Jp littlebook
Jp littlebookJp littlebook
Jp littlebook
 
Is alphadead researchnote
Is alphadead researchnoteIs alphadead researchnote
Is alphadead researchnote
 
Fis group study on emerging managers performance drivers 2007
Fis group   study on  emerging managers performance drivers 2007Fis group   study on  emerging managers performance drivers 2007
Fis group study on emerging managers performance drivers 2007
 
Barclays manager selection0312
Barclays   manager selection0312Barclays   manager selection0312
Barclays manager selection0312
 
Active managementmostlyefficientmarkets faj
Active managementmostlyefficientmarkets fajActive managementmostlyefficientmarkets faj
Active managementmostlyefficientmarkets faj
 
2012 0224 active share
2012 0224 active share2012 0224 active share
2012 0224 active share
 
12 182-china webcast
12 182-china webcast12 182-china webcast
12 182-china webcast
 
Vanguard dc
Vanguard dcVanguard dc
Vanguard dc
 
Scoring For Returns-Stuart Investment
Scoring For Returns-Stuart InvestmentScoring For Returns-Stuart Investment
Scoring For Returns-Stuart Investment
 
Performance persistence brown_goetzmann
Performance persistence brown_goetzmannPerformance persistence brown_goetzmann
Performance persistence brown_goetzmann
 
Ownership and fund performance evans
Ownership and fund performance evansOwnership and fund performance evans
Ownership and fund performance evans
 
Information ratio mgrevaluation_bossert
Information ratio mgrevaluation_bossertInformation ratio mgrevaluation_bossert
Information ratio mgrevaluation_bossert
 
Performance teammgmtvsindividual bliss
Performance teammgmtvsindividual blissPerformance teammgmtvsindividual bliss
Performance teammgmtvsindividual bliss
 

Último

Pooja 9892124323 : Call Girl in Juhu Escorts Service Free Home Delivery
Pooja 9892124323 : Call Girl in Juhu Escorts Service Free Home DeliveryPooja 9892124323 : Call Girl in Juhu Escorts Service Free Home Delivery
Pooja 9892124323 : Call Girl in Juhu Escorts Service Free Home DeliveryPooja Nehwal
 
00_Main ppt_MeetupDORA&CyberSecurity.pptx
00_Main ppt_MeetupDORA&CyberSecurity.pptx00_Main ppt_MeetupDORA&CyberSecurity.pptx
00_Main ppt_MeetupDORA&CyberSecurity.pptxFinTech Belgium
 
20240429 Calibre April 2024 Investor Presentation.pdf
20240429 Calibre April 2024 Investor Presentation.pdf20240429 Calibre April 2024 Investor Presentation.pdf
20240429 Calibre April 2024 Investor Presentation.pdfAdnet Communications
 
Stock Market Brief Deck (Under Pressure).pdf
Stock Market Brief Deck (Under Pressure).pdfStock Market Brief Deck (Under Pressure).pdf
Stock Market Brief Deck (Under Pressure).pdfMichael Silva
 
Vip Call US 📞 7738631006 ✅Call Girls In Sakinaka ( Mumbai )
Vip Call US 📞 7738631006 ✅Call Girls In Sakinaka ( Mumbai )Vip Call US 📞 7738631006 ✅Call Girls In Sakinaka ( Mumbai )
Vip Call US 📞 7738631006 ✅Call Girls In Sakinaka ( Mumbai )Pooja Nehwal
 
Booking open Available Pune Call Girls Shivane 6297143586 Call Hot Indian Gi...
Booking open Available Pune Call Girls Shivane  6297143586 Call Hot Indian Gi...Booking open Available Pune Call Girls Shivane  6297143586 Call Hot Indian Gi...
Booking open Available Pune Call Girls Shivane 6297143586 Call Hot Indian Gi...Call Girls in Nagpur High Profile
 
Basic concepts related to Financial modelling
Basic concepts related to Financial modellingBasic concepts related to Financial modelling
Basic concepts related to Financial modellingbaijup5
 
The Economic History of the U.S. Lecture 19.pdf
The Economic History of the U.S. Lecture 19.pdfThe Economic History of the U.S. Lecture 19.pdf
The Economic History of the U.S. Lecture 19.pdfGale Pooley
 
The Economic History of the U.S. Lecture 17.pdf
The Economic History of the U.S. Lecture 17.pdfThe Economic History of the U.S. Lecture 17.pdf
The Economic History of the U.S. Lecture 17.pdfGale Pooley
 
The Economic History of the U.S. Lecture 20.pdf
The Economic History of the U.S. Lecture 20.pdfThe Economic History of the U.S. Lecture 20.pdf
The Economic History of the U.S. Lecture 20.pdfGale Pooley
 
Indore Real Estate Market Trends Report.pdf
Indore Real Estate Market Trends Report.pdfIndore Real Estate Market Trends Report.pdf
Indore Real Estate Market Trends Report.pdfSaviRakhecha1
 
Best VIP Call Girls Noida Sector 18 Call Me: 8448380779
Best VIP Call Girls Noida Sector 18 Call Me: 8448380779Best VIP Call Girls Noida Sector 18 Call Me: 8448380779
Best VIP Call Girls Noida Sector 18 Call Me: 8448380779Delhi Call girls
 
Top Rated Pune Call Girls Viman Nagar ⟟ 6297143586 ⟟ Call Me For Genuine Sex...
Top Rated  Pune Call Girls Viman Nagar ⟟ 6297143586 ⟟ Call Me For Genuine Sex...Top Rated  Pune Call Girls Viman Nagar ⟟ 6297143586 ⟟ Call Me For Genuine Sex...
Top Rated Pune Call Girls Viman Nagar ⟟ 6297143586 ⟟ Call Me For Genuine Sex...Call Girls in Nagpur High Profile
 
03_Emmanuel Ndiaye_Degroof Petercam.pptx
03_Emmanuel Ndiaye_Degroof Petercam.pptx03_Emmanuel Ndiaye_Degroof Petercam.pptx
03_Emmanuel Ndiaye_Degroof Petercam.pptxFinTech Belgium
 
(DIYA) Bhumkar Chowk Call Girls Just Call 7001035870 [ Cash on Delivery ] Pun...
(DIYA) Bhumkar Chowk Call Girls Just Call 7001035870 [ Cash on Delivery ] Pun...(DIYA) Bhumkar Chowk Call Girls Just Call 7001035870 [ Cash on Delivery ] Pun...
(DIYA) Bhumkar Chowk Call Girls Just Call 7001035870 [ Cash on Delivery ] Pun...ranjana rawat
 
WhatsApp 📞 Call : 9892124323 ✅Call Girls In Chembur ( Mumbai ) secure service
WhatsApp 📞 Call : 9892124323  ✅Call Girls In Chembur ( Mumbai ) secure serviceWhatsApp 📞 Call : 9892124323  ✅Call Girls In Chembur ( Mumbai ) secure service
WhatsApp 📞 Call : 9892124323 ✅Call Girls In Chembur ( Mumbai ) secure servicePooja Nehwal
 
Dharavi Russian callg Girls, { 09892124323 } || Call Girl In Mumbai ...
Dharavi Russian callg Girls, { 09892124323 } || Call Girl In Mumbai ...Dharavi Russian callg Girls, { 09892124323 } || Call Girl In Mumbai ...
Dharavi Russian callg Girls, { 09892124323 } || Call Girl In Mumbai ...Pooja Nehwal
 
The Economic History of the U.S. Lecture 23.pdf
The Economic History of the U.S. Lecture 23.pdfThe Economic History of the U.S. Lecture 23.pdf
The Economic History of the U.S. Lecture 23.pdfGale Pooley
 
Solution Manual for Principles of Corporate Finance 14th Edition by Richard B...
Solution Manual for Principles of Corporate Finance 14th Edition by Richard B...Solution Manual for Principles of Corporate Finance 14th Edition by Richard B...
Solution Manual for Principles of Corporate Finance 14th Edition by Richard B...ssifa0344
 

Último (20)

Pooja 9892124323 : Call Girl in Juhu Escorts Service Free Home Delivery
Pooja 9892124323 : Call Girl in Juhu Escorts Service Free Home DeliveryPooja 9892124323 : Call Girl in Juhu Escorts Service Free Home Delivery
Pooja 9892124323 : Call Girl in Juhu Escorts Service Free Home Delivery
 
00_Main ppt_MeetupDORA&CyberSecurity.pptx
00_Main ppt_MeetupDORA&CyberSecurity.pptx00_Main ppt_MeetupDORA&CyberSecurity.pptx
00_Main ppt_MeetupDORA&CyberSecurity.pptx
 
20240429 Calibre April 2024 Investor Presentation.pdf
20240429 Calibre April 2024 Investor Presentation.pdf20240429 Calibre April 2024 Investor Presentation.pdf
20240429 Calibre April 2024 Investor Presentation.pdf
 
Stock Market Brief Deck (Under Pressure).pdf
Stock Market Brief Deck (Under Pressure).pdfStock Market Brief Deck (Under Pressure).pdf
Stock Market Brief Deck (Under Pressure).pdf
 
Vip Call US 📞 7738631006 ✅Call Girls In Sakinaka ( Mumbai )
Vip Call US 📞 7738631006 ✅Call Girls In Sakinaka ( Mumbai )Vip Call US 📞 7738631006 ✅Call Girls In Sakinaka ( Mumbai )
Vip Call US 📞 7738631006 ✅Call Girls In Sakinaka ( Mumbai )
 
Booking open Available Pune Call Girls Shivane 6297143586 Call Hot Indian Gi...
Booking open Available Pune Call Girls Shivane  6297143586 Call Hot Indian Gi...Booking open Available Pune Call Girls Shivane  6297143586 Call Hot Indian Gi...
Booking open Available Pune Call Girls Shivane 6297143586 Call Hot Indian Gi...
 
Basic concepts related to Financial modelling
Basic concepts related to Financial modellingBasic concepts related to Financial modelling
Basic concepts related to Financial modelling
 
The Economic History of the U.S. Lecture 19.pdf
The Economic History of the U.S. Lecture 19.pdfThe Economic History of the U.S. Lecture 19.pdf
The Economic History of the U.S. Lecture 19.pdf
 
The Economic History of the U.S. Lecture 17.pdf
The Economic History of the U.S. Lecture 17.pdfThe Economic History of the U.S. Lecture 17.pdf
The Economic History of the U.S. Lecture 17.pdf
 
The Economic History of the U.S. Lecture 20.pdf
The Economic History of the U.S. Lecture 20.pdfThe Economic History of the U.S. Lecture 20.pdf
The Economic History of the U.S. Lecture 20.pdf
 
Indore Real Estate Market Trends Report.pdf
Indore Real Estate Market Trends Report.pdfIndore Real Estate Market Trends Report.pdf
Indore Real Estate Market Trends Report.pdf
 
Best VIP Call Girls Noida Sector 18 Call Me: 8448380779
Best VIP Call Girls Noida Sector 18 Call Me: 8448380779Best VIP Call Girls Noida Sector 18 Call Me: 8448380779
Best VIP Call Girls Noida Sector 18 Call Me: 8448380779
 
Top Rated Pune Call Girls Viman Nagar ⟟ 6297143586 ⟟ Call Me For Genuine Sex...
Top Rated  Pune Call Girls Viman Nagar ⟟ 6297143586 ⟟ Call Me For Genuine Sex...Top Rated  Pune Call Girls Viman Nagar ⟟ 6297143586 ⟟ Call Me For Genuine Sex...
Top Rated Pune Call Girls Viman Nagar ⟟ 6297143586 ⟟ Call Me For Genuine Sex...
 
03_Emmanuel Ndiaye_Degroof Petercam.pptx
03_Emmanuel Ndiaye_Degroof Petercam.pptx03_Emmanuel Ndiaye_Degroof Petercam.pptx
03_Emmanuel Ndiaye_Degroof Petercam.pptx
 
(DIYA) Bhumkar Chowk Call Girls Just Call 7001035870 [ Cash on Delivery ] Pun...
(DIYA) Bhumkar Chowk Call Girls Just Call 7001035870 [ Cash on Delivery ] Pun...(DIYA) Bhumkar Chowk Call Girls Just Call 7001035870 [ Cash on Delivery ] Pun...
(DIYA) Bhumkar Chowk Call Girls Just Call 7001035870 [ Cash on Delivery ] Pun...
 
WhatsApp 📞 Call : 9892124323 ✅Call Girls In Chembur ( Mumbai ) secure service
WhatsApp 📞 Call : 9892124323  ✅Call Girls In Chembur ( Mumbai ) secure serviceWhatsApp 📞 Call : 9892124323  ✅Call Girls In Chembur ( Mumbai ) secure service
WhatsApp 📞 Call : 9892124323 ✅Call Girls In Chembur ( Mumbai ) secure service
 
Dharavi Russian callg Girls, { 09892124323 } || Call Girl In Mumbai ...
Dharavi Russian callg Girls, { 09892124323 } || Call Girl In Mumbai ...Dharavi Russian callg Girls, { 09892124323 } || Call Girl In Mumbai ...
Dharavi Russian callg Girls, { 09892124323 } || Call Girl In Mumbai ...
 
The Economic History of the U.S. Lecture 23.pdf
The Economic History of the U.S. Lecture 23.pdfThe Economic History of the U.S. Lecture 23.pdf
The Economic History of the U.S. Lecture 23.pdf
 
Solution Manual for Principles of Corporate Finance 14th Edition by Richard B...
Solution Manual for Principles of Corporate Finance 14th Edition by Richard B...Solution Manual for Principles of Corporate Finance 14th Edition by Richard B...
Solution Manual for Principles of Corporate Finance 14th Edition by Richard B...
 
VIP Call Girl in Mira Road 💧 9920725232 ( Call Me ) Get A New Crush Everyday ...
VIP Call Girl in Mira Road 💧 9920725232 ( Call Me ) Get A New Crush Everyday ...VIP Call Girl in Mira Road 💧 9920725232 ( Call Me ) Get A New Crush Everyday ...
VIP Call Girl in Mira Road 💧 9920725232 ( Call Me ) Get A New Crush Everyday ...
 

Cost ofactiveinvesting french

  • 1. THE JOURNAL OF FINANCE • VOL. LXIII, NO. 4 • AUGUST 2008 Presidential Address: The Cost of Active Investing KENNETH R. FRENCH∗ ABSTRACT I compare the fees, expenses, and trading costs society pays to invest in the U.S. stock market with an estimate of what would be paid if everyone invested passively. Averaging over 1980–2006, I find investors spend 0.67% of the aggregate value of the market each year searching for superior returns. Society’s capitalized cost of price discovery is at least 10% of the current market cap. Under reasonable assumptions, the typical investor would increase his average annual return by 67 basis points over the 1980–2006 period if he switched to a passive market portfolio. HOW MUCH DO INVESTORS SPEND TRYING to beat the market? To answer this question, I start by estimating the total amount society spends to invest. I measure four components: the fees and expenses investors pay for mutual funds, including open-end funds, closed-end funds, and exchange-traded funds; the investment management costs of institutional investors; the fees investors pay for hedge funds and funds of hedge funds; and the costs all investors pay to trade. I then compare these costs to what society would pay if all investors held a passive market portfolio. The difference is the cost of active investing. Consider a small but representative investor whose initial investment strat- egy is the value-weight combination of all investors’ strategies. Because the value-weight combination of all investors’ portfolios is the market portfolio, the representative investor’s initial return is the gross return on the market mi- nus the value-weight average of all investors’ costs. How would his return be ∗ Kenneth R. French is at the Amos Tuck School of Business, Dartmouth College. I had an extraordinary amount of help on this project. Keith Ambachsteer, Van Anthony, Brad Asness, Cliff Asness, Paul Bennett, Jack Bogle, David Booth, Stephen Brown, Kent Clark, Sean Collins, Shrikant Dash, Bob Deere, Doug Diamond, Robert Dintzner, Jim Dunne, Scott Esser, Maribeth Far- ley, Beth French, Will Goetzmann, Henry Gray, John Griswold, David Hall, Frank Hatheway, Ken Heinz, Terry Hendershot, Sarah Holden, John Howard, Susan Hume McIntosh, Antti Ilmanen, John Liew, Ananth Madhavan, Bernie Madoff, Kevin Maloney, Dave Martin, Charles McNickle, Mike Mendelson, Nir Messafi, Mark Mitchell, Catherine Newell, Terry Odean, John Rekenthaler, Eduardo Repetto, Savina Rizova, Mark Rubinstein, Dave Schneider, Bob Shiller, Jeff Smith, George Sofianos, Hans Stoll, Dick Thaler, Ingrid Tierens, Paula Volent, and Wayne Wagner gave me valu- able information and advice, and Robert Batt, Bob Burnham, Marianna Paskar, Savina Rizova, and Blake Tatsuta provided excellent research assistance. I have also benefited from extensive conversations with Brad Barber, Jon Lewellen, Hubert Lum, Sunil Wahal, and especially Gene Fama. I thank TD Ameritrade, CEM Benchmarking, the Common Fund, Dimensional Fund Ad- visors, Greenwich Associates, Hedge Fund Research, Morningstar, Standard and Poor’s, and the Securities and Exchange Commission for data. 1537
  • 2. 1538 The Journal of Finance affected if he switched to a passive market portfolio? My answer depends on a key assumption: There is no net transfer between the passive market portfolio and other investors. The manager of the passive portfolio, for example, does not lose to or take advantage of other investors when he trades. With this assump- tion, which I support with empirical evidence below, the return on a passive market portfolio is the gross market return minus the cost of investing pas- sively. Thus, a small representative investor who switches to a passive market portfolio increases his return by the difference between the value-weight aver- age of all investors’ costs and the cost of investing passively. Equivalently, his premium for switching is the difference, per dollar invested, between society’s total cost of investing and the cost in the passive scenario. (The logic here is similar to the logic of Malkiel (1973), Sharpe (1991), Buffett (2006), and others.) The no-net-transfer assumption guarantees that, in aggregate, the search for trading gains is doomed. Before considering costs, a trading gain for one active investor must be a loss for another. When we include their higher fees, expenses, and trading costs, it is clear that active investors are playing a negative sum game. This does not mean, however, that the cost of active investing is a pure loss to society. In aggregate, active investors almost certainly improve the accu- racy of financial prices. This, in turn, improves society’s allocation of resources. Thus, my estimate of the cost of active investing also measures society’s cost of price discovery. I offer no evidence on whether society is buying too little or too much of this good. Price discovery, however, is an externality—each active investor pays the full cost of his efforts but captures only a tiny slice of the benefit—so there is no reason to think active investors purchase the optimal amount of price discovery. I limit the scope of the paper by considering only the costs of investing in U.S. equity. Most of the results are for 1980–2006, but when they are available, I in- clude data for 2007. The average of the annual estimates for 1980–2006 implies investors spend 0.67% of the value of all NYSE, Amex, and NASDAQ stocks each year trying to beat the market.1 Under the no-net-transfer assumption, this means that an investor who holds a passive market portfolio outperforms the value-weight average of all active and passive investors by 67 basis points a year from 1980 to 2006. If the expected real return on U.S. equity is roughly 6.7% and we assume the annual dollar cost of active investing will not increase in the future, soci- ety’s capitalized cost of price discovery is about 10% of the current value of the market. Estimates of the equity risk premium in Fama and French (2002) and Graham and Harvey (2005), however, suggest that the expected real return on the market is substantially below 6.7%. If so, the capitalized cost of price dis- covery is above 10% of the current market cap. Moreover, the data imply that the cost of active investing will grow with the aggregate market cap. This ex- pected growth pushes the capitalized cost even higher. Thus, 10% of the current value of the market is a conservative estimate of the capitalized cost of price discovery. 1 Bogle (2008) offers a more inclusive estimate of society’s cost of investing for 2007.
  • 3. The Cost of Active Investing 1539 The first step in my analysis, in Section I, is to estimate the allocation of publicly traded U.S. equity among groups of investors. Direct holdings by indi- viduals decline a lot over time. Individuals hold 47.9% of the market in 1980 and only 21.5% in 2007. This decline is matched by an increase in the holdings of open-end mutual funds, from 4.6% in 1980 to 32.4% in 2007. The shift from direct holdings to open-end funds has an important implication. Some argue that mistakes by retail investors are a reliable source of trading gains for other investors. If so, competition for these gains must be fierce later in the sample as an expanding group of professional investors fights for a shrinking pool of mistakes. I examine the cost of mutual funds in Section II. Driven by a steady decline in the loads open-end fund investors pay, the fees and expenses for mutual funds fall from 2.08% of assets under management in 1980 to 0.95% in 2006. The investment management costs for institutions, which I estimate in Section III, are lower. Their value-weight average cost is only 34 basis points in 1980 and 23 basis points in 2006. Institutional costs decline over time for two reasons. First, the costs they pay for active and passive investments decline. Second, and more interesting, institutions shift a large portion of their U.S. equity holdings from active to passive over time. In Section IV, I use data on individual hedge funds to estimate the fees clients pay to invest in U.S. equity-related funds. The average annual hedge fund fee for 1996–2007 is a hefty 4.26% of assets, and, because they pay two layers of fees, the average for clients who buy through funds of hedge funds is even higher, 6.52% per year. My analysis of trading costs, in Section V, follows Stoll (1993). I use data from the Securities and Exchange Commission (SEC) to measure the total commissions and market-making gains brokers and dealers earn by trading U.S. stocks. My bottom line is in Section VI. I compare the resources investors actually spend in the U.S. market—the fees and expenses paid for mutual funds, the investment management costs paid by institutions, the fees paid to hedge funds and funds of funds, and the transaction costs paid by all traders—with what investors would spend if everyone followed a passive strategy. The difference between the actual and passive estimates is the cost of active investors’ search for superior returns. Standardized by the total value of NYSE, Amex, and NASDAQ stocks, the amount investors spend trying to beat the market is surprisingly stable; the cost is between 61 and 74 basis points in 24 of the 27 years from 1980 to 2006 and in every year after 1990. Although the total amount is relatively constant, the components change a lot over time. Because the amount invested in mutual funds increases so much through time, for example, the expenditures on fund fees and expenses increase from 0.11% of total market cap in 1980 to 0.32% in 2006. The fees for U.S. equity-related hedge fund investments also grow a lot, from essentially zero early in the period to 0.13% of the total value of U.S. equity in 2006. These increases are offset by a dramatic drop in the cost of trading. Despite a sharp increase in trading volume, the aggregate cost of trading U.S. equity falls from 0.55% of total market cap in 1980 to only 0.21% in 2006. Thus,
  • 4. 1540 The Journal of Finance measured relative to the value of U.S. equity, investors shift their expenditures from trading to asset management, but the total amount spent to beat the market is never far from the 1980–2006 average of 67 basis points. My estimate of the resources consumed in the search for superior returns does not include several potentially important costs. Retail brokers, for ex- ample, borrow from their customers at below market rates and make margin loans to them at above market rates. Although the income from these activities is part of the revenue firms earn for trading—and part of their customers’ cost of trading—I miss this in my estimate of the resources investors spend trying to beat the market. Fees for wealth management, such as financial and estate planning, are not a cost of active investing, but my estimate should include ad- visor fees that are for advice about undervalued stocks and winning investment strategies. I intentionally omit transfers between investors. An active investor, for ex- ample, may pay a large market impact cost to trade quickly. If the counterparty is a broker, this trading cost is included in the market-making gains the broker reports to the SEC, and it is in my estimate of the resources society spends to trade. If the counterparty is another investor, however, the market impact cost is just a transfer, reducing one investor’s return and increasing another’s by the same dollar amount. Thus, it is not a cost to society. Similarly, to a taxable investor choosing between active and passive strategies, the extra tax burden that typically accompanies active trading is a cost. From society’s perspective, however, extra taxes are just a transfer, so I do not include them in my estimate of the resources society spends to beat the market. Most security lending payments are also transfers—one investor pays to bor- row the security and the other receives the payment—so they are appropriately excluded from my estimate of the cost of active investing. The trading desk that arranges a security loan, however, typically retains part of the payment as com- pensation for its services and this does belong in my estimate. Similarly, the interest retail brokers earn lending securities held in street name is part of their compensation for providing trading services. The results below miss both of these costs. I overstate the cost of active investing in at least two ways. First, the fees and expenses I measure include manager compensation. Many managers in- vest in their own funds, so my estimates include payments managers make to themselves. This is not much of a problem for mutual funds since managers own only a small fraction of aggregate fund assets, but it may be significant for hedge funds. More important, I assume most investors switch to a market portfolio in the passive scenario. (Individuals with direct stock holdings and employee stock ownership plans continue to hold their actual portfolios.) There are several reasons, however, why passive investors might choose something other than a market portfolio. Taxable investors have an incentive to avoid realizing short- term gains and to defer long-term gains. Investors with specific social concerns might favor some securities over others. And, in the spirit of Merton (1973) or Ross (1976), some investors might shift away from the market portfolio because
  • 5. The Cost of Active Investing 1541 they prefer a different multifactor risk-return trade-off. To the extent that such deviations from the market portfolio increase the cost of investing in the passive scenario, I overstate the incremental cost of active investing. Finally, I focus on the monetary cost of active investing, but most active investors bear a second cost: Their portfolios are not as well diversified as the market portfolio. The fact that the average investor could increase his return and lower his risk simply by switching to a passive market portfolio raises an obvious question. Why do active investors continue to play a negative sum game? I summarize the paper and address this question in Section VII. An extensive Appendix completes the paper. I. Allocations Table I describes the ownership of U.S. common equity from 1980 to 2007. Most of the information I use to measure these allocations is from the December 6, 2007 release of the Federal Reserve Board’s Flow of Funds Accounts, which reports the total amount of corporate equity held by various investor groups. The adjustments I make to convert these estimates to the allocations in Table I are described in the Appendix. There are several interesting patterns in the allocations in Table I. In 1980 individuals hold the biggest share of U.S. common equity, 47.9%. Direct holdings shrink to about 27% in 1994–1996, jump back to 36% in 1999, 2000, and 2001, and then fall steadily to only 21.5% at the end of October 2007. The growth in open-end mutual funds is equally dramatic, from 4.6% in 1980 to 32.4% in 2007, and although the yearly changes are not perfectly aligned, the total increase about matches the reduction in direct holdings. The shift from direct holdings to open-end funds has at least two important implications. First, in the analysis below, only the fees and expenses for hedge funds are higher than those for open-end funds. Since I assume there are no fees or expenses associated with direct holdings, the shift to funds pushes up my estimate of society’s cost of investing. But there is also a benefit. Most people who hold stocks directly are more poorly diversified. (See, for example, Barber and Odean (2000), or Goetzmann and Kumar (2008).) Thus, although the shift to open-end funds increases my estimate of society’s overall cost of investing, it also reduces the typical investor’s risk. Second, some claim that retail investors are a reliable source of trading gains for mutual funds, hedge funds, and other institutional investors. If so, the shift from direct holdings to open-end funds suggests these gains become scarcer later in the sample as an expanding pool of professional managers competes for a shrinking pool of retail mistakes. The Fed’s allocations include not only the U.S. equity I focus on, but also foreign equity owned by U.S. residents and institutions. Table I reports the value of these foreign holdings as a fraction of U.S. investors’ total equity portfolio. Readers familiar with the literature seeking to explain why investors do not diversify internationally (e.g., French and Poterba (1991), Karolyi and Stulz (2003), and Ahearne, Griever, and Warnock (2004)) may be surprised that this
  • 6. Table I Allocation of Publicly Traded U.S. Common Equity, in Percent, 1980–2007 1542 The table reports the percent of U.S. equity held by various investors. Most of the data are from the December 6, 2007 release of the Federal Reserve’s Flow of Funds Accounts. The steps used to compute the allocations are described in the Appendix. Direct holdings is the fraction of U.S. equity held by individuals. The allocation to closed-end funds, CEFs, includes unit investment trusts. The holdings of foreign investors are included in the other categories and foreign holdings is the fraction of U.S. investors’ equity portfolio in foreign stock. Direct Open-end DB DC Public Banks and Hedge Foreign Foreign Holdings Funds CEFs ETFs Plans Plans ESOPs Funds Nonprofits Insurance Funds Investors Holdings 1980 47.9 4.6 0.5 0.0 18.1 3.9 2.8 4.4 8.3 9.4 0.0 7.6 2.0 1981 45.9 4.4 0.5 0.0 19.0 3.7 3.5 5.1 7.9 10.1 0.0 8.1 1.9 1982 42.4 5.0 0.4 0.0 21.1 3.5 4.6 5.5 7.2 10.2 0.0 8.2 1.7 1983 39.5 6.3 0.4 0.0 21.4 3.4 5.0 6.7 6.7 10.5 0.0 8.4 2.2 1984 37.3 7.0 0.3 0.0 21.8 3.0 6.7 7.4 6.3 10.2 0.0 8.4 2.2 1985 35.4 7.6 0.3 0.0 22.5 3.3 7.7 7.2 6.0 10.1 0.0 8.4 2.9 1986 37.4 9.4 0.4 0.0 20.3 2.6 6.6 7.6 6.2 9.4 0.0 9.7 4.1 1987 36.1 10.4 0.6 0.0 18.4 3.9 6.9 8.5 6.0 9.3 0.0 9.9 5.2 1988 39.3 9.6 0.7 0.0 15.5 3.8 6.1 9.5 6.5 8.9 0.0 10.2 6.4 1989 38.3 10.3 0.7 0.0 14.8 3.7 6.6 9.9 7.2 8.5 0.0 10.6 7.8 1990 35.4 10.5 0.9 0.0 15.3 4.3 6.4 11.1 7.6 8.2 0.3 10.1 8.5 1991 35.0 10.4 0.9 0.0 15.5 4.0 6.9 11.8 6.3 8.7 0.4 9.3 9.1 1992 33.0 12.4 0.9 0.0 14.9 3.8 7.4 11.9 6.5 8.6 0.5 9.0 9.4 1993 29.7 15.7 0.9 0.0 14.4 4.1 7.4 11.8 6.1 9.1 0.8 8.6 13.7 The Journal of Finance 1994 26.8 17.9 1.0 0.0 14.1 4.3 6.9 11.9 6.8 9.5 0.8 8.9 15.4 1995 26.7 19.6 1.1 0.0 13.2 4.1 6.3 12.3 6.6 9.5 0.7 9.2 14.7 1996 27.2 22.2 1.1 0.0 11.5 3.9 5.4 12.1 6.5 9.3 0.8 8.8 14.8 1997 29.5 23.4 1.0 0.1 9.8 3.9 4.4 11.7 6.1 9.3 0.8 9.4 13.6 1998 30.2 24.3 1.0 0.2 9.2 4.3 4.0 11.1 5.8 9.4 0.7 10.4 13.9 1999 36.0 24.7 0.8 0.2 7.4 3.5 3.1 9.9 4.9 8.9 0.6 10.3 14.3 2000 36.2 24.4 0.6 0.5 8.1 3.6 2.6 9.5 4.6 9.1 0.7 10.8 13.7 2001 36.0 23.6 0.5 0.7 8.8 3.5 3.0 10.0 4.0 9.2 0.8 11.4 13.1 2002 32.1 23.7 0.5 1.1 9.9 3.6 3.0 10.8 3.6 10.5 1.3 12.3 14.5 2003 29.9 25.5 0.6 1.2 9.8 3.7 3.2 11.0 3.4 10.4 1.3 13.2 16.8 2004 27.1 27.6 0.8 1.6 9.7 3.9 3.1 11.0 3.1 10.7 1.4 13.6 18.6 2005 26.1 28.8 0.9 2.0 9.1 3.9 3.0 10.9 2.9 10.8 1.5 14.0 22.3 2006 24.2 30.5 1.0 2.5 8.6 4.0 2.8 10.7 2.6 11.2 1.9 15.1 25.3 2007 21.5 32.4 1.1 3.0 8.5 3.8 2.8 10.6 2.3 11.8 2.2 16.3 27.2
  • 7. The Cost of Active Investing 1543 fraction grows from 2.0% in 1980 and 8.5% in 1990 to a substantial 27.2% in 2007. Thus, in 2007 more than one-fourth of the average U.S. investor’s equity portfolio is in foreign stocks. Table I shows a fairly steady decline in the share of U.S. equity owned by foundations, endowments, and other nonprofits, from 8.3% in 1980 to 6.0% in 1985 and 2.3% in 2007. One might be tempted to attribute the decline to the well-known shift by endowments toward alternative investments. However, Greenwich Associates, a consulting and research firm, reports that the fraction of endowment assets invested in domestic equity drops by less than one-third between 1985 and 2006, from 47.4% to 34.2%, so this is not the full explanation. Part of the decline may be an artifact of the process I use to disentangle allo- cations to nonprofits and households in the Flow of Funds Accounts (described in the Appendix). If so, the decline in the direct holdings of individuals is even bigger than the estimates in Table I imply. The allocation to defined contribution (DC) plans in Table I remains close to 4% throughout the period, but this is a bit misleading. To avoid double counting, the allocations to DC and defined benefit (DB) plans in Table I do not include the mutual funds they own. The omission has only a modest impact on the estimates for DB plans, but it has a big impact on the estimates for DC plans. Supplemental data in the Flow of Funds Accounts imply that the mutual fund holdings of DC plans grow from 0.3% of the value of the U.S. market in 1985 to a substantial 8.5% in 2006. Although these estimates include fixed income and foreign equity funds, it is clear that by 2006 DC plans own much more U.S. equity than the 3.8% allocation in Table I suggests. Finally, in terms of their net holdings of U.S. equity, hedge funds are relatively unimportant. They grow from 0.3% of U.S. equity in 1990 to 2.2% in 2007. But we shall see that hedge funds play a big role when we look at costs. II. Average Fees and Expenses for Mutual Funds My estimates of the resources spent trying to beat the market combine the allocations to various groups, in Table I, with estimates of each group’s cost of investing. To be conservative, I assume the only expenses individuals incur when they hold shares directly are trading costs, which are included in the ag- gregate estimates below. I ignore, for example, the time they spend managing their portfolios and the cost of subscriptions to Value Line and Morningstar. Similarly, I assume employee stock ownership plans (ESOPs) have no invest- ment management costs. I use reported expense ratios, from the mutual fund database maintained by the Center for Research in Security Prices (CRSP), and estimates of annuitized loads, from the Investment Company Institute (ICI), to measure the cost of in- vesting in open-end funds. The average expense ratios in Table II weight funds by their assets under management at the beginning of the year, and include only those that invest predominantly in U.S. common equity. (The Appendix describes the steps used to identify U.S. equity funds. Fama and French (2008) analyze the returns on this set of funds.)
  • 8. 1544 The Journal of Finance Table II Fees and Expenses for Mutual Funds, in Basis Points, 1980–2006 The expense ratio for open-end mutual funds is the value-weight average of the reported values for U.S. equity funds in the CRSP mutual fund database. The annuitized load is from the Investment Company Institute and measures the value-weight average load paid by investors in equity funds. Total is the sum of the open-end expense ratio and annuitized load. Percent passive is also from the ICI and measures the fraction of U.S. equity fund assets invested in index funds. The value-weight average expense ratios for U.S. equity closed-end funds (CEFs) and U.S. equity exchange-traded funds (ETFs) are estimated using data from Morningstar. Open-end Mutual Funds Expense Ratio Expense Annuitized Percent Ratio Load Total Passive CEFs ETFs 1980 70 149 219 1981 71 167 237 1982 75 128 203 1983 76 113 190 1984 82 114 196 1.0 1985 80 105 185 1.1 1986 81 101 183 0.8 1987 86 96 182 0.9 1988 96 97 193 1.2 1989 94 84 178 1.6 1990 93 76 169 2.3 1991 90 65 155 2.9 1992 96 59 155 3.6 1993 96 50 146 3.9 1994 98 47 145 3.9 1995 96 42 139 4.7 1996 93 40 134 5.8 1997 92 35 126 7.3 1998 90 30 120 9.0 1999 91 27 117 9.7 2000 96 24 119 9.8 96 2001 97 19 116 10.9 92 20 2002 98 18 116 12.4 101 17 2003 96 17 113 12.4 98 18 2004 91 18 108 12.7 104 19 2005 87 16 103 12.5 103 20 2006 85 15 100 12.6 109 21 The value-weight average expense ratio for open-end funds grows from 70 basis points in 1980 to 96 basis points in 1988. It remains in a narrow band over the next 14 years and then falls from 98 basis points in 2002 to 85 in 2006. One might suspect that the decline in the average expense ratio at the end of the period ref lects a shift from active open-end funds to lower priced passive funds. Table II shows that there is a shift to passive funds, from 1.0% of fund assets in 1984 to 12.4% in 2002, but it occurs before the average expense ratio falls. The growth of exchange-traded funds (ETFs) and competitive pressure from passive open-end funds, however, probably contribute to the decline.
  • 9. The Cost of Active Investing 1545 The behavior of the average annuitized load in Table II is striking. It falls almost monotonically from 149 basis points in 1980 to only 15 basis points in 2006. (Barber, Odean, and Zheng (2005) make a similar point.) This drop, which is driven mostly by a shift toward no-load funds, has a big impact on the total fees and expenses paid by investors. The annual costs of open-end funds shrink from 2.19% of assets under management at the beginning of the period to 1.00% at the end. Because closed-end funds and ETFs trade on exchanges, customers pay bro- kerage commissions rather than loads when they buy and sell these funds. The commissions are part of the aggregate trading costs measured below. Thus, I include only expense ratios in the fees and expenses for investments in U.S. equity closed-end funds and ETFs. The data I have on these funds, from Morn- ingstar, are not as complete as those for open-end funds; I can compute annual value-weight average expense ratios for closed-end funds only from 2000 to 2006 and for ETFs from 2001 to 2006. I use the averages of these annual esti- mates before 2000 and 2001. Fortunately, ETFs are 0.5% or less of U.S. equity before 2001 and the allocation to closed-end funds never exceeds 1.1%, so im- precise estimates of the annual average expense ratios have little effect on my results. The average of the annual estimates for U.S. equity closed-end funds in Table II, 1.01%, is a bit higher than the average expense ratio for open-end funds over the same period, 0.93%. The 2001–2006 average for ETFs is only 19 basis points, which is not surprising given that most ETFs are variants of passive funds in that period. III. Institutional Costs The information I use to measure the investment expenses of institutional investors comes from two sources. CEM Benchmarking, Inc., a Toronto-based firm that monitors the investment activities of pension plan sponsors, provided annual estimates of the costs incurred by DB and DC plans when they make active and passive investments in the U.S. stock market. I combine these with estimates of the active and passive U.S. equity allocations of institutional in- vestors from Greenwich Associates. The Greenwich estimates are from surveys of DB plans, DC plans, public funds, and nonprofits, which include foundations and endowments through 1999 and only endowments thereafter. Greenwich has conducted surveys annu- ally since 1986 and the respondents control a substantial portion of all institu- tional investments. For example, 1,950 institutions with more than six trillion dollars participated in the 2006 survey. The results of the Greenwich surveys are in Table III. All four groups of institutions increase their allocation to passive over time. DB plans show the smallest increase, from 21.1% in 1986 to 31.2% in 2006. Nonprofits start with a meager 2.8% of their U.S. equity holdings invested passively, but finish with 28.7%. Public funds have the highest passive allocation throughout the period, with 25.8% in 1986 and a substantial 52.7% in 2006.
  • 10. 1546 The Journal of Finance Table III Percent of U.S. Equity Investments Allocated to Passive Strategies by Institutions and Investment Management Costs Incurred by Institutions, in Basis Points, 1986–2006 The percent invested passively, from Greenwich Associates, is the value-weight average fraction of their U.S. equity investments institutions allocate to passive strategies. The four institutional groups are defined benefit (DB) plans, defined contribution (DC) plans, public funds, and nonprofits, which include foundations and endowments through 1999 and only endowments thereafter. The passive and active investment management costs for DB plans are value-weight averages, from CEM benchmarking. The investment management costs for DB plans, public funds, and nonprofits are weighted averages of the passive and active DB costs. The investment management costs for DC plans use the annual passive and active DB costs plus the average annual difference between DC and DB costs. The average difference is 3.4 basis points for passive and 18.2 basis points for active. I use the 1991 estimates of passive and active costs for 1986–1990. Investment Management Cost Percent Invested Passively DB Plans DB DC DB DC Plans Plans Public Nonprofits Passive Active Plans Plans Public Nonprofits 1986 21.1 17.9 25.8 2.8 34 50 32 39 1987 24.6 26.2 29.0 9.6 32 46 31 37 1988 22.3 29.6 39.0 9.2 33 45 28 37 1989 25.6 29.7 46.0 12.7 31 45 25 36 1990 28.5 29.4 43.1 12.5 31 43 26 36 1991 32.5 31.9 44.6 14.3 7.9 40.4 30 43 28 36 1992 26.8 35.0 39.2 11.1 5.9 42.1 32 42 28 37 1993 25.6 33.8 46.4 17.0 6.7 43.1 34 44 26 37 1994 27.8 31.7 43.4 19.0 7.4 45.4 35 47 29 38 1995 27.5 32.2 40.0 23.8 6.0 43.4 33 45 28 34 1996 30.7 32.1 48.5 23.2 5.4 37.9 28 41 22 30 1997 29.5 33.7 52.2 18.1 4.9 36.3 27 39 20 31 1998 27.1 30.6 52.9 17.9 4.6 34.2 26 39 19 29 1999 30.0 34.0 54.2 20.2 3.8 34.0 25 37 18 28 2000 29.4 35.1 57.1 20.7 4.3 35.6 26 38 18 29 2001 30.5 32.5 51.9 22.0 4.5 37.2 27 40 20 30 2002 30.4 35.0 52.4 23.5 4.2 41.3 30 41 22 33 2003 32.7 34.6 55.2 36.4 2.8 37.8 26 39 18 25 2004 34.4 33.2 53.6 29.4 2.6 35.8 24 38 18 26 2005 31.2 34.6 53.7 25.8 2.7 37.0 26 38 19 28 2006 31.2 35.7 52.7 28.7 2.9 36.0 26 37 19 27 CEM Benchmarking’s estimates of the cost of active and passive investing are based on a smaller sample of institutions. In 2006, for example, CEM has information on 141 DB plans and 99 DC plans. CEM tends to focus on larger plans, however, so those in the 2006 sample have 2.78 trillion dollars in total assets, with more than one trillion invested in publicly traded U.S. equity. The underrepresentation of smaller institutions probably has little impact on my estimates of the cost of active investing. First, because they have more assets to invest, larger institutions are more important for the aggregate values I am
  • 11. The Cost of Active Investing 1547 trying to measure. Second, estimates of what society spends to beat the market depend on the difference between the costs of active and passive investing. CEM’s emphasis on large plans may reduce my overall estimates of the insti- tutional cost of investing, but because economies of scale affect both active and passive costs, it has less effect on the difference. CEM provides annual value-weight averages of the costs incurred by DB and DC pension plans for passive and active investments in U.S. common eq- uity. The costs include auditing, consulting, oversight, and custodial charges, compensation and other employee costs, and investment management fees for externally managed strategies. The estimates for DB plans, which are avail- able for 1991–2006, are in Table III. As expected, active strategies cost a lot more than passive strategies. The average of the annual estimates for active, 38.6 basis points, is eight times the average for passive, 4.8 basis points. Both passive and active costs decline over time. The average cost for active strategies in DB plans falls from 40.4 basis points in 1991 to 36.0 basis points in 2006, and the average cost for passive strategies falls from 7.9 basis points to only 2.9 basis points. The decline in costs is not caused by a change in the DB plans sampled. Similar declines are observed if the sample is limited to only plans with data for the whole 16-year period. My annual estimates of the costs paid by (i) DB plans, (ii) public plans and state and local governments, and (iii) foundations, endowments, and other non- profits, in Table III, combine the average costs of passive and active strategies in DB plans from CEM with the allocations between passive and active from Greenwich. Specifically, the investment management cost for a group is the passive cost for DB plans times the group’s allocation to passive strategies plus the active cost times the group’s allocation to active strategies. Since the CEM data are not available before 1991, I use the 1991 estimates of the cost of active and passive strategies for 1986–1990. The CEM data for DC plans do not start until 1997. Perhaps because the sample of DC plans is smaller than the sample of DB plans, the annual cost estimates for DC plans (not reported) are more volatile than the estimates for DB plans. Because of this volatility, I use the annual DB cost plus the average difference between the costs for DC and DB plans for 1997–2006 to measure the annual cost of active and passive DC strategies. The investment costs for DC plans are generally higher than the costs for DB plans. The average differ- ence is 3.4 basis points for passive strategies and 18.2 basis points for active strategies. The estimated costs for all four institutional groups in Table III decline be- tween 1986 and 2006. The smallest drop is for DB plans, from 34 to 26 basis points. The cost for each of the other three groups declines by 12 or 13 basis points—from 50 to 37 basis points for DC plans, from 32 to 19 basis points for public funds, and from 39 to 27 basis points for nonprofits. These reductions are the result of the decline in the costs of active and passive strategies and, more important, the shift over time from active to passive investments. This shift toward passive strategies is in sharp contrast to the contemporaneous growth of hedge funds, examined next.
  • 12. 1548 The Journal of Finance IV. Hedge Fund Fees Hedge fund fees often have two components. A fee of “2 and 20,” for example, means that investors pay an annual management fee of 2% of the assets in the fund plus a performance fee of 20% of profits. Because of the performance fee, the aggregate compensation paid to hedge fund managers each year depends on the specific return earned by each fund in the industry. I use data from Hedge Fund Research (HFR) to estimate the fees on individual hedge funds and funds of hedge funds from May 1996 to December 2007. Hedge funds trade stocks, bonds, currencies, and other securities in markets around the world. Since I am measuring the resources spent trying to beat the U.S. stock market, I have to estimate the fraction of hedge fund assets used in U.S. equity strategies. HFR assigns hedge funds to one of several categories, such as merger arbitrage, event driven, and sector funds. I use their categories to sort funds into three groups. I assume funds in the first group use 100% of their assets for equity strategies, those in the second use 50%, and those in the third do not use any of their assets for equity trading. I then use the weight of the U.S. in the world equity portfolio to estimate the fraction of equity-related assets used for trading in the U.S. (The Appendix describes this process in detail.) Table IV shows HFR’s annual estimates of the assets invested in the hedge fund industry and my estimates of the assets in U.S. equity-related strate- gies. Total hedge fund assets grow rapidly during the sample period, from less than 40 billion dollars in 1991 to 185.8 billion in 1996 and 1,464.5 billion at the beginning of 2007. Investment in U.S. equity-related strategies keeps pace with the total; at the beginning of 2007 there are 458.6 billion dollars in these strategies.2 A large fraction of hedge fund assets is held by funds of funds. In 2007, for example, 655.9 billion dollars—about 45% of all hedge fund assets—are invested in funds of funds. The HFR database puts all funds of funds in the same category, so I am unable to isolate those that focus on U.S. equity-related strategies. In the analysis below I assume that funds of funds are invested proportionately between hedge funds that are related to U.S. equity and those that are not. Table IV also reports annual value-weight averages of the fees for funds of funds and U.S. equity-related hedge funds for 1996–2007. Quoted hedge fund fees increase over the sample period. The value-weight average management fee rises from 0.92% in 1996 to 1.28% in 2007, and the average quoted per- formance fee rises from 18.24% to 19.15% over the same period. There is less variation in the average management fee for funds of funds, but their average quoted performance fee declines a lot over time, from 9.45% in 1996 and 11.41% in 1998 to 6.94% in 2007. 2 Because hedge funds use leverage and take long and short positions, the total assets in U.S. equity-related strategies, in Table IV, differ from the net holdings of U.S. equity implied by the allocations in Table I. The Appendix explains how I calculate the estimates in both tables.
  • 13. Table IV Assets Invested in Hedge Funds and Funds of Hedge Funds, 1991–2007, and Hedge Fund and Fund of Fund Fees, 1996–2007 Assets invested are in billions of dollars and are measured at the beginning of the year. The total for all hedge funds is from Hedge Fund Research (HFR). I use HFR’s categorization of funds and the U.S. weight among all developed equity markets to estimate the U.S. equity-related hedge fund assets. The estimate of U.S. equity-related fund of fund assets assumes funds of funds invest proportionately among hedge fund categories. All but the last column of fees are value-weight averages of individual fund fees computed using the HFR database and are in percent. The last column is in billions of dollars. The management fee (Mgmt Fee) is a fixed percent of assets in the fund. The quoted performance fee is a fraction of the fund’s profits. The actual performance fee is measured relative to the beginning-of-year assets. The Appendix describes how the actual performance fee is computed. Averages of the annual fees (and standard errors) are reported for 1996–2007 and 2000–2007. The data for 1996 start in May. The management fee and quoted performance fee for 1996 are annualized, but the actual performance fee is not. Fees Assets Invested U.S. Equity-related Hedge Funds Funds of Hedge Funds U.S. Equity-related Hedge Fund plus All Performance Fee Performance Fee Fund of Fund Hedge Hedge Funds of Mgmt Mgmt Funds Funds Funds Fee Quoted Actual Total Fee Quoted Actual Total Percent Dollars 1991 38.9 8.3 0.4 1992 58.4 14.1 4.8 1993 95.7 24.9 9.6 1994 167.8 39.8 17.9 1995 167.4 38.6 17.2 1996 185.8 46.2 14.0 0.92 18.24 3.79 4.71 1.16 9.45 3.41 4.57 9.27 2.8 1997 256.7 72.4 14.8 1.05 18.40 5.40 6.45 1.28 9.29 2.57 3.85 10.30 5.2 1998 367.6 126.5 25.5 0.98 18.25 2.56 3.54 1.18 11.41 0.21 1.39 4.93 4.8 The Cost of Active Investing 1999 374.8 141.4 28.6 1.03 18.24 5.91 6.94 1.33 8.24 1.68 3.01 9.95 10.7 2000 456.4 176.1 29.4 1.09 18.42 2.35 3.44 1.26 7.99 0.38 1.64 5.08 6.5 2001 490.6 203.3 34.6 1.20 18.93 1.51 2.71 1.24 7.22 0.27 1.51 4.22 6.0 2002 539.1 243.4 46.3 1.24 19.09 1.38 2.62 1.11 7.12 0.34 1.45 4.07 7.0 2003 625.6 253.1 83.7 1.25 19.12 3.40 4.65 1.14 6.96 1.23 2.37 7.02 13.8 2004 820.0 313.4 112.1 1.23 19.03 2.28 3.51 1.12 6.98 0.78 1.90 5.41 13.1 2005 972.6 348.1 128.4 1.26 19.03 2.18 3.44 1.15 7.09 0.47 1.62 5.06 14.1 2006 1105.4 372.8 133.1 1.27 18.95 3.25 4.52 1.17 7.12 0.76 1.93 6.45 19.4 2007 1464.5 458.6 205.4 1.28 19.15 3.35 4.63 1.12 6.94 0.73 1.85 6.48 25.0 1996–2007 1.16 18.74 3.11 4.26 1.20 7.98 1.07 2.26 6.52 (0.03) (0.11) (0.41) (0.39) (0.02) (0.41) (0.29) (0.30) (0.63) 2000–2007 1.23 18.97 2.46 3.69 1.16 7.18 0.62 1.78 5.47 1549 (0.02) (0.08) (0.28) (0.29) (0.02) (0.12) (0.11) (0.10) (0.38)
  • 14. 1550 The Journal of Finance The often mentioned “2 and 20” overstates the typical hedge fund fee. In 2007, for example, the value-weight average management fee is 1.28%, not 2%, and the value-weight average quoted performance fee is 19.15%, not 20%. (These averages do not change much if I use all funds, not just U.S. equity-related assets.) The standard “1 and 10” is a better description of the average manage- ment fee for funds of funds, but it overstates the average quoted performance fee by about 3% after 2001. How much do hedge fund investors pay to beat the market? Averaging over the annual value-weight averages for 1996–2007, the typical investor in U.S. equity-related hedge funds pays a management fee of 1.16% of assets and a realized performance fee of 3.11%. Equivalently, the hedge fund industry must generate average annual abnormal returns of 4.26% over this period for the typical investor to break even. The average performance fee is extraordinarily high in 2 of the first 4 years of the sample, 5.40% in 1997 and 5.91% in 1999. If we focus on the results for 2000–2007, the average drops a bit, but investors still pay an annual combined fee of 3.69% over this 8-year period. Hedge fund clients who invest through funds of funds pay two layers of fees. Averaging over the annual averages for 1996–2007, the typical fund of fund investor pays 2.26% in fund of fund fees and 4.26% in hedge fund fees. Thus, the underlying hedge funds must generate an average abnormal annual return of 6.52% for him to break even. If we throw out the first 4 years, the averages are lower—1.78% for the fund of fund fee and 5.47% for the total fee—but the threshold for investor success is still high.3 These estimates include only hedge fund and fund of fund fees. Among other things, they ignore the legal expenses, accounting and auditing fees, custody costs, and board fees that are paid by the funds. Although I am not able to measure these costs for hedge funds, I can use data from CRSP to infer the cost of comparable services for mutual funds. Specifically, the cost is the difference between a mutual fund’s reported expense ratio and the sum of its management and 12b-1 fees, which are both available in the CRSP database after 2000. The average of the annual value-weight averages for U.S. equity mutual funds for 2001 to 2006 is 21 basis points. My estimates of hedge fund costs also miss most of the payments they make to their prime brokers. These include financing costs, security lending fees, and charges for settling transactions done at other brokers. I do, however, capture the trading costs of hedge funds in the estimates I discuss next. V. Trading Costs Stoll (1993) develops a simple way to measure the aggregate cost of trading. The total commissions, bid-ask spreads, and other costs investors pay for trad- ing services must equal the total revenue brokers and dealers receive for those 3 Brown, Goetzmann, and Liang (2004) use the TASS hedge fund database to estimate realized performance fees for 1995–2003, and their annual average is higher than mine in 6 of the 8 years our periods overlap.
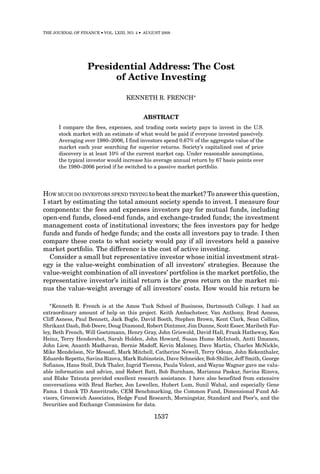
  • 15. The Cost of Active Investing 1551 services. As Stoll (1993) shows, one can measure this revenue with informa- tion from the Financial and Operational Combined Uniform Single (FOCUS) reports that registered securities firms must file with the Securities and Ex- change Commission each year. The trading revenue in the FOCUS reports in- cludes commissions, which firms earn when they facilitate agency trades as a broker, and the gains or losses firms earn from market making. The process I use to extract this information, which is described in the Appendix, is almost identical to that used in Stoll (1993). The FOCUS reports do not allow me to estimate three important components of trading revenue. Firms trading for retail investors are able to borrow money from clients at below market rates (typically through cash sweep accounts), make margin loans to clients at above market rates, and earn revenue by lend- ing securities held in street name, including those in margin accounts. Consider Charles Schwab, a large discount brokerage firm. The firm’s finan- cial statements show that in 2006 Schwab brokerage clients had an average daily balance of 17.86 billion dollars in interest-bearing cash accounts, with an average return of 2.38%. At the same time, Schwab lent clients 10.25 billion in margin loans at an average rate of 8.17%. As a rough estimate, the 5.79% spread in interest implies Schwab added 590 million dollars to its 2006 revenue by borrowing 10.25 billion dollars from some clients and lending it to others. And that still leaves 7.61 billion in the cash accounts. If Schwab invested this money in 30-day Treasury bills, which returned 4.81% in 2006, the opportunity to borrow 7.61 billion at 2.38% added another 185 million to its income. The total revenue Schwab earned by borrowing from and lending to its brokerage clients in 2006, 775 million dollars, almost matches the 785 million it reported in commissions and trading gains for the year. Of course, this revenue is not free. In a competitive market, it is simply part of the compensation Schwab and other firms receive for providing brokerage services. This revenue and the revenue retail brokers earn by lending securities held in street name belong in my estimates of the total cost of trading. Unfor- tunately, I cannot isolate this income in the FOCUS data and few firms provide Schwab’s level of detail in their financial statements. As a result, the revenue is missing from my estimates of trading costs. Before turning to the estimates of cost, it is useful to look at the amount of trading investors do each year. Figure 1 shows the annual turnover of U.S. stocks from 1926 to 2007. The estimates use data from CRSP and include NYSE, Amex (starting in July 1962), and NASDAQ (1973) stocks with share codes of 10 or 11. (The Appendix explains how I deal with the double counting of trades on NASDAQ.) The turnover for a year is the sum of the 12 monthly estimates, which I measure as the ratio of the total dollar volume for the month (shares traded times beginning-of-month price) divided by the total market cap at the beginning of the month. The general pattern in Figure 1 is striking. Turnover is above 110% in the 1920s. It reaches a high of 143% in 1928, then plunges with the market to 52% in 1932. By 1938 it is below 20%. In light of recent experience, it is perhaps surprising that annual turnover remains close to or below 20% from 1938 to
  • 16. 1552 The Journal of Finance Figure 1. Annual turnover of NYSE, Amex, and NASDAQ stocks, in percent, 1926–2007. 1975. Turnover rises fairly steadily over the next three decades from 20% in 1975 and 59% in 1990, to an impressive 173% in 2006 and 215% in 2007. Because they are not operating companies with CRSP share codes of 10 or 11, ETFs are not in the turnover in Figure 1. During the last few years of the sample, however, ETFs are heavily traded. Standard & Poor’s Depository Receipts (Spiders) are the most extreme, with total volume of 2.3 billion dollars in 2006 and 5.9 billion in 2007. If I include domestic equity ETFs in my measure, aggregate turnover jumps from 173% to 208% in 2006 and from 215% to 284% in 2007. What explains the extraordinary growth in trading between 1975 and 2007? Reduced costs are surely part of the story. The introduction of negotiated bro- kerage commissions in 1975, the development of electronic trading networks, the decimalization of stock prices in 2000 and 2001, and the SEC’s implemen- tation of rules designed to increase market transparency and liquidity, such as Reg NMS, all reduce the cost of trading U.S. equities during this period. But even at the end of the sample, trading is not free. From the perspective of the negative sum game, it is hard to understand why equity investors pay to turn their aggregate portfolio over more than two times in 2007. The estimates from the FOCUS data, in Table V, confirm that the cost of trading falls a lot between 1980 and 2006. In fact, despite the explosive growth of trading during the last 6 years of the period, the total amount investors pay to trade declines by more than 35%, from 50.7 billion dollars in 2000 to 32.1 billion in 2006. The decline in the cost of trading is even more striking if we
  • 17. The Cost of Active Investing 1553 Table V Annual Revenue Received by Securities Firms for Executing Trades of U.S. Equity, 1980–2006 The data come from the FOCUS reports that broker and dealers file annually with the SEC. Commissions from exchange trades and OTC trades are commissions received for executing trades on an exchange and over the counter. Gains from market making include trading profits from OTC equities, gains on derivative trading desks in equity products, and gains on firm security trading accounts with associated hedges. Total revenue and the three components of total revenue are measured in billions of dollars. The Appendix describes how these values are calculated. Cost relative to volume, in basis points, is total revenue divided by total dollars traded on the NYSE, Amex, and NASDAQ. Commissions from Exchange OTC Gains from Total Cost Relative Trades Trades Market Making Revenue to Volume 1980 4.1 1.0 1.0 6.1 146 1981 3.8 1.1 0.8 5.8 131 1982 4.3 1.2 0.9 6.4 117 1983 5.9 2.0 1.9 9.8 106 1984 5.0 1.7 1.3 8.0 88 1985 5.8 2.2 1.8 9.7 82 1986 7.2 2.8 2.5 12.5 73 1987 8.7 3.2 2.6 14.5 63 1988 6.2 2.5 2.0 10.7 66 1989 7.2 2.6 2.2 12.1 64 1990 6.1 2.6 2.0 10.7 64 1991 7.2 3.3 3.2 13.8 71 1992 7.8 4.1 3.9 15.8 69 1993 9.1 5.3 4.8 19.2 64 1994 8.6 5.2 4.5 18.3 57 1995 10.3 6.5 5.5 22.2 51 1996 11.3 8.3 6.6 26.2 45 1997 13.2 9.5 7.2 29.8 37 1998 14.6 10.4 7.7 32.7 32 1999 16.3 14.2 9.3 39.8 27 2000 18.2 17.6 14.9 50.7 23 2001 16.3 12.7 8.0 36.9 23 2002 16.0 12.8 4.6 33.4 21 2003 14.0 13.8 3.8 31.7 22 2004 13.8 15.0 3.6 32.4 16 2005 13.0 13.9 3.9 30.7 13 2006 12.2 13.7 6.2 32.1 11 standardize by the amount traded. Measured relative to total volume, the cost of trading declines (or remains constant) in all but 3 years between 1980 and 2006. The cumulative effect is a 92% reduction in trading costs, from 146 basis points in 1980 to a tiny 11 basis points in 2006. As we see next, this reduction has a significant effect on the resources investors spend in their search for superior returns.
  • 18. 1554 The Journal of Finance VI. The Cost of Trying to Beat the Market Table VI summarizes my estimates of the amount society pays to invest in the U.S. stock market. There are four components: the fees and expenses paid by those who purchase open-end funds, closed-end funds, and exchange-traded funds; investment management costs paid by institutions; fees paid by hedge fund investors; and trading costs paid by all investors. To make the costs easier to interpret, I standardize each year’s dollar cost by the average capitalization Table VI Society’s Standardized Cost of Investing, in Basis Points, 1980–2006 The standardized cost is the total dollar cost of investing divided by the aggregate market cap, which is the average of the 12 beginning-of-month values of all NYSE, Amex, and NASDAQ stocks with CRSP share codes of 10 or 11. The aggregate market cap is in billions of dollars. The contribution of mutual funds to the standardized cost is the total percent of U.S. equity in funds, from Table I, (Allocation, in percent) times the value-weight average of the fees and expenses of mutual funds, in Table II (Fees, in basis points). Similarly, the contribution of institutions is the sum of their allocations, from Table I, times the average of their investment management costs, from Table III. The contribution of hedge funds is the dollar cost of hedge fund and fund of fund fees, in Table IV, divided by total market cap, and the contribution of trading costs is the dollar cost, in Table V, divided by total market cap. The four components of the standardized cost and the total standardized cost are in basis points. Standardized Cost Mutual Funds Institutions Market Mutual Hedge Cap Allocation Fees Allocation Fees Funds Institutions Funds Trading Total 1980 1,103 5.2 208 46.9 34 11 16 55 82 1981 1,269 4.9 225 49.1 33 11 16 46 73 1982 1,166 5.5 196 52.1 32 11 17 55 82 1983 1,635 6.6 185 53.9 32 12 17 60 89 1984 1,639 7.3 192 55.4 31 14 17 49 80 1985 1,853 7.9 182 56.7 30 14 17 53 84 1986 2,335 9.8 180 52.8 31 18 16 54 87 1987 2,720 11.0 178 53.0 29 20 16 53 88 1988 2,470 10.4 187 50.3 30 19 15 43 78 1989 2,824 11.1 173 50.7 28 19 14 43 76 1990 2,837 11.4 165 52.9 28 19 15 38 71 1991 3,210 11.4 151 53.2 27 17 14 43 74 1992 3,771 13.3 152 53.1 28 20 15 42 77 1993 4,344 16.6 144 52.8 29 24 15 44 83 1994 4,624 19.0 143 53.4 30 27 16 40 83 1995 5,381 20.7 137 52.0 29 28 15 41 85 1996 6,881 23.3 132 48.8 25 31 12 4 38 85 1997 8,768 24.5 125 45.1 24 31 11 6 34 82 1998 10,864 25.4 119 43.6 23 30 10 4 30 75 1999 13,235 25.7 116 37.6 22 30 8 8 30 76 2000 15,675 25.6 117 37.5 24 30 9 4 32 75 2001 13,068 24.8 114 38.4 25 28 10 5 28 71 2002 11,288 25.3 112 41.3 27 28 11 6 30 75 2003 10,814 27.3 109 41.5 23 30 10 13 29 81 2004 13,183 30.0 104 41.5 22 31 9 10 25 75 2005 14,324 31.7 98 40.6 24 31 10 10 21 72 2006 15,450 34.0 95 40.0 23 32 9 13 21 75
  • 19. The Cost of Active Investing 1555 Figure 2. Fees, expenses, and trading costs relative to aggregate market cap, in basis points, 1980–2006. of NYSE, Amex, and NASDAQ stocks during the year. The components of the standardized cost are in Figure 2. A. The Total Cost of Investing The average of the total standardized costs for 1980–2006, in Table VI, is 79 basis points. On average, society spends 0.79% of the aggregate value of U.S. equity to invest each year. Although the path is not smooth, the sum of the four components in Figure 2 falls gradually over time. The investment process consumes 0.82% of total market cap in 1980 and 0.75% in 2006. There is a much larger drop in the standardized cost of trading. Investors spend 0.55% of the value of NYSE, Amex, and NASDAQ stocks to trade in 1980 and only 0.21% in 2006. Thus, during a 26-year period in which annual turnover grows from 42% to 173%, the trading revenue of brokers and dealers declines from about two-thirds of society’s total cost of investing to less than one-third. Much of the decline in trading costs is offset by an increase in the cost of mu- tual funds. Driven mostly by falling open-end loads, the value-weight average cost per dollar invested in U.S. equity funds, in Table VI, drops fairly steadily from a stiff 2.08% in 1980 to 0.95% in 2006. But the allocation to mutual funds increases by more, from only 5.2% of U.S. equity in 1980 to 34.0% in 2006. The net result is a tripling of the standardized cost, from 11 basis points in 1980 to
  • 20. 1556 The Journal of Finance 32 basis points in 2006. Almost all of this growth occurs before 1995. During the last 12 years of the sample, society’s annual cost of investing in mutual funds is between 0.28% and 0.32% of aggregate market cap. Institutional investors hold between 37.5% and 56.7% of the U.S. market during the 1980–2006 period. Because of their large allocation, the manage- ment costs institutions incur have a big impact on the total resources society spends to invest. Per dollar invested, the value-weight average cost for insti- tutions is always much lower than the average fees and expenses of mutual funds (Table VI). (I use the costs of the four groups in 1986 to compute the value-weight average for institutions in 1980–1985.) The biggest difference is in 1981, when the value-weight average cost is 2.25% for funds and only 0.33% for institutions. Although institutional costs do not fall as quickly as fund costs, the shift by institutions toward passive equity strategies and the reduction in the costs institutions pay for both active and passive investments (Table III) lower their average cost substantially, from 0.34% of institutional assets in 1980 to 0.23% in 2006. This decline, coupled with first an increase then a decrease in the institutional allocation, creates almost a step function in Figure 2. From 1980 to 1995, institutional investors pay between 0.14% and 0.17% of the value of all NYSE, Amex, and NASDAQ stocks to manage their U.S. equity portfolios. The annual cost to society drops by about six basis points during the next 2 years, and remains between 8 and 11 basis points from 1997 to 2006. If we ignored hedge funds, Figure 2 would say that society’s cost of investing in U.S. equity falls a lot over time, from 0.82% of aggregate market cap in 1980 to 0.62% in 2006. Although the big shift from direct holdings to mutual funds pushes up the cost of investing, this effect is overwhelmed by the reduction in trading costs and, to a lesser extent, the decline in institutional management costs. The net effect would be a 24% reduction in the cost of investing per dollar of stock market wealth. But we cannot ignore hedge funds. Measured in dollars, hedge fund and fund of fund fees on U.S. equity-related assets jump from 2.8 billion in 1996 to 19.4 billion in 2006 and 25.0 billion in 2007 (Table IV). The standardized cost is equally impressive. Fees on U.S. equity-related hedge fund assets, in Table VI, grow from 0.04% of the value of the market in 1996 to 0.13% in 2006. Given the relatively small size of the industry, these seem like big numbers. The fees hedge fund and fund of fund clients pay to invest 458.6 billion dollars in 2006, for example, are 36% higher than all the costs institutions pay to invest 6.18 trillion. Hedge fund fees absorb about two-thirds of the reduction in the other costs of investing, but they do not claim them all. Though the process is not smooth, the total cost of investing—including hedge fund fees—falls from 0.82% of ag- gregate market cap in 1980 to 0.75% in 2006. B. The Cost of Investing if Everyone Is Passive Passive investors incur some costs. Thus, the incremental cost of active in- vesting is the difference between society’s total cost, in Table VI and Figure 2,
  • 21. The Cost of Active Investing 1557 and the resources that would be consumed if all investors followed a passive strategy. I make several assumptions to estimate society’s cost of investing pas- sively. First, investors in mutual funds switch to a passive mutual fund whose cost matches the highest expense ratio among the share classes of Vanguard’s Total Stock Market Index, an open-end fund that holds NYSE, Amex, and NAS- DAQ stocks.4 (Vanguard started the fund in 1992, so I use the expense ratio for that year as the cost before 1992.) Second, institutions also move their U.S. equity investments to a passive market portfolio. For most institutions, the cost of this portfolio is the cost of the passive DB investments monitored by CEM Benchmarking. Defined contribution plans pay a bit more. As in the esti- mates in Table III, their cost is the passive DB cost plus the average difference between the costs of passive DC and DB plans. (I use the 1991 estimates for 1980–1990.) Third, I continue to assume that there are no fees and expenses associated with direct holdings and ESOPs. Fourth, in the passive scenario hedge fund investments are reallocated proportionately among direct holdings, mutual funds, and institutions. Finally, I assume that if all investors follow a passive strategy, total turnover is 10% a year. This assumption has a big impact on my results and, because the cost of trading declines over time, the impact is bigger early in the period. Lowering the assumed turnover to 5%, for example, cuts my estimate of the cost of passive investing by 6.7 basis points in 1980 and only 0.5 basis points in 2006. Passive investors trade for two reasons, to accommodate cash f lows and to maintain target risk-return tradeoffs. When thinking about the appropriate turnover for the passive scenario, it is important to remember that a large slice of the market would be held by passive institutions with only modest inf lows and outf lows. Moreover, most f lows from mutual fund clients would cross at the fund level, without any need for trading. Although a lower passive turnover may be appropriate, the 10% assumption is conservative because it pushes up the estimated cost of passive investing and lowers my estimate of the resources investors spend to beat the market. The results of these calculations are in Table VII. The components of society’s cost of investing in the passive scenario are muted versions of the actual costs in Table VI. Because of the shift from direct holdings to mutual funds (Table I), the standardized cost of mutual funds increases from 1.1 basis points in 1980 to 6.5 basis points in 2006. The 60% reduction in the institutional cost of passive investing (Table III) and the modest reduction in the allocation to institutions over time (Table VI) combine to lower institutional costs from 3.6 basis points to only 1.2 basis points. Though not surprising, the drop in trading costs is most dramatic. The standardized cost in 1980, 13.3 basis points, is 11 times the cost of 1.2 basis points in 2006. The net result is a 50% reduction in the standardized cost of passive investing, from 0.180% of the value of all NYSE, Amex, and NASDAQ stocks in 1980 to 0.089% in 2006. 4 Vanguard holds large stocks in proportion to their market caps, but it samples small stocks, overweighting some and holding no shares of others. Sampling reduces the fund’s custodial costs and expense ratio. Its impact on trading costs is ambiguous.
  • 22. 1558 The Journal of Finance Table VII Standardized Cost of Passive Investing, in Basis Points, and Incremental Cost of Active Investing, in Basis Points and Billions of Dollars, 1980–2006 The standardized cost of passive would be the cost of investing if all U.S. equity were held passively and is measured relative to the market cap of all NYSE, Amex, and NASDAQ stocks. Actual − Passive, the incremental cost of active in basis points, is the standardized cost of investing (Table VI) minus the passive cost. The average of the annual differences is reported for 1980–2006. Price discovery, the incremental cost of active in billions of dollars, is Actual − Passive times the aggregate market cap. Standardized Cost of Passive Incremental Cost of Active Mutual Total Actual − Price Funds Institutions Trading Cost Passive Discovery 1980 1.1 3.6 13.3 18.0 64 7.0 1981 1.0 3.7 11.7 16.5 56 7.2 1982 1.1 3.9 10.8 15.8 67 7.8 1983 1.4 4.0 10.6 15.9 74 12.0 1984 1.5 3.9 8.7 14.2 66 10.8 1985 1.7 4.0 8.1 13.8 70 13.1 1986 2.1 3.7 7.2 13.0 74 17.4 1987 2.3 3.8 6.3 12.4 76 20.7 1988 2.2 3.6 6.6 12.4 65 16.1 1989 2.3 3.6 6.4 12.3 64 18.0 1990 2.4 3.8 6.4 12.6 59 16.6 1991 2.4 3.8 7.0 13.2 61 19.6 1992 2.7 2.9 6.9 12.4 65 24.4 1993 3.3 3.2 6.4 13.0 70 30.5 1994 4.7 3.6 5.7 14.1 69 31.9 1995 4.1 2.9 5.1 12.2 73 39.1 1996 4.7 2.5 4.5 11.6 73 50.5 1997 4.9 2.2 3.7 10.7 71 62.1 1998 5.1 2.0 3.2 10.2 65 70.5 1999 5.1 1.4 2.7 9.3 67 88.8 2000 5.1 1.6 2.3 9.1 66 103.9 2001 5.0 1.7 2.3 9.0 62 80.4 2002 5.1 1.7 2.1 8.9 66 74.8 2003 5.5 1.2 2.2 8.9 72 78.3 2004 5.7 1.2 1.8 8.6 66 87.3 2005 6.0 1.2 1.4 8.6 63 90.7 2006 6.5 1.2 1.2 8.9 66 101.8 1980–2006 67 C. The Cost of Active Investing We are now ready to answer the central question. The average difference between the actual standardized cost of investing and the passive cost for the 1980–2006 period, in Table VII, is 67 basis points. On average, active investors spend 0.67% of the total market cap each year on what, in aggregate, is a futile search for superior returns. If we assume that society will continue to spend
  • 23. The Cost of Active Investing 1559 the current real dollar cost of active investing forever and that the expected real return on the U.S. stock market is a constant 6.7%, the capitalized cost is 10% of the current value of the market. This estimate is conservative. First, the estimates in Fama and French (2002) and Graham and Harvey (2005) suggest that the long-term equity risk premium is far below 6.7%. If so, the expected real return on the market is almost certainly below 6.7%. Second, the data imply that the annual dollar cost of active investing will grow with the aggregate market cap. Positive expected growth and a lower discount rate both push the capitalized cost above 10%. In short, if the social benefit of active investing is price discovery, the annual cost is 0.67% of the aggregate value of the market and the capitalized cost is at least 10% of the value. Figure 3 plots the difference between the actual and passive costs of invest- ing. Standardized by aggregate market cap, the cost of active investing is re- markably stable. All but 3 of the 27 estimates for 1980–2006—including all of the estimates after 1990—are between 61 and 74 basis points. There is also little evidence of a time trend in the incremental cost. The average difference between the actual and passive costs in Table VII is 66 basis points for the first half of the period and 68 basis points for the second half. Of course, the lack of a time trend is driven in part by the assumption of 10% turnover in the passive scenario. If passive turnover is 5%, the standardized cost of try- ing to beat the U.S. stock market falls by three basis points from 1980 to 2006, and if passive turnover is 15%, the standardized cost rises by eight basis points over the period. Figure 3. The difference between the actual and passive costs of investing, in basis points, 1980–2006.
  • 24. 1560 The Journal of Finance Table VII also reports the dollar cost of active investing. This is the aggregate market cap (from Table VI) times the difference between the standardized ac- tual and passive costs of investing. With 10% passive turnover, the incremental cost per dollar invested is relatively constant over time, so the total dollar cost grows with the market. The cost of active investing is 7.0 billion dollars in 1980, 30.5 billion in 1993, and 101.8 billion in 2006. Thus, in 2006 investors searching for superior returns in the U.S. stock market consume more than 330 dollars in resources for every man, woman, and child in the United States. Finally, the results in Table VII allow me to address a closely related question. How would a small but representative investor’s return change if he switched from the value-weight combination of all investors’ strategies to a passive mar- ket portfolio? Because the combination of all investors’ portfolios is the market portfolio, the representative investor’s initial return is the gross return on the market minus the value-weight average of all investors’ costs. Any trading gains, losses, and other transfers between investors happen within his portfo- lio and have no effect on his return. This is not the case if the representative investor switches to a passive market portfolio. Trading gains and security lending fees paid by active investors to borrow shares from the passive portfo- lio, for example, push up his return and trading losses lower it. Thus, to use the cost of investing in the passive scenario to measure the return when the representative investor switches, I have to assume there is no net transfer be- tween the passive market portfolio and other investors. With this assumption, the return on the passive market portfolio is the gross return minus the passive cost in Table VII, and the representative investor increases his return by the difference between the actual and passive costs when he switches to the passive market portfolio. The performance of Vanguard’s Total Stock Market Index suggests the no-net- transfer assumption is reasonable. The fund underperforms the value-weight market return from the Center for Research in Security Prices (CRSP) by only 2.1 basis points a month, or about 25 basis points a year, from its inception in 1992 to September 2006. If we add the fund’s average expense ratio of 21 basis points to its return, the shortfall drops to 4 basis points per year. A small fraction of the fund’s assets is typically in cash. Reversing this cash drag would add another 7 basis points to the fund’s average gross return, pushing it 3 basis points above the average market return. This positive net transfer is almost exactly equal to the fund’s average annual revenue from security lending from 1998 to 2007. And if I were able to add back the commissions the fund pays to trade, the difference between the fund’s gross return and the market return would rise even further. The standard error of the monthly difference between the fund return and the market return is about 1.5 basis points, so it is important to not put too much weight on these results. Nonetheless, there is no evidence that investors in Vanguard’s Total Stock Market Index suffer at the hands of active investors. Analysis of Fidelity’s Spartan Total Market Index Fund produces a similar conclusion. The evidence from the Vanguard and Fidelity funds suggests the no-net- transfer assumption is conservative. Thus, it seems safe to use the cost of
  • 25. The Cost of Active Investing 1561 investing in the passive scenario to estimate the returns one could earn on a passive market portfolio. If so, a representative investor who switches to a passive market portfolio would increase his average annual return by 67 basis points from 1980 to 2006. VII. Summary and Conclusions I compare the resources society spends to invest in the U.S. stock market with what would be spent if everyone followed a passive strategy. My estimate of the actual cost of investing—the fees and expenses paid for mutual funds, the investment management costs paid by institutions, the fees paid to hedge funds and funds of funds, and the transaction costs paid by all traders—is 0.82% of the value of all NYSE, Amex, and NASDAQ stocks in 1980 and 0.75% in 2006. In the passive scenario, investors pay passive fees, annual turnover is 10%, and there are no hedge funds. As a result, the cost of investing is only 0.18% of the aggregate market cap in 1980 and 0.09% in 2006. The difference between the actual and passive estimates measures the cost of active investing. The average difference for 1980–2006 is 0.67%. Thus, from society’s perspective, the average annual cost of price discovery is 0.67% of the total value of domestic equity and the capitalized cost is at least 10% of the current market value. From a typical investor’s perspective, the message is more challenging. If there is no net transfer between a passive market portfolio and other investors, the average annual return on the passive portfolio is 67 basis points higher than the value-weight average of all investors’ returns. Thus, if a representative investor switched to a passive market portfolio, he would increase his average annual return by 67 basis points over the 1980– 2006 period. Hedge fund fees in 2007 are a stark illustration of the negative sum nature of active trading. The value-weight average fee on U.S. equity-related hedge fund assets in 2007 is 4.63% and the average fund of fund fee is 1.85%. Since fund of fund investors must pay both their own funds’ fees and the fees of the underlying hedge funds, the typical fund of fund investor does not break even in 2007 unless U.S. equity-related hedge funds generate average abnormal returns of 6.48%. There are 458.6 billion dollars invested in hedge funds at the beginning of 2007, so even if we ignore the other costs they incur, hedge funds must take 29.7 billion dollars in abnormal profits from other U.S. equity investors for their fund of fund clients to break even. The total capitalization of the U.S. market is 16.53 trillion dollars at the beginning of 2007, so a 29.7 billion dollar transfer would reduce the value-weight average return of all nonhedge fund investors by about 18 basis points. Of course, if passive investors do not participate in the transfer the burden for active investors is even higher. They must contribute about 22 basis points of their U.S. equity holdings in 2007 for fund of fund investors to break even. And these losses would be on top of the active investors’ own fees, expenses, and trading costs. Whether fund of fund investors break even or not, a passive market portfo- lio produces a higher return than the aggregate of all active portfolios. Why
  • 26. 1562 The Journal of Finance do active investors continue to play a negative sum game? Perhaps the domi- nant reason is a general misperception about investment opportunities. Many are unaware that the average active investor would increase his return if he switched to a passive strategy. Financial firms certainly contribute to this con- fusion. Although a few occasionally promote index funds as a better alternative, the general message from Wall Street is that active investing is easy and prof- itable. This message is reinforced by the financial press, which offers a steady f low of stories about undervalued stocks and successful fund managers. Overconfidence is probably the other major reason investors are willing to incur the extra fees, expenses, and transaction costs of active strategies. There is evidence that overconfidence leads to active trading. (See, for example, Odean (1998), Barber and Odean (2001), and Statman, Thorley, and Vorkink (2006).) Investors who are overconfident about their ability to produce superior returns are unlikely to be discouraged by the knowledge that the average active trader must lose. Statman (2004) offers another behavioral explanation for active investing. He suggests that, in addition to expected return and risk, investors are concerned with what he calls the expressive characteristics of their portfolios. Thus, some investors may accept a lower expected return in exchange for the bragging rights that come with a fund that has performed well. Others may give up the low cost and diversification of a passive mutual fund for the prestige of their own separate account. Finally, some investors trade actively because they really are able to produce superior returns. The existence of superior investors, however, does not explain the behavior of the average investor. Active investing is still a negative sum game. Every dollar a superior investor earns must increase the aggregate losses of all other active investors. Appendix A. Allocation of Equity The main source for the allocation of U.S. publicly traded common equity in Table I is the December 6, 2007 release of the Federal Reserve Board’s Flow of Funds Accounts. Table L.213 of the Flow of Funds Accounts reports the value of corporate equity held by various groups of investors, such as households and nonprofits, mutual funds, and insurance companies. The Fed uses the house- hold and nonprofit sector as a residual. Its allocation is the aggregate value of corporate equity minus the combined values of the other sectors. Thus, the household and nonprofit sector includes not only the publicly traded common equity held by households and nonprofits, but also preferred stock and closely held corporations. Many of the calculations in this section are to separate these pieces. I start by eliminating preferred stock. In personal correspondence, Standard and Poor’s generously provided estimates of the total value of preferred stock from their internal stock and bond database for most of the years from 1980 to
  • 27. The Cost of Active Investing 1563 2007.5 I use exponential interpolation to fill in the missing years, 1981–1985 and 1987. To expedite the discussion, below I refer to what remains in the household and nonprofit sector after subtracting preferred stock as simply the value of the household and nonprofit sector. The Federal Reserve reports separate estimates of the holdings of nonprofits for 1988–2000 (Flow of Funds Accounts table L.100a) and I use them to calculate the allocations for those years in Table I. I estimate the holdings of nonprofits in each year before 1988 as the value of the household and nonprofit sector for the year times the 1988 ratio of nonprofit holdings to the value of the household and nonprofit sector, and I use the ratio for 2000 to estimate nonprofit holdings for 2001–2007. The direct holdings of households in Table I build on estimates in Kennickell (2003, 2006). He uses information in the Fed’s triennial Survey of Consumer Finances (SCF) to measure the amount of publicly traded equity households own directly in 1989, 1992, 1995, 1998, 2001, and 2004. Kennickell’s estimates are adjusted for inf lation. After converting them back to nominal dollars, I ad- just his estimates by the annual value-weight average return on U.S. stocks, from CRSP, to infer the value of direct holdings for the missing years between 1989 and 2004. My estimate for 2002, for example, is the nominal value of Ken- nickell’s estimate for 2001 times one plus the market return for 2002 and my estimate for 2003 is the 2004 value divided by one plus the market return for 2004. I estimate the value of direct holdings for each year before 1989 and after 2004 as the value of the household and nonprofit sector for the year times either the 1989 or 2004 ratio of direct holdings to total household and nonprofit hold- ings. I assume Kennickell’s measure of households’ direct holdings of publicly traded equity includes the value of ETFs. Since the Flow of Funds Accounts has a separate allocation for ETFs, I reduce my estimate of direct holdings by the Fed’s estimate of the value of ETFs. Although investment costs differ across DB plans, DC plans, and ESOPs, the Federal Reserve combines their allocations in table L.213 of the Flow of Funds Accounts. The Fed does report the value of U.S. equity held by DB plans and DC plans in 1985–2006 in tables L.118b and L.113c. To estimate the U.S. equity held by DB plans in 2007, I assume they do not change the ratio of their holdings of U.S. equity relative to all private pension plan assets from 2006 to 2007. The Department of Labor’s website reports the total assets in DB plans and in DC plans (including ESOPs) for 1975–2005.6 I assume the DB plans’ share of the U.S. equity held by private pensions in 1980–1984 is proportional to their share of the total assets in private pensions. Thus, to estimate the U.S. equity held by DB plans in 1980–1984, I multiply the total allocation to private pensions in table L.213 by the ratio of the total assets in DB plans divided by the total assets in DB and DC plans. Both the Federal Reserve and the Department of Labor combine ESOPs with other DC plans in their estimates. The annual survey results for 1980–2006 5 I thank Shrikant Dash for this information. 6 The information is at www.dol.gov/ebsa/pdf/privatepensionplanbulletinhistoricaltables.pdf.
  • 28. 1564 The Journal of Finance from Greenwich Associates include the value-weight average fraction of DC plan assets allocated to a company’s own stock. I use this fraction to separate ESOPs from other DC plans. Thus, I start by estimating the total assets in DC plans for 1980–2007 using the approach I describe for DB plans above. I then use the data from Greenwich Associates to split ESOPs from other DC plans. (The 2007 split uses the Greenwich estimate for 2006.) To be clear, the allocation to DC plans in Table I does not include ESOPs. The Federal Reserve’s allocations in table L.213 include the foreign equity held by U.S. investors. Thus, my next step is to remove these securities by assuming they are held proportionately by all U.S. investors except ESOPs. The Flow of Funds Accounts do not include a separate allocation to hedge funds. As I describe in Section D below, I use estimates of the total assets in- vested in hedge funds, from HFR, to compute hedge fund and fund of fund fees. To avoid double counting, however, I have to reduce the U.S. equity alloca- tions of other groups of investors by the net holdings of hedge funds. Because hedge funds invest in a variety of assets, hold short and long positions, and use leverage, their net holdings of U.S. equity differ from the total assets invested. My indirect measure of net holdings multiplies HFR’s estimate of total hedge fund assets by the slope coefficient from a regression of hedge fund returns on U.S. market returns. For example, a 100 million dollar portfolio with long and short U.S. equity positions of 250 and 200 million dollars has net holdings of 50 million and a slope on the U.S. market of about 0.5. I estimate the aggregate slope for all hedge funds by regressing the monthly return (in excess of the U.S. Treasury bill rate) on the CSFB/Tremont Hedge Fund Index, a broad value-weight index of hedge funds, against the excess returns on the CRSP value-weight index of NYSE, Amex, and NASDAQ stocks. To control for correlations with other markets, I also include excess returns on MSCI’s Emerging Markets and World Ex-U.S. (developed markets) Indices in the regression. The estimated slopes (and standard errors) for January 1994, the start of the CSFB/Tremont index, to September 2007 are given by: R H F ,t = 0.44 + 0.19 RU S,t − 0.04 R Dev,t + 0.11 R Emr g ,t + et. (A1) (0.11) (0.06) (0.06) (0.03) In this regression, RHF,t is the hedge fund return in month t and RUS,t , RDev,t , and REmrg,t are the returns on the U.S., developed markets, and emerging markets indices. The adjusted regression R2 is 0.34. Asness, Krail, and Liew (2001) find that the returns on some components of the CFSB/Tremont index are correlated with lagged market returns during their 1994–2000 sample. When I add lagged market returns to regression (A1), however, the lagged slopes are indistinguishable from zero and the contempora- neous slopes are essentially unaffected. Thus, I use regression (A1) to measure the sensitivity of hedge fund returns to the U.S. market. In short, the alloca- tion to hedge funds in Table I is 19% of the total hedge fund assets reported by Hedge Fund Research. The Federal Reserve uses cross-border f lows to estimate the U.S. equity held by foreign investors. As a result, the U.S. equity held by foreign-domiciled hedge