15 09 market leader article

Marketing's magic metric Elasticity is a misunderstood and neglected metric that can help marketers choose the best prices, the best promotions, the best media and so achieve optimum brand value, a leading academic has argued. Writing in the current issue of Market Leader, Robert Shaw, honorary professor of marketing analytics at Cass Business School, described popular metrics such as awareness, engagement, loyalty and satisfaction as being helpful for brand beauty contests. "But to pragmatic decision-makers they're as useful as sunroofs on submarines," he said. Take price – "the litmus test of successful marketing" – where a premium signifies brand strength, differentiation and customer preference. Cutting the price should theoretically increase revenues and market share, but Shaw pointed to the cautionary tale of General Motors which chased market share and ended up bankrupt. "Smart decision-makers scrutinise revenue-growth and also take account of cost-growth," he averred, and they can pinpoint the precise price to optimise brand value. That could mean raising prices and conceding market share while growing brand value. Or the opposite. "There are no cast-iron generalisations and the right decision depends on the details of the value calculations," Shaw advised. A similarly pragmatic approach needs to be taken to decisions on promotions, which consumers have come to expect, but which can often damage brand value. Shaw highlighted cannibalisation and rebates as big destroyers of brand value but added that, "judiciously planned, promotions are a major source of value for brand owners". Turning to media elasticity, Shaw said this was typically much lower than price or promotional elasticity, with the law of diminishing returns setting in rapidly. But knowledge of diminishing returns curves could enable planners to set an overall media budget that would help them both to find the total budget that optimised value-added and to select a mix of media that optimised value for a given total budget. "Elasticity is not an esoteric concept," he declared. "This neglected metric deserves to be better known and more widely used."

Recomendados
Recomendados
Más contenido relacionado
La actualidad más candente
La actualidad más candente (20)
Similar a 15 09 market leader article
Similar a 15 09 market leader article (20)
Más de Robert Shaw
Más de Robert Shaw (9)
Último
Último (20)
15 09 market leader article
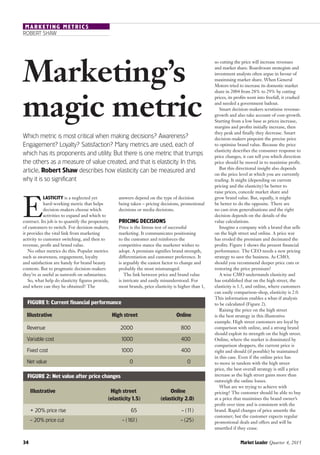
- 1. 34 Market Leader Quarter 4, 2015 answers depend on the type of decision being taken – pricing decisions, promotional decisions or media decisions. Pricing decisions Price is the litmus test of successful marketing. It communicates positioning to the customer and reinforces the competitive stance the marketer wishes to adopt. A premium signifies brand strength, differentiation and customer preference. It is arguably the easiest factor to change and probably the most mismanaged. The link between price and brand value is intricate and easily misunderstood. For most brands, price elasticity is higher than 1, Marketing’s magic metric ROBERT SHAW MARKETING METRICS so cutting the price will increase revenues and market share. Boardroom strategists and investment analysts often argue in favour of maximising market share. When General Motors tried to increase its domestic market share in 2004 from 28% to 29% by cutting prices, its profits went into freefall, it crashed and needed a government bailout. Smart decision-makers scrutinise revenue- growth and also take account of cost-growth. Starting from a low base as prices increase, margins and profits initially increase, then they peak and finally they decrease. Smart decision-makers pinpoint the precise price to optimise brand value. Because the price elasticity describes the consumer response to price changes, it can tell you which direction price should be moved in to maximise profit. But this directional insight also depends on the price level at which you are currently trading. It might (depending on current pricing and the elasticity) be better to raise prices, concede market share and grow brand value. But, equally, it might be better to do the opposite. There are no cast-iron generalisations and the right decision depends on the details of the value calculations. Imagine a company with a brand that sells on the high street and online. A price war has eroded the premium and decimated the profits. Figure 1 shows the present financial performance. The CEO needs a new pricing strategy to save the business. As CMO, should you recommend deeper price cuts or restoring the price premium? A wise CMO understands elasticity and has established that on the high street, the elasticity is 1.5, and online, where customers can easily comparison-shop, elasticity is 2.0. This information enables a what-if analysis to be calculated (Figure 2). Raising the price on the high street is the best strategy in this illustrative example. High street customers are loyal by comparison with online, and a strong brand should exploit its strength on the high street. Online, where the market is dominated by comparison shoppers, the current price is right and should (if possible) be maintained in this case. Even if the online price has to move in tandem with the high street price, the best overall strategy is still a price increase as the high street gains more than outweigh the online losses. What are we trying to achieve with pricing? The customer should be able to buy at a price that maximises the brand owner’s profit over time and is consistent with the brand. Rapid changes of price unsettle the customer; but the customer expects regular promotional deals and offers and will be unsettled if they cease. Which metric is most critical when making decisions? Awareness? Engagement? Loyalty? Satisfaction? Many metrics are used, each of which has its proponents and utility. But there is one metric that trumps the others as a measure of value created, and that is elasticity. In this article, Robert Shaw describes how elasticity can be measured and why it is so significant E lasticity is a neglected yet hard-working metric that helps decision-makers choose which activities to expand and which to contract. Its job is to quantify the propensity of customers to switch. For decision-makers, it provides the vital link from marketing activity to customer switching, and then to revenue, profit and brand value. No other metrics do this. Popular metrics such as awareness, engagement, loyalty and satisfaction are handy for brand beauty contests. But to pragmatic decision-makers they’re as useful as sunroofs on submarines. So, what help do elasticity figures provide, and where can they be obtained? The Figure1: Current financial performance Figure 2: Net value after price changes Illustrative Revenue Variable cost Fixed cost Net value High street 2000 1000 1000 0 Online 800 400 400 0 Illustrative + 20% price rise - 20% price cut High street (elasticity1.5) 65 - (161) Online (elasticity 2.0) - (11) - (25)
- 2. 100% 90% 80% 70% 60% 50% 40% 30% 20% 10% 0% Market Leader Quarter 4, 2015 35 ROBERT SHAW MArKeTing MeTrics ProMoTions decisions Promotions are temporary incentives and attention-getters. They are easy to run and brands often greatly outspend advertising with promotions. Marketers frequently disparage them and say they damage the brand; yet customers expect them and, if they are used judiciously, promotions can be the foundation of brand profitability and market share. Elasticity for promotions is often two to three times higher than the pure base price elasticity. While customers rationally assess the saving for both, for promotions the larger elasticity arises from the wording, the visual impact and the placement of the display. With promotional elasticity levels of 3 and above, at first sight the additional sales volume and market share that can be obtained looks tempting. Research by Lodish, Sharp and others indicates that promotions often damage brand value. So what goes wrong? Cannibalisation is a big destroyer of value. The promotional uplift draws volume – not only from competitors, but also from the existing brand. Often half or more of the uplift is cannibalisation. Rebate – payment for placement of display – is the other big destroyer of value. For example, if a half-price promotion on the high street (Figure 1) boosts volumes eightfold, this 700% volume increase equates to 300% revenue increase (due to the lower price) and the cost of goods grows by 700%. So the promotion would virtually eliminate all value, even before taking account of cannibalisation and rebates. Cannibalisation causes a massive loss, because half of the 700% volume increase comes from switching away from other own-brand products. Rebates add insult to injury, by making payments of hundreds of thousands of pounds for loss-making, volume-boosting promotional displays. Smart decision-makers are pragmatic about promotions, choosing configurations that are profitable. Judiciously planned promotions are a major source of value for brand owners. Badly planned, they are loss-making and damage brand equity. But promotion and pricing alone are only part of the mix, and marketing media also need to be optimised, again using elasticity. MediA decisions Elasticity is a vitally important, yet often neglected factor in media decisions. Media elasticity is much lower than price or promotional elasticity, often in the range 0.05 to 0.15. As a consequence of elasticity being so low, consumer response to media spend obeys the law of diminishing The optimum total budget is £2 million and yields an incremental brand value of £680,000 with a mix of 46% TV, 42% internet display and12% internet search. Cutting the total to £1 million slightly reduces the incremental brand value to £560,000 and the optimum mix is 40% internet display, 35% TV and 25% internet search. Increasing the budget to £4 million halves incremental brand value of £340,000 with an optimised mix of 44% TV, 37% internet display, 6% internet search and13% press. £1m £2m £3m £4m £800,000 £700,000 £600,000 £500,000 £400,000 £300,000 £200,000 £100,000 £0 Total budget Distributionofspend Valueadded Press Search TV Display Value addedPress Search TV Display Value addedPress Search TV Display Value addedPress Search TV Display Value addedPress Search TV Display Value addedPress Search TV Display Value addedPress Search TV Display Value addedPress Search TV Display Value addedPress Search TV Display Value addedPress Search TV Display Value addedPress Search TV Display Value added Figure 3: How total budget impacts brand value added and optimum spend allocation
- 3. 36 Market Leader Quarter 4, 2015 returns. This law was articulated in 1769 by Jacques Turgot as a general law of economic input and output. In the case of media, the first exposure produces a strong response but the responses produced by additional exposures rapidly tail away. This phenomenon was first described by Edward Chamberlain in 1933. Knowledge of these diminishing returns curves enables planners to set an overall media budget to do two things: ∆ To find the total budget that optimises value added ∆ To select a mix of media that optimises value for a given total budget, as shown in Figure 3. WHere To oBTAin THe MeTrics Elasticity metrics are a great starting place. In many situations a one-dimensional elasticity coefficient can depict consumer behaviour. However, in some situations, elasticity has to be generalised to two or more ‘consumer response coefficients’ to depict the multidimensional behaviours which consumers display as they switch and respond to marketing activity. For example, if demand falls sharply above a price point, then a set of more general consumer response metrics is needed. At high levels of media spend, saturation effects come into play and, again, these curves are best described by two or more metrics. Promotions are multidimensional and need more information than a single elasticity figure. These consumer response metrics can be obtained from several sources: finite difference analysis, econometric analysis, reach and frequency models and market structure models. ∆ Finite difference methods were discovered by Newton in 1687. Their application to marketing is new and has been led by pioneering work by the British mathematician Dr David Merrick. This approach enables enormously detailed promotional response metrics to be measured, pinpointing differences in duration (one, two or three weeks), frequency (monthly, quarterly), depth (cuts of 10%, 25%, 33%, 50%), details of the deal (eg half price versus BOGOF), differences between channels, between product lines, between the wording, the visual display and the placement. Such details are not available from other methods. ∆ econometrics was defined by Nobel Prize winner Ragnar Frisch in 1926 and has had a long and distinguished history. It has been applied to marketing for over 50 years and its usage has been boosted by the availability of powerful computer software and hardware. It has become the tool of choice for media agencies and marketing mix consultancies. ∆ reach and frequency methods can be used to estimate media response metrics in the absence of econometric data. They exploit the statistical laws for combining a number of Opportunities To See. ∆ Market structure models infer the consumer response from a limited description of all the competing brands in the category (including price, market share and media spend). In the best approach of this type, each brand is regarded as a member of a set of brands with which it competes, to a greater or lesser extent. The degree of competition within this ‘partially-competing set’ determines the ROBERT SHAW MArKeTing MeTrics Figure 4: Market structure diagram showing strength of inter-brand competitiveness optimal price point and media spend for each brand. In Figure 4, solid lines represent stronger competition, dotted lines weaker competition. concLusion Elasticity and the related consumer response metrics are neglected yet hard-working numbers. They provide decision-makers with powerful tools for choosing the best prices, promotions and media and achieving the optimum brand value. Price elasticity shows whether the brand should take a more premium position or whether it should go downmarket. Promotional elasticity shows where to spend rebates to maximise brand value and how to avoid tactics that drive volume up and value down. Media elasticity shows the optimum mix that maximises brand value. Elasticity is not an esoteric concept. Whether you are data-rich or -poor, there is always an answer. For the data-poor, you can use market structure models and reach and frequency. For the data-rich there are finite difference methods and econometrics. This neglected metric deserves to be better known and more widely used. Robert Shaw is honorary professor of marketing analytics at Cass Business School rs@robert-shaw.com Brand A Brand B Brand c Brand d Brand e Brand F Brand g Brand H Brand i Brand J Finite difference methods were discovered by Newton in 1687. They enable enormously detailed promotional response metrics to be measured