SlideShare una empresa de Scribd logo
1 de 59
Descargar para leer sin conexión
LBNL-41842


                             ERNEST ORLANDO LAWRENCE
                             BERKELEY NATIONAL LABORATORY


                   India’s Cement Industry:
                 Productivity, Energy Efficiency
                     and Carbon Emissions


                           Katja Schumacher and Jayant Sathaye

                     Environmental Energy Technologies Division


                                                July 1999


This work was supported by the Environmental Science Division, Office of Biological and Environmental Research
(OBER), Office of Energy Research, U.S. Department of Energy, under Contract No. DE-AC03-76SF00098.
Disclaimer

This document was prepared as an account of work sponsored by the United States
Government. While this document is believed to contain correct information, neither
the United States Government nor any agency thereof, nor The Regents of the
University of California, nor any of their employees, makes any warranty, express or
implied, or assumes any legal responsibility for the accuracy, completeness, or
usefulness of any information, apparatus, product, or process disclosed, or represents
that its use would not infringe privately owned rights. Reference herein to any specific
commercial product, process, or service by its trade name, trademark, manufacturer, or
otherwise, does not necessarily constitute or imply its endorsement, recommendation,
or favoring by the United States Government or any agency thereof, or The Regents of
the University of California. The views and opinions of authors expressed herein do not
necessarily state or reflect those of the United States Government or any agency
thereof, or The Regents of the University of California.

Ernest Orlando Lawrence Berkeley National Laboratory is an equal opportunity
employer.
LBNL-41842


               India’s Cement Industry:
Productivity, Energy Efficiency and Carbon Emissions


         Katja Schumacher* and Jayant Sathaye


                  Energy Analysis Program
          Environmental Energy Technologies Division
            Lawrence Berkeley National Laboratory
                     Berkeley, CA 94720


   *
       Fax: (510) 486-6996, Email: KBSchumacher@lbl.gov


                          July 1999
ACKNOWLEDGEMENTS


The authors would like to thank Joyashree Roy, Ernst Worrell, Puran
Mongia, Alan Sanstad, and Dian Phylipsen for their valuable assistance and
comments on previous drafts of this paper. This work was supported by the
Environmental Science Division, Office of Biological and Environmental
Research (OBER), Office of Energy Research, U.S. Department of Energy,
under Contract No. DE-AC03-76SF00098.


                                                                             ii
Abstract
Historical estimates of productivity growth in India’s cement sector vary from indicating
an improvement to a decline in the sector’s productivity. The variance may be traced to
the time period of study, source of data for analysis, and type of indices and econometric
specifications used for reporting productivity growth. We derive both growth accounting
and econometric estimates of productivity growth for this sector. Our results show that
over the observed period from 1973-74 to 1993-94 productivity increased by 0.8% as
indicated by the Translog index. Calculations of the Kendrick and Solow index support
this finding. The increase was mainly driven by a period of progress between 1983 and
1991 following partial decontrol of the cement sector in 1982. Before 1983, productivity
declined probably due to government protection regarding prices and distribution,
inefficiencies in plant operation and constraints in essential input factors. Between 1991
and 1993, the sector suffered a downfall in accordance with overall economic recession.
Using a translog specification the econometric analysis reveals that technical progress in
India’s cement sector has been biased towards the use of energy and capital, while it has
been material and labor saving. We examine the current changes in structure and energy
efficiency undergoing in the sector. Our analysis shows that the Indian cement sector is
moving towards world-best technology, which will result in fewer carbon emissions and
more efficient energy use. However, substantial further energy savings and carbon
reduction potentials still exist.


                                                                                        iii
Table of Contents
List of Tables                                         vi

List of Figures                                        vii

1. Introduction                                        1

2. Cement Industry                                     2

   2.1. The Cement Industry in Context                 2

   2.2. Cement Process                                 3
       2.2.1. Raw Material Preparation                 4
       2.2.2. Clinker Production                       4
       2.2.3. Finish Grinding                          4

   2.3. Cement Production in India                     5
       2.3.1. Raw Materials                            8
       2.3.2. Energy Use                               8

   2.4. Policy                                         9

3. Statistical and Econometric Analysis                12

   3.1. Statistical Analysis                           12
       3.1.1. Previous Studies                         13
           3.1.1.1. Partial Productivity               13
           3.1.1.2. Total Factor Productivity Growth   17
       3.1.2. Own Estimates                            17
           3.1.2.1. Partial Productivity               17
           3.1.2.2. Total Factor Productivity          19
           3.1.2.3. Total Productivity                 21

   3.2. Econometric Analysis                           23
       3.2.1. Previous Studies                         23
       3.2.2. Own Estimates                            23

   3.3. Discussion                                     25


                                                             iv
4. Future Development of the Cement Sector                   28

   4.1. Ongoing Changes in the Cement Industry               28

   4.2. Potentials for Energy Efficiency Improvements        30
       4.2.1. India versus Best Practice                     30
       4.2.2. Categories for Energy Efficiency Improvement   33
       4.2.3. Barriers to Energy Efficiency Improvement      33

   4.3. Scenarios of Future Energy Efficiency                34

   4.4. Effects on Carbon Dioxide Emissions                  38

5. Summary and Conclusions                                   40

References                                                   40

Appendix                                                     44


                                                                  v
List of Tables
Table 2.1 Economic Indicators for the Cement Industry
Table 2.2 Regionwise Cement Production, Capacity, and Capacity Utilization
Table 2.3 Technology Mix for Cement Production in India
Table 2.4 Energy Consumption in Indian Cement Industry (1991-93)
Table 2.5 Fuel Consumption in Cement Industry 1991-1993
Table 2.6 Overview of Policies Regarding the Cement Industry (1973-93)

Table 3.1 Partial Productivity Growth
Table 3.2 Total Factor Productivity Growth
Table 3.3 Total Productivity Growth
Table 3.4 Decomposition of Growth in Value of Output
Table 3.5 Estimated Parameters for the Translog Cost Function Approach
Table 3.6 Technical Change Bias
Table 3.7 Price Elasticities and Allen Partial Elasticities of Substitution
Table 3.8 Elasticities of Substitution – Qualitative Overview

Table 4.1 Expansion of Cement Manufacturing Capacities
Table 4.2 Projected Cement Production
Table 4.3 Specific Energy Consumption: India vs. Best Practice
Table 4.4 Energy Savings Potentials in India’s Cement Industry (1993)
Table 4.5 Scenarios for Energy Consumption in 2001, 2006 and 2011
Table 4.6 Carbon Dioxide Emissions: India vs. Best Practice
Table 4.7 Total Carbon Dioxide Emissions


                                                                              vi
List of Figures
Figure 2.1 Changes in Physical Energy Intensity of Various Industries
Figure 2.2 Production and Installed Capacity – Small and Large Cement Plants

Figure 3.1 Estimates of Partial Productivity Growth: Capital
Figure 3.2 Estimates of Partial Productivity Growth: Labor
Figure 3.3 Estimates of Capital-Labor Ratio
Figure 3.4 Estimates of Total Factor Productivity Growth
Figure 3.5 Index of Partial Productivity
Figure 3.6 Index of Total Factor Productivity
Figure 3.7 Index of Total Productivity

Figure 4.1 Frozen Efficiency vs. Best Practice in Indian Cement Industry


                                                                               vii
1. Introduction

The cement industry presents one of the most energy-intensive sectors within the Indian
economy and is therefore of particular interest in the context of both local and global
environmental discussions. Increases in productivity through the adoption of more
efficient and cleaner technologies in the manufacturing sector will be effective in merging
economic, environmental, and social development objectives. A historical examination of
productivity growth in India’s industries embedded into a broader analysis of structural
composition and policy changes will help identify potential future development strategies
that lead towards a more sustainable development path.

Issues of productivity growth and patterns of substitution in the cement sector as well as
in other energy-intensive industries in India have been discussed from various
perspectives. Historical estimates vary from indicating an improvement to a decline in the
sector’s productivity. The variation depends mainly on the time period considered, the
source of data, the type of indices and econometric specifications used for reporting
productivity growth. Regarding patterns of substitution most analyses focus on interfuel
substitution possibilities in the context of rising energy demand. Not much research has
been conducted on patterns of substitution among the primary and secondary input
factors: Capital, labor, energy and materials. However, analyzing the use and substitution
possibilities of these factors as well as identifying the main drivers of productivity growth
among these and other factors is of special importance for understanding technological
and overall development of an industry.

In this paper, we contribute to the discussion on productivity growth and the role of
technological change within the context of global environmental change. We introduce the
cement industry in more detail taking into account industry specific aspects such as
structural composition, production, technologies, energy consumption within processes,
environmental impacts, sector specific policies etc. Subsequently, we derive both statistical
and econometric estimates of productivity growth for the cement sector over time. For the
statistical analysis we calculated partial and total productivity in a growth accounting
framework while for the econometric analysis a translog cost function approach is
employed to estimate productivity growth, technical change biases and substitution
elasticities. The results are then interpreted within a broader context of structural and
policy changes in the sector as well as other sector specific aspects.

Future energy use and carbon emissions depend mainly on the level of production and the
technologies employed. Furthermore, different economic and policy settings affect
structures and efficiencies within the sector. The final section therefore examines the
ongoing changes in the cement industry structure. It compares world best technologies to
Indian technologies and identify potentials and barriers to the achievement of efficiency
improvements. A scenario analysis concludes the report in highlighting the energy
efficiency and productivity improvements that could be achieved by employing more
efficient technologies.


                                                                                           1
2. Cement Industry

2.1 The Cement Industry in Context

In the course of this study, six industries in India have been identified as energy-intensive
industries: Aluminum, cement, fertilizer, iron and steel, glass, and paper. Together they
account for 16.8% of manufacturing value of output (VO) and for 38.8% of all fuels
consumed in the manufacturing sector (Table 2.1). The cement sector holds a considerable
share within these energy-intensive industries. In 1993, it accounted for 11.7% of the
value of output within the six industries and for 2.0% of that in the manufacturing sector.

Table 2.1: Economic Indicators for the Cement Industry
                                 Unit           Cement        Aggregate of Six     Aggregate
                                                              Energy-intensive    Manufacturing
                                                                 Industries
Growth in Value of
Output1
Nominal
1973-1993                         % p.a.       16.7                16.4                 15.1
         1973-1983                % p.a.       18.8                18.1                 15.3
         1983-1991                % p.a.       17.5                15.4                 14.6
         1991-1993                % p.a.        3.2                12.2                 16.2
Real
1973-1993                         % p.a.        8.7                 7.9                   7.4
         1973-1983                % p.a.        6.3                 8.6                   7.7
         1983-1991                % p.a.       13.7                 8.9                   6.9
         1991-1993                % p.a.        0.4                 0.4                   7.3
In 1993-94:
VO Share in Aggr.              Sector VO/      2.0%               16.8%                100%
Manufacturing (nominal)        Manuf. VO
Nom. Sector Fuel Share in      Sector Fuel/   10.3%               38.8%                100%
Aggr. Manuf. (nominal)         Manuf. Fuel
Fuel Cost Share in             Sector Fuel/   35.5%               15.8%                 6.8%
Value of Output (nominal)       Sector VO
Source: Government of India, ASI: Summary Results for the Factory Sector (various years).
1
  calculated as exponential annual growth.

Production in the cement sector has been increasing over the last 20 years. Over the study
period 1973-1993, real VO increased by an average of 8.7% p.a. Following the fertilizer
industry the cement sector shows second highest growth in the group of energy-intensive
industries. Major cement-specific policy changes took place in 1982 and 1989. As seen in
Table 2.1 growth of real value of output was around 6.3% during the period of total
control (1973-1983). It increased significantly to 13.7% in the following period of partial
and eventually total decontrol (1983-91), accounting for higher than average growth in
both the group of six energy-intensive industries and total manufacturing. After 1991, the
real value of output growth was substantially lower at 0.4% until 1993.


                                                                                                  2
Figure 2.1: Changes in Physical Energy Intensity of Various Industries
(Real Fuel Cost/Real Value of Output - 1973-74 values)

  0.35


  0.30


  0.25


  0.20


  0.15


  0.10


  0.05


  0.00                                                                                                                                                                                                                                                                                                                                                                                                                               Years

             7   4               7   5               7   6               7   7               7   8               7   9               8   0               8   1               8   2               8   3               8   4               8   5               8   6               8   7               8   8               8   9               9   0               9   1               9   2               9   3               9   4
      7   3-              7   4-              7   5-              7   6-              7   7-              7   8-              7   9-              8   0-              8   1-              8   2-              8   3-              8   4-              8   5-              8   6-              8   7-              8   8-              8   9-              9   0-              9   1-              9   2-              9   3-
 19                  19                  19                  19                  19                  19                  19                  19                  19                  19                  19                  19                  19                  19                  19                  19                  19                  19                  19                  19                  19


                                                                  Paper                                        Fertilizer                                        Glass                                   Cement                                           Iron & Steel                                                Aluminum                                           Total Manufacturing


The cement sector accounts for 10.3% of total fuel costs in the manufacturing sector. The
fuel cost share, fuel costs per unit of output (VO), in the cement sector is more than two
times higher than the average fuel cost share of the six energy-intensive industries and
amounts to more than five times the average of total manufacturing. Within the group of
energy-intensive industries the sector, therefore, holds the lead in energy intensity
measured as the nominal value of fuels consumed compared to the nominal value of
output. Figure 2.1 displays the energy intensity of the cement sector in real values. The
‘real-value’ indicator reflects the changes in physical energy intensity over time and gives a
comparison to other sectors. Except for aluminum, cement production has been most
energy intensive not only in 1993 but almost over the whole time period. Despite its
fluctuating pattern it shows a relatively stable trend over time.

2.2. Cement Process

Cement acts as a bonding agent, holding particles of aggregate together to form concrete.
Cement production is highly energy intensive and involves the chemical combination of
calcium carbonate (limestone), silica, alumina, iron ore, and small amounts of other
materials. Cement is produced by burning limestone to make clinker, and the clinker is
blended with additives and then finely ground to produce different cement types. Desired
physical and chemical properties of cement can be obtained by changing the percentages
of the basic chemical components (CaO, Al2O3, Fe2O3, MgO, SO3, etc.).


                                                                                                                                                                                                                                                                                                                                                                                                                                             3
Most cement produced is portland cement: other cement types include white, masonry,
slag, aluminous, and regulated-set cement. Cement production involves quarrying and
preparing the raw materials, producing clinker through pyroprocessing the materials in
huge rotary kilns at high temperatures, and grinding the resulting product into fine
powder. The following detailed description is borrowed from the World Energy Council
(1995).

2.2.1 Raw Materials Preparation

Raw materials preparation involves primary and secondary crushing of the quarried
material, drying the material (for use in the dry process) or undertaking a further raw
grinding through either wet or dry processes, and blending the materials. The energy
consumption in raw materials preparation accounts for a small fraction of overall primary
energy consumption (less than 5%) although it represents a large part of the electricity
consumption.

2.2.2. Clinker Production

Clinker production is the most energy-intensive step, accounting for about 80% of the
energy used in cement production in the United States. Produced by burning a mixture of
materials, mainly limestone (CaCO3), silicon oxides (SiO2), aluminum, and iron oxides,
clinker is made by one of two production processes: wet or dry; these terms refer to the
grinding processes although other configurations and mixed forms (semi-wet, semi-dry)
exist for both types.

In the wet process, the crushed and proportioned materials are ground with water, mixed,
and fed into the kiln in the form of a slurry. In the dry process, the raw materials are
ground, mixed, and fed into the kiln in their dry state. The choice among different
processes is dictated by the characteristics and availability of raw materials. For example, a
wet process may be necessary for raw materials with high moisture content (greater than
15%) or for certain chalks and alloys that can best be processed as a slurry. However, the
dry process is the more modern and energy-efficient configuration.

Once the materials are ground, they are fed into a kiln for burning. In modern kilns, the
raw material is preheated (in four to five stages) using the waste heat of the kiln, or it is
pre-calcined. During the burning or pyroprocessing, the water is first evaporated after
which the chemical composition is changed, and a partial melt is produced. The solid
material and the partial melt combine into small marble-sized pellets called clinker.

2.2.3 Finish Grinding

Cooled clinker is ground in tube or roller mills and blended by simultaneous grinding and
mixing with additives (e.g., gypsum, anhydrite, pozzolana, fly-ash or blast furnace slags)
to produce the cement. Drying of the additives may be needed at this stage.


                                                                                            4
2.3 Cement Production in India

Following China, Japan and the US, India is the fourth largest cement-producing country
in the world. In 1996, around 115 large cement plants within 57 cement companies and
about 300 small plants produced 76.2 million tonnes1 (Mt) cement per year. Ownership is
mostly private (85% of installed capacity) and centralized for the large plants with four
production houses controlling most units. This has led to financial and administrative
integration of different factories. (Datt and Sundharam, 1998) Installed capacity increased
considerably between 1970 and 1996, particularly in the last few years following complete
deregulation of the cement sector. While in the two decade period from 1970 to 1990
total installed capacity rose by around 47 million tonnes from 17 million tonnes to 64
million tonnes, within only 6 years between 1990 and 1996 it increased by another 41
million tonnes to 105 million tonnes of installed capacity.

Figure 2.2: Production and Installed Capacity - Small and Large Cement Plants
             Mt
       110


       100


        90                 Capacity: Large Plants            Capacity: Small Plants

                           Production: Large Plants          Production: Small Plants
        80


        70


        60


        50


        40


        30


        20


        10


         0                                                                                                                                      Year
             1980   1981      1982    1983     1984   1985    1986     1987    1988     1989   1990   1991   1992   1993   1994   1995   1996


Source: Karwa (1998).

Production, however, did not increase accordingly. Due to a high frequency of power
failures, shortage of coal, inadequate availability of wagons for rail transportation, limited
availability of furnace oil etc. capacity utilization decreased steadily from as high as 90% in
1978 to a low point of 67% in 1980-81. Following policy changes towards deregulation in
the early and late 1980s capacity utilization reimproved to 82% in 1991-92. Yet, since
then it has again shown a decreasing trend to 72% in 1996-97. (Datt and Sundharam,
1998; Karwa, 1998) Figure 2.2 shows installed capacity and production for large as well

1
    metric tonnes, sometimes abbreviated as t, or million tonnes as Mt in the following.


                                                                                                                                                       5
as small plants. Appendix A gives production, capacity and capacity utilization from 1970-
96 for India as a whole and Table 2.2 by region for 1995-96.

Table 2.2 shows that, in 1995-96, cement production in India is regionally quite dispersed
with major clusters in the west and the south. Installed capacity as well as production is
highest in the west. However, as capacity utilization at 90.9% is substantially better in the
south, cement output in the south is only slightly lower than in the west. This pattern -
high levels of installed capacity at relatively low utilization level in the west resulting in
roughly the same output as in the south where capacity utilization is higher at lower levels
of installed capacity - can be observed for previous years 1991-1995 as well. It is
noteworthy that, in contrast to the national development, capacity utilization in the south
improved continuously between 1991 and 1995.

Table 2.2: Regionwise Cement Production, Capacity, and Capacity
Utilization (million tonnes)                           Year: 1995-96
Region            Capacity         Production         Capacity Utilization (%)
North               18.3              12.1                      66
East                  7.3              4.6                      63
West                38.6              25.9                      67
South               23.9              21.7                      91
All India           88.2              64.4                      73
Source: Karwa (1998).

The viability of the location plays a major role in the economics of cement manufacturing.
It is determined by factors such as proximity to raw materials (limestone, coal), distance to
market areas as well as availability of continuous power supply. Proximity to limestone
deposits contributes considerably to pushing down costs in transportation of heavy
limestone. If units are located close enough to limestone resources, trucks can be used to
move limestone over the short distance instead of relying on scarce railway capacity.

The proximity of coal deposits constitutes another important factor in cement
manufacturing. Generally, coal is transported by railway throughout the country. Coal
distribution and coal prices are strictly controlled by the government. Although coal
deposits are located all over the country constraints in availability of wagons for railway
transportation have led to major shortfalls in the amount of coal received against the quota
assigned to the cement industry. For the year 1973, Chakravarty (1989) computed losses
in cement production due to coal shortages of up to 37%. However, they were
considerably lower at 10% in 1981 and have since steadily decreased. In 1987, coal
shortage accounted for only 0.4% of production losses.

In order to reduce transportation as well as capital costs, to increase regional development
and to make use of smaller limestone deposits many small and mini cement plants with a
capacity of up to 650 tonnes per day were set up in dispersed locations in India. As seen in
Figure 2.2, construction of such plants began in the early 1980s and amounted to 180 mini
cement plants in 1992 together producing 3 Mt (about 6% of total cement production)


                                                                                            6
and 311 plants producing 5 Mt (7.3% of total cement) in 1996. (World Energy Council,
1995; International Cement Review, 1998).

Despite the advantages, there were several drawbacks associated with the setting up of
units in dispersed areas, mainly due to increased distances to market areas other than the
local markets. Limits in transportation capacity, particular in rail transport, constrained the
delivery of cement from the production site to the consumer. Consequently, due to lack of
storage capacity (silos) at the production site producers were often forced to cut back
cement production. Only in recent years the government finally allowed the cement
industry to purchase and own rail wagons to overcome these problems.

Demand for cement has been growing at rates of up to 10% p.a. in the past. While in 1987
demand was about 37 million tonnes (Mt), it reached 53 Mt in 1993 and further increased
to more than 65 Mt in 1995 (CMA, 1994 and Karwa, 1998). Providing a main input for
construction, cement consumption is highly dependent on activities in the construction
sector which are in turn dependent on governmental and private investment in
infrastructure and buildings. Appendix B provides gross value added in the construction
sector from 1977-95. During most of the past, demand could not be met by national
production. Therefore, imports had to fill the balance. Since 1987, however, cement
production has increased and India reached self-sufficiency. And, more recently exports,
particularly to neighboring countries, have been increasing. (Mittal, 1994)

At present the Indian cement industry produces 13 different varieties of cement employing
three different process types. Amongst the varieties, Ordinary Portland Cement (OPC),
Portland Pozzolana Cement (PPC) and Portland Slag Cement (PSC) constitute the major
shares accounting for almost 99% in total production. Ordinary Portland Cement is most
commonly used in India. It holds a share of about 70% in total production. PPC
production accounts for about 18% of total cement production while PSC assumes a share
of only 11%. (Karwa, 1998) Generally, the two varieties, PSC and OPC, can be used for
same purposes, while PPC cannot be used for prestressed and high strength concrete, as
used in bridges and airports (Das and Kandpal, 1997)

Cement is produced using the wet, the semi-dry, and the dry processes. The shareo f the
wet process in total installed capacity has declined from over 90% in 1960 to only 12%
today (Table 2.3). The wet process has been substituted by the significantly less energy-
using dry process over time. Following the two oil price shocks the shift in technology mix
has become substantial. The dry process nowadays accounts for the majority (86%) of
India’s cement production. Due to new, even more efficient technologies, the wet process
is expected to be completely pushed out in the near future.

The semi-dry process never played an important role in Indian cement production. Its
share in total installed cement capacity has been small over time. It currently accounts for
2% of total production. Mini cement plants usually use vertical shaft kilns for cement
production.


                                                                                             7
Table 2.3 Technology Mix (%) for Cement Production in India
Technology                   1960                     1970           1980            1993         1997
Dry process                   1.1                     21.5           32.7            82.0         86.0
Semi-dry process              4.5                      9.0            5.7             2.0          2.0
Wet process                  94.4                     69.5           61.6            16.0         12.0
Source: TERI, 1994; Karwa (1998).

2.3.1 Raw Materials

Limestone presents the major raw material input to cement production. High quality
limestone is accessible almost all over the country. For the production of OPC, clay and
gypsum serve as additives while the production of PPC and PSC requires additives that
can be taken from industrial wastes such as fly ash and blast furnace slag respectively.
Neither of these inputs currently places any constraint in terms of availability or quality on
the production of cement. Fly ash can be recovered as a waste product from electricity
generation while slag residues from blast furnace of steel plants.

2.3.2 Energy Use

Energy consumption per tonne of cement varies from technology to technology. The dry
process uses more electrical but much less thermal energy than the wet process. Overall, it
requires substantially less total energy. Additionally, as shown in Table 2.4 energy
consumption per tonne of clinker (cement respectively) in the dry process has been
declining over the past. The increase in final energy consumption in 1993 is solely due to
an increase in the clinker/cement ratio for that year.

Table 2.4 Energy Consumption in Indian Cement Industry (1991-1993)
Process                               Thermal Energy                  Electricity                Final Energy
                                        GJ/t clinker                  GJ/t cement                GJ/t cement*
                                   1991    1992      1993        1991    1992     1993      1991     1992    1993
Dry Process Plants                  3.58     3.47     3.41       0.43    0.41     0.40      3.45     3.30     3.40
Semi Dry Process Plants             4.02     3.95     3.95       0.44    0.42     0.41      3.82     3.71     3.88
Wet Process Plants                  5.53     5.69     5.61       0.39    0.39     0.36      5.05     5.13     5.29
Source: Karwa (1998).
*
    calculated for a clinker-cement ratio of 0.842 (1991), 0.833 (1992), 0.878 (1993).


Primary energy consumption in a typical dry process Portland Cement Plant as found in
industrialized countries consists of up to 75% of fossil fuel consumption and up to 25% of
electricity consumption. Within the fuel category pyroprocessing requires the most energy,
consuming 99% of the fuel energy while electricity is mainly used to operate both raw
material (33%) and clinker (38%) crushing and grinding equipment. In addition, electricity
is needed for pyroprocessing (22%) making it by far the most energy intensive step of the
production process. India’s cement units are generally less energy efficient using both
more thermal and electrical energy. However, the shares of energy used within the
different sections of production are about the same. (Karwa, 1998)


                                                                                                                     8
Table 2.5: Fuel Consumption in the Indian Cement Industry 1991-1993
Fuel                           Units        1991-92            1992-93             1993-94
Electricity*                   GWh          4800.52            6420.97             6754.60
Coal                            Mt            10.8               11.7                11.1
Petroleum Products              Mt           0.293              0.296               0.291
Total Cement Production         Mt            53.6               54.1                58.0
Source: TERI (1996, 1997); Government of India, ASI (1991-1993).
*
 Electricity consumption includes purchased and captive power (excluding sales).

About 94% of the thermal energy requirement in the Indian cement manufacturing is met
by coal. The remaining part is met by fuel oil and high speed diesel oil (see Table 2.5). So
far, no real substitute for coal exists. Increasing the oil share would imply significant
outflows of foreign exchange and impose a burden on the economy. Natural gas is mainly
used as feedstock in newly-built large fertilizer plants and is thus not sufficiently available
for the cement industry.

Actual coal consumption varies with qualitative factors. Over the years there has been a
steady decline in the quality of coal. In particular, the ash content of coal has increased
implying lower calorific values of coal, and improper and inefficient burning, ash ring
formation in the kiln etc. Coal consumption thus had to be increased to provide the energy
needed for clinker production resulting in additional costs for transportation, handling,
grinding and burning of coal. In order to reduce these problems the cement industry
started implementing coal washeries which reduce the ash content of coal at the mine
itself.

Generally, power is provided by the State Electricity Boards. Yet, problems in power
supply, such as frequent power cuts, power failures and low voltage, impose immense
problems on the cement industry. Interruption of power affects the industry negatively by
causing production losses and low capacity utilization, idle running of equipment during
stop and restart of the plant, thermal losses during reheating, damages to refractory etc.
Cement companies have therefore started installing captive power to ensure continuos
running of process plants and emergency equipment. In 1993, 974 GWh of electricity was
produced onsite (Government of India, Annual Survey of Industry, 1993).

2.4 Policy

The Indian cement sector has been under strict government control for almost the whole
period since independence in 1947. Government intervention took place both directly and
indirectly. Direct intervention happened in the form of government control over
production capacity and distribution of cement, while indirect intervention took the form
of price control.

Table 2.6 provides a summary overview of major policy changes between 1951 and today.
Three significant periods can be distinguished: First, the period of total control where both
prices and distribution of output were strictly regulated by the government. Second, the


                                                                                             9
period of partial decontrol starting in Feb. 1982 and finally the period since 1989 when all
price and distribution controls were withdrawn.

The price and distribution control system on cement, implemented after liberalization in
1956, aimed at ensuring fair prices to producers and consumers all over the country, thus
reducing regional imbalances, and at reaching self-sufficiency within a short time horizon.
Because of slow growth in capacity expansion and continued cost increases, the
government had to increase the fixed price several times. However, these price increases
as well as financial incentives (tax returns on capital) to enhance investment showed little
to no effect on the industry. In 1977, higher prices were allowed for cement produced by
new plants or major expansions of existing plants. Due to sustained slow development the
uniform price imposed by the government was substituted by a three tier price system in
1979. Different prices were assigned to cement produced in low, medium and high cost
plants.

However, further increases of input costs (including those that were likewise regulated by
the government such as fuel and power costs as well as wages) could not be neutralized
adequately and in time. Thus, the controlled price did not reflect the true economic cost
and profit margins dwindled increasingly deterring essential investments in capacity and
production expansion. A permit system introduced by 14 states and unified territories in
the 1970s comprised direct control over public distribution of cement to ensure fair
supplies to priority sectors, discourage consumption of cement for non-priority and
essential purposes. Furthermore, it was thought to facilitate cement availability to small
users and to eliminate black marketing. However, the system resulted in artificial
shortages, extensive black marketing and corruption in the civil supply departments of the
government (Datt and Sundharam, 1998).

The system of price control was accompanied by a policy of freight pooling. The price
control fixed a uniform price according to estimated production costs at which cement
was required to be sold all over the country. This price contained a freight component that
was averaged over the country as a whole. If the actual freight component experienced by
a particular firm was lower than the element included in the uniform price, producers had
to pass on to the pool a sum representing the difference between the uniform price freight
component and the freight costs incurred by them. On the other hand, if the actual freight
incidence was higher than the freight element accounted for in the uniform price,
producers were reimbursed the difference.

The freight pooling system promoted equal industrial development all over the country. It
supported regional dissemination and ensured that cement was available at equal prices in
any part of the country. Yet, it also implied that producers had no incentive in locating
production such that transportation costs of cement would be minimized. Market distance
became a less important issue. As a result of non optimal location of industries, average
costs of production as well as demand for scarce railway capacity increased. (Ahluwalia,
1985 and Chakravarty, 1989)


                                                                                         10
Table 2.6: Overview of Policies Regarding the Cement Industry (1973 - 1993)
Period        Policy                      Specifics                         Notes
1951 – 1982   Price and Distribution
              Control
April 1975                                14% tax return on capital         Did not show any noticeable
                                          employed                          impact on industry
1977                                      12% post tax return on net        Showed effect on output
                                          worth
Until 1978                                Uniform retention price
May 1979                                  Three tier price system
                                          (different retention prices for
                                          low, medium and high cost
                                          plants)
Feb. 1982     Partial Decontrol           Levy Obligation, Uniform          Retention price slightly
                                          Retention Price                   lower for PPC than OPC,
                                                                            specific mini units exempted
                                                                            from price and distribution
                                                                            control
1982-1988                                 Progressive decrease in levy      See table below
                                          and increase in retention price
Since 1986                                Rebate in excise duty for new
                                          plants
March 1989    Withdrawal of all price
              and distribution controls
Until 1989    Freight Pooling                                               No freight pooling for non
                                                                            levy cement since 1982
Until 1991     Industrial licensing
Source: Indian Economy (1998), Ahluwalia (1985, 1991), and Chakravarty (1989).

On account of these difficulties in the cement industry the government of India introduced
a system of partial decontrol in 1982. A levy quota of 66.6% for sales to government and
small house builders was imposed on existing units while for new and sick units a lower
quota at 50% was established. Levy cement was fixed uniformly for OPC and slightly
lower for PPC. The balance of 33.4% could be sold in the free open market to general
consumers. A ceiling price was set for sales in the open market in order to protect
consumers from unreasonable high pricing. Under the system of partial decontrol non levy
cement was no longer covered by freight pooling. Furthermore, specific mini cement units
were completely freed from price and distribution controls. Although overall profitability
increased substantially immediately after the introduction of partial decontrol, profits
obtained through non-levy sales decreased with greater availability of cement in the
market and continuously rising input costs.

To sustain an accelerating course the government subsequently introduced changes in levy
obligations and retention prices. At four points in time the government simultaneously
reduced levy quotas and increased retention prices. As a result, in late 1988 the levy quota
was as low as 30% for units established before 1982 and the retention price had increased
substantially. In addition, during 1982 and 1987 the ceiling on non-levy prices was
increased occasionally. In 1987, the cement manufacturers association and the government
decided that there was no further need for a maximum price ceiling.


                                                                                                         11
Finally, in 1989, the industry was considered to be prepared for free market competition
and all price and distribution controls were withdrawn. The system of freight pooling was
abandoned and a subsidy scheme to ensure availability of cement at reasonable prices in
remote and hilly regions of the country was worked out. By removing all controls in the
cement sector the government hoped to accelerate growth and induce further
modernization and expansion investments.

3. Statistical and Econometric Estimates

3.1 Statistical Analysis

A variety of studies on productivity growth and technological change in Indian industries
has been carried out so far. Originally these studies were driven by an interest in
understanding the capital vanishing phenomena in the Indian industry between 1950 and
1980. During that time, labor productivity as well as capital availability and use increased
considerably, while the overall growth rate of the economy stagnated at low levels (see
Ahluwalia, 1991). Concerned about the efficiency of resource use researchers started
investigating productivity growth and input factor substitutions for aggregate
manufacturing as well as various industries. The results of these analyses differed
substantially depending on the methodology, statistical specification employed as well as
on the underlying sources of data, levels of aggregation and time periods considered.

Over time more sophisticated and refined methodologies in connection with longer time
series were employed to study productivity change. The contribution of total factor
productivity to output growth was of primary interest to explain the continously low
economic development. Partial factor productivity was investigated to better understand
the importance of each factor of production and to evaluate substitution possibilities. In
this context, the role of energy within the production process received increasing attention
and consequently, besides the primary factors of production (capital and labor), energy
and materials were added as secondary input factors into the analyses.

Total factor productivity growth (TFPG) measures the growth in gross value added
(GVA) in excess of the growth of a weighted combination of the two inputs capital and
labor. For measuring output in form of gross value added all intermediate inputs are
deducted. Thus, gross value added only provides the value that is actually added in the
production process by using the two primary inputs of production: capital and labor. Total
Productivity Growth, in contrast, relates gross value of output (VO) to the four input
factors capital, labor, energy and materials. Since it accounts for intermediate inputs as
well as primary inputs, value of output provides the more appropriate output measure if
interested in analyzing energy and material as well as capital and labor.

Commonly, three major growth accounting approaches are considered for estimating total
factor productivity as well as total productivity growth: the Translog Index, the Solow
Index and the Kendrick Index. The three indices differ in their complexity and the


                                                                                         12
underlying economic assumptions. A detailed derivation of the three indices is provided in
a survey report by Mongia and Sathaye (1998a). The Kendrick index is easy to understand
in using an arithmetic aggregation scheme for the inputs. It is restrictive in that it is based
on the assumption of a linear production function and in assigning constant (base year)
shares in GVA (VO respectively) to the inputs. The Solow index is slightly more general
in assuming a neo-classical, Cobb-Douglas, specification of the production function with
constant returns to scale, perfect competition in the market and factors being rewarded
their marginal products. The translog measure is based on a more complex production
function associated with only a minimum numbers of assumptions. It is therefore of more
general nature and provides the preferably used measure for productivity growth.

Partial factor productivity (PP) indices are reported for all input factors. They are obtained
by simply dividing the value figure for each factor by the gross value of output or by the
gross value added respectively. Partial factor productivity growth indicates how much
output changes in relation to a fixed amount of each single input. It measures how
“productive” a factor is. The inverse means how much of a factor has to be used to
produce a specific amount of output - it measures the factor intensity of production.
Changes over time indicate a shift in production towards more intensive use of one factor
probably accompanied by less use of another factor. Additionally, the capital labor ratio
(K-L ratio) shows how much capital per head is used in the production process and
provides a rough measure of the capital intensity of production. The tradeoff between
capital and labor is particularly interesting in the context of labor-intensive developing
countries, like India, that have put the emphasis on capital-intensive industries in its early
development stages in order to improve the overall economic situation.

Considering capital and labor productivity one should keep in mind that conceptually, in
situations where capital intensity is increasing over time, the analysis of partial
productivity changes may overstate the increase in labor productivity and understate the
increase in capital productivity (Ahluwalia, 1991). With rising capital/labor ratio resources
may shift from labor to the use of capital. Due to this shift, the measured increase in labor
productivity may be larger than the pure increase in the productivity component (i.e. the
change that is solely due to learning, learning-by-doing, improvement of skills, experience
etc.). Similarly, the increase in pure capital productivity may be higher than the measured
increase.

The next section will give an overview of previous studies that have been conducted on
productivity changes in the cement industry. Thereafter, in the following section, we
develop our own estimates for both total and partial productivity using a consistent
theoretical and empirical framework.

3.1.1 Previous Studies

Previous results for statistical estimates of total factor productivity using the Translog,
Solow and/or Kendrick index as well as measures of partial factor productivity and
production functions for the cement industry are given in Appendix C. Figures 3.1 - 3.4


                                                                                            13
display both the historical as well as our own estimates graphically. The graphical
presentation allows to immediately realize the large differences in the estimates obtained
by researchers for various points of time. The overview draws on Mongia and Sathaye
(1998a).

3.1.1.1 Partial Productivity

Capital Productivity

Partial productivity growth estimates for capital are presented in Figure 3.1. The estimates
for the different time periods range widely from positive numbers to very negative ones.
Sawhney is the only author reporting positive capital productivity growth at 1.5% for his
entire study period (1950-61). Gupta receives considerable positive growth at 8.7% for a
subperiod of his time series (1958-65). While his entire time period estimate (1946-65)
results in slightly negative growth at –0.6%, the first subperiod covering the years 1946-
58 reveals stronger capital productivity decline at –2.8%.

Arya and Mehta estimate the strongest decrease in capital productivity of all studies under
consideration, at –6.0%, and -5.6% respectively. Their time periods are similar to Gupta.
Goldar concludes a loss in productivity for the years 1960-70 at –0.4% similar to the
results from Gupta’s study. Likewise, the estimates of Ahluwalia and Arora are very close.
While Ahluwalia investigates a 25 year period from 1960 to 1985, Arora considers a
subperiod from 1973-81. Productivity declines at –1.4% in Ahluwalia’s and at –1.7% in
Arora’s study.

Labor Productivity

Historical estimates reveal by and large positive development for labor productivity for the
various time periods. Sawhney estimates a strong productivity increase of 7.3% on
average between 1950-61. For a similar time range (1946-65), Gupta points out an
increase of 2.5%, while Mehta (1953-64) concludes an average productivity loss of
–1.6%. For labor productivity Arora's results differ substantially from Ahluwalia's
estimates. For the period 1973-81, Arora indicates a decline in labor productivity of
–2.3%. For 1960-85, Ahluwalia, however, reports an increase by 1.3%. Figure 3.2
provides a summary overview of historical estimates.

Capital-Labor Ratio

The overall trend of increasing labor productivity accompanied by declining capital
productivity to some extent results from a process of capital deepening. Capital deepening
in the Indian cement sector is confirmed in most studies by growing capital labor ratios
(Figure 3.3). Both Goldar and Ahluwalia conclude a modest increase in the capital labor
ratio over time at 3.0% and 2.7% for the time periods 1960-70 and 1960-85


                                                                                         14
Figure 3.1: Estimates of Partial Productivity Growth: Capital
         Growth
         (% p.a.)

         9
                                                          Gupta
         8

         7

         6

         5
                                                                                                                  CSO
         4

         3

         2               Sinha                                                                                    CSO

         1               Sawhney

         0                                                                          Goldar
              Gupta
     -1                                                                                                                               Ahluwalia
                                                                                                                                                    Own Estimates (VO)
     -2                                                  CSO                               Arora
                                                                                                                                               Own Estimates (GVA)
                                              Gupta
     -3

     -4

     -5
                                                                 Mehta
                                                                                    Arya
     -6                                                                                                                                                                  Year
     46

              48

                     50

                           52

                                  54

                                        56

                                              58

                                                    60

                                                          62

                                                                 64

                                                                        66

                                                                               68

                                                                                     70

                                                                                             72

                                                                                                   74

                                                                                                             76

                                                                                                                   78

                                                                                                                         80

                                                                                                                                82

                                                                                                                                       84

                                                                                                                                              86

                                                                                                                                                     88

                                                                                                                                                           90

                                                                                                                                                                 92
    19

             19

                    19

                          19

                                 19

                                       19

                                             19

                                                   19

                                                         19

                                                                19

                                                                       19

                                                                              19

                                                                                    19

                                                                                           19

                                                                                                  19

                                                                                                            19

                                                                                                                  19

                                                                                                                        19

                                                                                                                              19

                                                                                                                                      19

                                                                                                                                             19

                                                                                                                                                    19

                                                                                                                                                          19

                                                                                                                                                                19
Figure 3.2: Estimates of Partial Productivity Growth: Labor

         Growth
         (% p.a.)

         8
                                                         Sawhney

         7


         6                                                                                                                                           Own Estimates (VO)

                                                                                                                                                   Own Estimates (GVA)
         5                                                 Sinha


         4


         3    Gupta                                       Goldar
                                                                                                Arya                          Arora
             Gupta
         2                                         Gupta                                 CSO
                                                                                                                                            Ahluwalia

         1
                                                                                                                  CSO

         0
                                                                                                                  CSO

     -1
                                                                Mehta

     -2                                                                                                                                                                   Year
     46

              48

                     50

                           52

                                  54

                                        56

                                              58

                                                    60

                                                           62

                                                                  64

                                                                         66

                                                                               68

                                                                                     70

                                                                                             72

                                                                                                       74

                                                                                                             76

                                                                                                                   78

                                                                                                                         80

                                                                                                                                 82

                                                                                                                                        84

                                                                                                                                               86

                                                                                                                                                     88

                                                                                                                                                           90

                                                                                                                                                                 92
    19

             19

                    19

                          19

                                 19

                                       19

                                             19

                                                   19

                                                         19

                                                                19

                                                                       19

                                                                              19

                                                                                    19

                                                                                           19

                                                                                                  19

                                                                                                            19

                                                                                                                  19

                                                                                                                        19

                                                                                                                               19

                                                                                                                                      19

                                                                                                                                             19

                                                                                                                                                    19

                                                                                                                                                          19

                                                                                                                                                                19


                                                                                                                                                                      15
Figure 3.3: Estimates of Capital-Labor Ratio
         Growth
         (% p.a.)


       8.8                                                                                   Arya

       7.8                                                                                                                                                            Own Estimates

       6.8
                                                                  Sawhney
       5.8                                                                                                                            Arora

       4.8
                                   Mehta
                                                                                                    CSO
       3.8
               Gupta                                                                           Goldar                                            Ahluwalia
       2.8
                      Sinha
       1.8

       0.8

      -0.2                                                                                                                 CSO

      -1.2

      -2.2

      -3.2

      -4.2
                                                                                                                          CSO
      -5.2                                                                                                                                                                               Year
        46

        48

        50

        52

        54

        56

        58

        60

        62

        64

        66

        68

        70

        72

        74

        76

        78

        80

        82

        84

        86

        88

        90

        92
      19

      19

      19

      19

      19

      19

      19

      19

      19

      19

      19

      19

      19

      19

      19

      19

      19

      19

      19

      19

      19

      19

      19

      19
Figure 3.4: Estimates of Total Factor Productivity Growth
        Growth Rate
          (% p.a.)
         4


         3                                                                                                                CSO (Kendrick)
                                             Gupta (Kendrick)
                                                                                     Arya (Solow)
        2     Sawhney (Kendrick)
                                                                                                                                                                 Pradhan (Translog )
  Mahopatra (Solow)
                    Sinha (Kendrick)                                                                               CSO (Kendrick)
        1
                                                                                     Goldar (Kendrick)
                       Arya (Solow)                                                                                                                       Own Estimate (Kendrick)
         0                                               CSO (Kendrick)                                    Pradhan (Translog)
                                                                                                                                                               Own Estimate (Translog)
              Gupta (Kendrick)
                                                                                                                                  Ahluwalia (Translog)
        -1
                                                                Gupta (Kendrick)                                                                               Own Estimate (Solow)
        -2
                                                                                                                             Arora (Translog)

        -3
                                       Arya (Solow)

        -4


        -5                                                                Mehta (Solow)
                                                                                                           Pradhan (Translog)
                             Mehta (Kendrick)
        -6
                                                                                                                                                               Pradhan (Translog)
        -7                                                                                                                                                                             Year
         46


                48


                       50


                              52


                                      54


                                             56


                                                    58


                                                           60


                                                                  62


                                                                         64


                                                                                66


                                                                                        68


                                                                                               70


                                                                                                      72


                                                                                                              74


                                                                                                                     76


                                                                                                                             78


                                                                                                                                     80


                                                                                                                                            82


                                                                                                                                                   84


                                                                                                                                                          86


                                                                                                                                                                 88


                                                                                                                                                                        90


                                                                                                                                                                               92
       19


              19


                     19


                            19


                                    19


                                           19


                                                  19


                                                         19


                                                                19


                                                                       19


                                                                              19


                                                                                      19


                                                                                             19


                                                                                                    19


                                                                                                            19


                                                                                                                   19


                                                                                                                           19


                                                                                                                                   19


                                                                                                                                          19


                                                                                                                                                 19


                                                                                                                                                        19


                                                                                                                                                               19


                                                                                                                                                                      19


                                                                                                                                                                             19


Note: “Own Estimates” are compound growth rates for the time period under consideration. For the translog indices they present
exponential growth.


                                                                                                                                                                                       16
respectively. Mehta obtains a capital labor ratio of 4% for the period 1953-64, while
Arora's estimate leads to a number even higher at 5.2% for the period 1973-81.

Material Productivity

Few authors consider additional inputs and productivity changes in their investigations.
Exceptions to this are Gupta and Sawhney who include material inputs in their estimations
and conclude very reverse results for the change in productivity. Gupta states a negative
growth of material productivity at an average of –1.3% between 1946 and 1965, while
Sawhney points out a positive change in productivity at 1.2% between 1950-61.

3.1.1.2 Total Factor Productivity Growth

Total factor productivity change has been investigated in various studies. The
examinations result in both positive and negative development of total factor productivity
depending on the time range and subperiods under consideration. Estimated productivity
growth is highest in the CSO study for the subperiod 1969-77 at 3.0% p.a. and lowest for
Pradhan’s study, subperiod 1982-92, at –6.8% p.a.

A cluster can be observed for growth of 1% to 2% p.a. for various time periods and
different indices. Furthermore, most studies considering more recent time periods seem to
reveal negative productivity development in the cement sector. Besides that, no clear
pattern can be identified. As mentioned above aside from the time period the study results
vary substantially with the underlying data and methodology employed.

3.1.2 Own Estimates

In this section we present in detail our own estimates for both total and partial
productivity. We develop the Translog, Solow and Kendrick index using a consistent
theoretical and empirical framework. With the recognition of energy as a critical factor for
economic growth and the special emphasis on energy use within this report, we explicitly
account for energy in using a four factor input approach (K,L,E,M) in our analysis. As a
comparison, we additionally state the results obtained from the two input factor model.
Data has been compiled for the years 1973-93 from the Annual Survey of Industries,
Government of India (various years). The methodology is explained in detail in Mongia
and Sathaye (1998).

3.1.2.1 Partial Productivity

Table 3.1 gives the partial productivity growth for the various inputs based on both value
of output and gross value added. The table indicates the growth rate over the whole time
period as well as split up by different time ranges within this period. Growth rates for the
time periods are calculated as compound growth rates and time trends. This is to be in
accordance with existing growth estimates conducted by various authors and presented in


                                                                                         17
Section 3.1.1. above. Figure 3.5 displays the partial productivity of capital, labor, energy
and material in relation to the value of output.

Table 3.1 Partial Productivity Growth                           (selected time periods, per cent p.a.)
               Capital      Labor        Energy      Material   K / L ratio    Capital      Labor
Growth         VO / K       VO / L       VO / E      VO / M        K/L       GVA / K       GVA / L
1973-93         -1.65        5.77         0.08        2.21         7.54         -1.91        5.49
1973-83         -4.95        2.97         -0.50       -0.87        8.32         -2.51        5.60
1983-91         4.16        12.13         1.10        7.05         7.65         6.36        14.50
1991-93         -7.34       -4.27         -1.03       -1.06        3.32        -26.81       -24.38
Trend Rate
1973-93       -3.53       6.56         -0.37         2.27        10.09         -2.65         7.44
Note: Compound Growth; Trend Rate calculated as semi-logarithmic time trend, significant on 5% level.

The table as well as the figure support significant changes in average productivity in the
early 1980s and again in 1991. The first ten years of the time period under consideration
(1973-83) show fluctuating patterns. Labor and capital productivity first increase and then
fall at similar rates. In 1980, a turnaround in labor productivity can be observed while
capital productivity further decreases. Energy and material productivity grow and fall at
similar rates during that period. The following period, 1983-91, substantiates a period of
progress with positive factor productivity growth for all factors. Yet, a sharp drop in
productivity interrupts the overall upward trend in 1991. Most factors indicate a positive
turn from 1992 on but for drawing further conclusion the time horizon would need to be
expanded to include more recent trends. Over the whole time period 1973-93, factor
productivity was increasing for labor and material and decreasing for capital and slightly
for energy.

Capital and labor productivity changes are of particular interest. Labor productivity
increases over the whole time period as well as for different subperiods except the years
following 1991. Labor productivity growth is by far highest at 12.1% in the period of
overall progress in the cement sector between 1983 and 1991. Conversely, capital
productivity shows an overall decreasing trend at –3.5% between 1973 and 1993. The
downward trend is continual in the late 1970s and early 1980s. In accordance with the
overall trend, capital productivity increases at 4.2% between 1983 and 1991 followed by a
modest drop after 1991. The increase in labor productivity is to some extent the result of
the process of capital deepening, the increasing use of capital per head, indicated by a high
growth in the capital labor ratio at 10.1%. Resources have shifted from labor to the use of
capital over time.

The examination of capital and labor in relation to gross value added rather than gross
value of output confirms the results for capital and labor productivity. Due to an
extraordinary drop in GVA in 1991 losses in productivity of capital and labor in relation to
GVA are of much higher values than in relation to VO. However, the results are of similar
nature in terms of direction and size of change.


                                                                                                   18
Figure 3.5: Index of Partial Productivity (KLEM and Value of Output)
based on 1973-74 constant values
     Index

    3.6


    3.2


    2.8


                           Capital
    2.4
                           Labor
                           Energy
                           Materials
    2.0


    1.6


    1.2


    0.8


    0.4                                                                                                          Year
      1973 1974 1975 1976 1977 1978 1979 1980 1981 1982 1983 1984 1985 1986 1987 1988 1989 1990 1991 1992 1993


Unlike capital and labor, energy and material follow a very similar path over the whole
time range. They show slightly decreasing growth in the first ten years of the time period
considered (1973-83). Between 1983 and 1991, however, they progress substantially with
material productivity rising at 7.05% and energy productivity at 1.1%. Thereafter,
following 1991, both energy and material productivity fall down to negative productivity
development again.

3.1.2.2 Total Factor Productivity

Total factor productivity relates the input factors capital and labor to gross value added. It
measures the growth in gross value added (GVA) that can not be explained by the growth
of a weighted combination of the two inputs capital and labor.

Figure 3.6 shows the development of total factor productivity as measured by the
Kendrick, Solow and Translog Indices over time. In addition, Table 3.2 gives total factor
productivity growth for different time periods. The growth rates for the Kendrick and the
Solow indices are estimated as compound growth rates. The Translog index, however, is
based on the assumption of exponential growth due to its logarithmic, non-linear nature.


                                                                                                                    19
Figure 3.6: Index of Total Factor Productivity
based on 1973-74 constant values
      Index
     2.0


     1.8


     1.6

                                                                             Translog
                                                                             Solow
     1.4
                                                                             Kendrick


     1.2


     1.0


     0.8


     0.6                                                                                                        Year
       1973 1974 1975 1976 1977 1978 1979 1980 1981 1982 1983 1984 1985 1986 1987 1988 1989 1990 1991 1992 1993


The three indices are related in their patterns. The Translog index fluctuates in between
the Kendrick and the Solow index. The division into three subperiods reveals similar
behavior of total factor productivity to partial productivity. The period 1973-1983 on
average shows negative growth for the Translog and Solow index (Translog: -0.22%,
Solow: -1.49%) and minimal positive growth at 0.16% for the Kendrick index. In
contrast, the second period, 1981-93, gives very positive factor productivity growth at
7.75% (Translog), 6.04% (Solow) and 8.04% (Kendrick) with a strong peak for all indices
in 1991. Following this peak, total factor productivity decreases rapidly at high rates of
26.42% to 30.23%.

Table 3.2: Total Factor Productivity Growth
(selected time periods, per cent p.a.)
Growth               Translog          Solow                   Kendrick
1973-93                -0.03            -1.66                    0.16
1973-83                -0.22            -1.49                    0.26
1983-91                 7.75            6.04                     8.04
1991-93               -30.23           -27.90                   -26.42
Time Trend
1973-93                 0.09            -1.82                    0.38
Note: Translog: Exponential Growth; Solow, Kendrick: Compound Growth.
Trend Rate calculated as semi-logarithmic time trend, significant on 5% level.


                                                                                                                  20
3.1.2.3 Total Productivity

Total productivity measures the growth in gross value of output in excess of the growth of
a weighted combination of the inputs capital, labor, energy and material. As with total
factor productivity we consider three different indices for measuring total productivity.

Table 3.3 and Figure 3.7 present the growth of the three indices and their evolution over
time. The patterns differ slightly from total factor productivity estimates due to the more
modest development of value of output over time compared to the development of gross
value added. Figure 3.7 best supports the division into the three subperiods (1973-83,
1983-91 and 1991-93). All three indices show fluctuating behavior for the first time
period, accounting for a decrease in total productivity of –1.66% (Translog), -2.50
(Solow) and –1.47 (Kendrick). Reaching a low point in 1983, total productivity increases
steadily thereafter. Total productivity growth of around 4.8% for all indices supports the
notion of overall progress in the cement industry between 1983 and 1991. Following a
peak in 1991, total productivity drops in 1992 and then again recovers slightly.

For the whole time period under consideration two indices, Translog and Kendrick,
indicate a slight increase in total productivity of 0.26% and 0.47%. The Solow index
shows a decrease of –0.28% p.a. As explained above this growth is driven by a very
positive development in the mid 1980s to the beginning of the 1990s which offsets the
losses in the remaining years. To see why these three distinctive time periods can be
extracted and which factors underlie the specific development, Section 3.3 will in more
detail discuss the results in the context of overall economic and policy changes at specific
points of time.

Table 3.3: Total Productivity Growth
(selected time periods, per cent p.a.)
Growth               Translog          Solow                  Kendrick
1973-93                 0.77            0.28                    0.90
1973-83                -1.66           -2.50                   -1.47
1983-91                 4.71            4.80                    5.04
1991-93                -2.84           -3.32                   -3.28
Time Trend
1973-93                 0.26           -0.28                     0.47
Note: Translog: Exponential Growth; Solow, Kendrick: Compound Growth.
Trend Rate calculated as semi-logarithmic time trend, significant on 5% level.


                                                                                         21
Figure 3.7: Index of Total Productivity
based on 1973-74 constant values
         Index
       1.4


       1.3


       1.2


       1.1


        1


       0.9                                                                                              Translog
                                                                                                        Solow
                                                                                                        Kendrick

       0.8


       0.7                                                                                                              Year
             1973 1974 1975 1976 1977 1978 1979 1980 1981 1982 1983 1984 1985 1986 1987 1988 1989 1990 1991 1992 1993


Decomposition of Growth in Value of Output

A very insightful way of looking at growth in output is to decompose growth into the
contribution of factor input changes and total productivity growth. Generally, growth in
production is two-folded consisting of increased use of inputs and some additional change
(gain or loss) in productivity. As mentioned growth in productivity thereby includes
technological change, learning, education, organization and management improvements
etc. The two-folded base of growth in output can naturally imply that growth in output is
accompanied by increase in factor input and decrease in productivity, by decrease in factor
input and increase in productivity or by increase in both factor input and productivity.
Table 3.4 presents the decomposition results for our study period and the subperiods
identified above.

Table 3.4: Decomposition of Growth in Value of Output
                 Growth (%) in
Year              Value of         Labor         Capital        Material        Energy          Total              Total
                  Output           Input          Input          Input           Input          Input           Productivity
1973-93             8.69            0.23           2.89           2.57            2.22           7.92              0.77
1973-83             6.35            0.30           3.05           3.04            1.61           8.01              -1.66
1983-91            13.68            0.15           2.82           2.54            3.46           8.97              4.71
1991-93             0.43            0.22           2.34           0.37            0.33           3.27              -2.84

Table 3.4 shows that overall output in the cement sector measured as average exponential
growth of gross output followed a quite positive trend growing at 8.69% over the period
1973-93. However, the decomposition reveals that this positive development is mainly due


                                                                                                                               22
to increased use of factor inputs (7.92% growth in factor inputs). Productivity growth
over the same time period only contributes 0.77%. The same is true for the subperiod of
progress, 1983-91. Increases in output contribute 8.97% to the increase in output of
13.68% during that period. Productivity gain reaches its highest share accounting for more
than a third, 4.71%, of output growth.

The periods 1973-83 and 1991-93 show less positive development. Productivity decreases
at –1.66% (-2.84% respectively) during these periods implying that output growth is
solely driven by the increased use of factor inputs. Total inputs contribute 8.01% in the
earlier period, about the same amount they contribute in the period of progress.
Productivity growth, however, is negative so that overall output in the early period is
lower. The last period (1991-93) gives small increases in the use of factor inputs as well as
a significant decline in productivity resulting in almost stagnating output (0.43%).

3.2 Econometric Analysis

The accounting framework employed for the derivation of total and total factor
productivities does not explain why factor demand changes over time. However,
understanding substitution processes between input factors and the effects of factor price
changes on input use is crucially important for determining the rate and direction of
technological change and thus productivity growth. Few researchers so far have tried to
tackle this issue in econometrically estimating production or dual cost functions and
concluding patterns and relationships between input factors.

3.2.1 Previous Studies

Arya (1983) studied technological and productivity changes for 15 cement manufacturing
companies. Using data from annual reports of the companies for the years 1956-72 he
estimates Cobb-Douglas production functions. The trend rates of growth show wide
variation across his sample and fall in the range of 0.8% to 6.8% p.a. Capital intensity
during that time period increases at an average rate of 2.8% p.a. for the sample group.

Mehta (1980) also estimates Cobb Douglas production functions for some energy-
intensive industries including the cement industry. His sample period encompasses the
years 1953 to 1965. He finds evidence of capital deepening in the production process but
could not conclude any clear trend regarding efficiency improvements. Productivity in the
cement sector for his time period grows at 6.1%.

3.2.2 Own Estimates

Our results for the econometric estimation of productivity change and patterns of input
substitution are received from both the statistical analysis and from estimating a translog
cost function approach with four input factors: capital, labor, energy and material. For a
detailed presentation of the economic framework, the specifications and the estimates see


                                                                                          23
Roy et al. (1999). The following tables extract from their results and present the most
important and most interesting findings to our analysis.

Our analysis focuses on the causes and effects of changes of factor inputs with particular
emphasis on energy use. Accordingly, energy prices and energy price changes over time
play a dominant role. Therefore, Table 3.5 presents the elasticities of the cost shares2 for
each input with respect to changes only in energy prices. The technical bias parameter is
reported for all factor inputs and is crucially important for understanding direction and rate
of technological change. It indicates which of the factors have been substantially made use
of in the process of technological change.

Table 3.5: Estimated Parameters for the Translog Cost Function Approach
Parameter       bme         ble       bke        bee       bmt        blt          bkt     bet       btt
                -0.181      0.018     0.123      0.040     -0.004     -0.004       0.003   0.005     -0.002
t-value         (-3.672) (1.353) (3.785) (1.393) (-2.930) (-9.732) (2.521)                 (7.265)   (-0.552)
bij= elasticity of share of i input with respect to the change in the price of jth input
bit= technical bias parameter

Regarding the cost share elasticities the table shows that the cost shares of capital, labor
and energy increase with rising energy prices while the cost shares of material decreases
with rising energy prices. However, the increase in labor and energy are insignificant. The
parameter btt a slight but insignificant acceleration of technical change over time.
Economically, a constant technical change parameter would mean a downward or upward
shift of the production function to be constant over time, or in other words a constant
autonomous increase/decrease in production independent of inputs. As shown in the
previous section productivity in the cement sector has been increasing in the past. Thus, a
technical change parameter btt equal to zero would indicate that this advance has been
quite stable over time. This hypothesis, however, can not be sustained from the analyses of
the previous chapter. Changes in productivity usually affect all input factors differently.
The technological change bias parameters, bit, indicate a significant energy and capital
using bias. At the same time technological change is significantly material and labor saving
(Table 3.6).

Table 3.6: Technical Change Bias
                          Material          Labor              Energy            Capital
Technical Change          saving            saving             using             using

For the analysis of patterns of substitution and effects of price changes on the immediate
use of input factors the own and cross price elasticities are of particular interest. Price
elasticities show the extent to which the input of one factor changes in response to a price
change of one other or the same input factor. Own price elasticities have to be negative by
theory. A price increase for a normal good leads to reduced demand for this particular
good. A positive cross price elasticity indicates a substitutional relationship between the

2
 Cost shares are defined as factor input costs over total input costs (sum of capital, labor, energy and
material costs).


                                                                                                           24
Brijesh
Brijesh
Brijesh
Brijesh
Brijesh
Brijesh
Brijesh
Brijesh
Brijesh
Brijesh
Brijesh
Brijesh
Brijesh
Brijesh
Brijesh
Brijesh
Brijesh
Brijesh
Brijesh
Brijesh
Brijesh
Brijesh
Brijesh
Brijesh
Brijesh
Brijesh

Más contenido relacionado

Destacado

Industrial energy consumption in pakistan
Industrial energy consumption in pakistanIndustrial energy consumption in pakistan
Industrial energy consumption in pakistaneeaadil
 
A project report on working capital management with special reference to bag...
A project report on working capital management with special reference to  bag...A project report on working capital management with special reference to  bag...
A project report on working capital management with special reference to bag...Babasab Patil
 
Jaypee Supply Chain Management
Jaypee Supply Chain ManagementJaypee Supply Chain Management
Jaypee Supply Chain ManagementRishabh Dogra
 
Document- "Portland Cement Association- US Cement Industry Climate Change Pro...
Document- "Portland Cement Association- US Cement Industry Climate Change Pro...Document- "Portland Cement Association- US Cement Industry Climate Change Pro...
Document- "Portland Cement Association- US Cement Industry Climate Change Pro...Obama White House
 

Destacado (6)

ferrock cement
ferrock cementferrock cement
ferrock cement
 
Industrial energy consumption in pakistan
Industrial energy consumption in pakistanIndustrial energy consumption in pakistan
Industrial energy consumption in pakistan
 
A project report on working capital management with special reference to bag...
A project report on working capital management with special reference to  bag...A project report on working capital management with special reference to  bag...
A project report on working capital management with special reference to bag...
 
Jaypee Supply Chain Management
Jaypee Supply Chain ManagementJaypee Supply Chain Management
Jaypee Supply Chain Management
 
Cement supply chain
Cement supply chainCement supply chain
Cement supply chain
 
Document- "Portland Cement Association- US Cement Industry Climate Change Pro...
Document- "Portland Cement Association- US Cement Industry Climate Change Pro...Document- "Portland Cement Association- US Cement Industry Climate Change Pro...
Document- "Portland Cement Association- US Cement Industry Climate Change Pro...
 

Similar a Brijesh

Mapping Energy, Environment and Social Issues among MSME Clusters - FMC
Mapping Energy, Environment and Social Issues among MSME Clusters - FMCMapping Energy, Environment and Social Issues among MSME Clusters - FMC
Mapping Energy, Environment and Social Issues among MSME Clusters - FMCTheBambooLink
 
IRJET- Study on Impact of Soil Stabilization using Lime, Brick Powder and Tam...
IRJET- Study on Impact of Soil Stabilization using Lime, Brick Powder and Tam...IRJET- Study on Impact of Soil Stabilization using Lime, Brick Powder and Tam...
IRJET- Study on Impact of Soil Stabilization using Lime, Brick Powder and Tam...IRJET Journal
 
IRJET- Sustainability of Recycled Aggregate – A Futuristic Prospect
IRJET- Sustainability of Recycled Aggregate – A Futuristic ProspectIRJET- Sustainability of Recycled Aggregate – A Futuristic Prospect
IRJET- Sustainability of Recycled Aggregate – A Futuristic ProspectIRJET Journal
 
Usage of Waste Materials in Concrete
Usage of Waste Materials in ConcreteUsage of Waste Materials in Concrete
Usage of Waste Materials in ConcreteIRJET Journal
 
IRJET- Consolidation Behaviour of Rice Husk Ash and Lime Stabilised Dredged Soil
IRJET- Consolidation Behaviour of Rice Husk Ash and Lime Stabilised Dredged SoilIRJET- Consolidation Behaviour of Rice Husk Ash and Lime Stabilised Dredged Soil
IRJET- Consolidation Behaviour of Rice Husk Ash and Lime Stabilised Dredged SoilIRJET Journal
 
HIGH PERFORMANCE CONCRETE USING RICE HUSK ASH
HIGH PERFORMANCE CONCRETE USING RICE HUSK ASHHIGH PERFORMANCE CONCRETE USING RICE HUSK ASH
HIGH PERFORMANCE CONCRETE USING RICE HUSK ASHIRJET Journal
 
2012 deep research report on china distributed energy resources industry
2012 deep research report on china distributed energy resources industry2012 deep research report on china distributed energy resources industry
2012 deep research report on china distributed energy resources industrysmarter2011
 
Energy statistics 2012_28mar
Energy statistics 2012_28marEnergy statistics 2012_28mar
Energy statistics 2012_28marjuleejaiswal89
 
IRJET - Effect of Sodium Bentonite on Index and Engineering Properties of...
IRJET -  	  Effect of Sodium Bentonite on Index and Engineering Properties of...IRJET -  	  Effect of Sodium Bentonite on Index and Engineering Properties of...
IRJET - Effect of Sodium Bentonite on Index and Engineering Properties of...IRJET Journal
 
Advancing cogeneration
Advancing cogenerationAdvancing cogeneration
Advancing cogenerationsugarmills
 
IRJET-Experimental Investigation of Concrete using Titanium Dioxide
IRJET-Experimental Investigation of Concrete using Titanium DioxideIRJET-Experimental Investigation of Concrete using Titanium Dioxide
IRJET-Experimental Investigation of Concrete using Titanium DioxideIRJET Journal
 
IRJET-Soil Stabilization using Microbially Induced Calcite Precipitation
IRJET-Soil Stabilization using Microbially Induced Calcite PrecipitationIRJET-Soil Stabilization using Microbially Induced Calcite Precipitation
IRJET-Soil Stabilization using Microbially Induced Calcite PrecipitationIRJET Journal
 
Effect of Partial Replacement of Cement by Fly Ash and Metakaolin on Concrete...
Effect of Partial Replacement of Cement by Fly Ash and Metakaolin on Concrete...Effect of Partial Replacement of Cement by Fly Ash and Metakaolin on Concrete...
Effect of Partial Replacement of Cement by Fly Ash and Metakaolin on Concrete...IRJET Journal
 
Readiness of Indian Export Sector and Strategy to deal with Climate Change Po...
Readiness of Indian Export Sector and Strategy to deal with Climate Change Po...Readiness of Indian Export Sector and Strategy to deal with Climate Change Po...
Readiness of Indian Export Sector and Strategy to deal with Climate Change Po...mehtavd
 
IRJET- Comparative Experimental Study Between RCC, Bituminous Mix and Mod...
IRJET-  	  Comparative Experimental Study Between RCC, Bituminous Mix and Mod...IRJET-  	  Comparative Experimental Study Between RCC, Bituminous Mix and Mod...
IRJET- Comparative Experimental Study Between RCC, Bituminous Mix and Mod...IRJET Journal
 
IRJET - Treatment and Reuse of Periyar Sedimented Soil using Nano Chemicals
IRJET - Treatment and Reuse of Periyar Sedimented Soil using Nano ChemicalsIRJET - Treatment and Reuse of Periyar Sedimented Soil using Nano Chemicals
IRJET - Treatment and Reuse of Periyar Sedimented Soil using Nano ChemicalsIRJET Journal
 

Similar a Brijesh (20)

Fertilizer1
Fertilizer1Fertilizer1
Fertilizer1
 
Mapping Energy, Environment and Social Issues among MSME Clusters - FMC
Mapping Energy, Environment and Social Issues among MSME Clusters - FMCMapping Energy, Environment and Social Issues among MSME Clusters - FMC
Mapping Energy, Environment and Social Issues among MSME Clusters - FMC
 
IRJET- Study on Impact of Soil Stabilization using Lime, Brick Powder and Tam...
IRJET- Study on Impact of Soil Stabilization using Lime, Brick Powder and Tam...IRJET- Study on Impact of Soil Stabilization using Lime, Brick Powder and Tam...
IRJET- Study on Impact of Soil Stabilization using Lime, Brick Powder and Tam...
 
IRJET- Sustainability of Recycled Aggregate – A Futuristic Prospect
IRJET- Sustainability of Recycled Aggregate – A Futuristic ProspectIRJET- Sustainability of Recycled Aggregate – A Futuristic Prospect
IRJET- Sustainability of Recycled Aggregate – A Futuristic Prospect
 
Usage of Waste Materials in Concrete
Usage of Waste Materials in ConcreteUsage of Waste Materials in Concrete
Usage of Waste Materials in Concrete
 
IRJET- Consolidation Behaviour of Rice Husk Ash and Lime Stabilised Dredged Soil
IRJET- Consolidation Behaviour of Rice Husk Ash and Lime Stabilised Dredged SoilIRJET- Consolidation Behaviour of Rice Husk Ash and Lime Stabilised Dredged Soil
IRJET- Consolidation Behaviour of Rice Husk Ash and Lime Stabilised Dredged Soil
 
HIGH PERFORMANCE CONCRETE USING RICE HUSK ASH
HIGH PERFORMANCE CONCRETE USING RICE HUSK ASHHIGH PERFORMANCE CONCRETE USING RICE HUSK ASH
HIGH PERFORMANCE CONCRETE USING RICE HUSK ASH
 
2012 deep research report on china distributed energy resources industry
2012 deep research report on china distributed energy resources industry2012 deep research report on china distributed energy resources industry
2012 deep research report on china distributed energy resources industry
 
2012 deep research report on china distributed energy resources industry
2012 deep research report on china distributed energy resources industry2012 deep research report on china distributed energy resources industry
2012 deep research report on china distributed energy resources industry
 
2012 deep research report on china distributed energy resources industry
2012 deep research report on china distributed energy resources industry2012 deep research report on china distributed energy resources industry
2012 deep research report on china distributed energy resources industry
 
2012 deep research report on china distributed energy resources industry
2012 deep research report on china distributed energy resources industry2012 deep research report on china distributed energy resources industry
2012 deep research report on china distributed energy resources industry
 
Energy statistics 2012_28mar
Energy statistics 2012_28marEnergy statistics 2012_28mar
Energy statistics 2012_28mar
 
IRJET - Effect of Sodium Bentonite on Index and Engineering Properties of...
IRJET -  	  Effect of Sodium Bentonite on Index and Engineering Properties of...IRJET -  	  Effect of Sodium Bentonite on Index and Engineering Properties of...
IRJET - Effect of Sodium Bentonite on Index and Engineering Properties of...
 
Advancing cogeneration
Advancing cogenerationAdvancing cogeneration
Advancing cogeneration
 
IRJET-Experimental Investigation of Concrete using Titanium Dioxide
IRJET-Experimental Investigation of Concrete using Titanium DioxideIRJET-Experimental Investigation of Concrete using Titanium Dioxide
IRJET-Experimental Investigation of Concrete using Titanium Dioxide
 
IRJET-Soil Stabilization using Microbially Induced Calcite Precipitation
IRJET-Soil Stabilization using Microbially Induced Calcite PrecipitationIRJET-Soil Stabilization using Microbially Induced Calcite Precipitation
IRJET-Soil Stabilization using Microbially Induced Calcite Precipitation
 
Effect of Partial Replacement of Cement by Fly Ash and Metakaolin on Concrete...
Effect of Partial Replacement of Cement by Fly Ash and Metakaolin on Concrete...Effect of Partial Replacement of Cement by Fly Ash and Metakaolin on Concrete...
Effect of Partial Replacement of Cement by Fly Ash and Metakaolin on Concrete...
 
Readiness of Indian Export Sector and Strategy to deal with Climate Change Po...
Readiness of Indian Export Sector and Strategy to deal with Climate Change Po...Readiness of Indian Export Sector and Strategy to deal with Climate Change Po...
Readiness of Indian Export Sector and Strategy to deal with Climate Change Po...
 
IRJET- Comparative Experimental Study Between RCC, Bituminous Mix and Mod...
IRJET-  	  Comparative Experimental Study Between RCC, Bituminous Mix and Mod...IRJET-  	  Comparative Experimental Study Between RCC, Bituminous Mix and Mod...
IRJET- Comparative Experimental Study Between RCC, Bituminous Mix and Mod...
 
IRJET - Treatment and Reuse of Periyar Sedimented Soil using Nano Chemicals
IRJET - Treatment and Reuse of Periyar Sedimented Soil using Nano ChemicalsIRJET - Treatment and Reuse of Periyar Sedimented Soil using Nano Chemicals
IRJET - Treatment and Reuse of Periyar Sedimented Soil using Nano Chemicals
 

Brijesh

  • 1. LBNL-41842 ERNEST ORLANDO LAWRENCE BERKELEY NATIONAL LABORATORY India’s Cement Industry: Productivity, Energy Efficiency and Carbon Emissions Katja Schumacher and Jayant Sathaye Environmental Energy Technologies Division July 1999 This work was supported by the Environmental Science Division, Office of Biological and Environmental Research (OBER), Office of Energy Research, U.S. Department of Energy, under Contract No. DE-AC03-76SF00098.
  • 2. Disclaimer This document was prepared as an account of work sponsored by the United States Government. While this document is believed to contain correct information, neither the United States Government nor any agency thereof, nor The Regents of the University of California, nor any of their employees, makes any warranty, express or implied, or assumes any legal responsibility for the accuracy, completeness, or usefulness of any information, apparatus, product, or process disclosed, or represents that its use would not infringe privately owned rights. Reference herein to any specific commercial product, process, or service by its trade name, trademark, manufacturer, or otherwise, does not necessarily constitute or imply its endorsement, recommendation, or favoring by the United States Government or any agency thereof, or The Regents of the University of California. The views and opinions of authors expressed herein do not necessarily state or reflect those of the United States Government or any agency thereof, or The Regents of the University of California. Ernest Orlando Lawrence Berkeley National Laboratory is an equal opportunity employer.
  • 3. LBNL-41842 India’s Cement Industry: Productivity, Energy Efficiency and Carbon Emissions Katja Schumacher* and Jayant Sathaye Energy Analysis Program Environmental Energy Technologies Division Lawrence Berkeley National Laboratory Berkeley, CA 94720 * Fax: (510) 486-6996, Email: KBSchumacher@lbl.gov July 1999
  • 4. ACKNOWLEDGEMENTS The authors would like to thank Joyashree Roy, Ernst Worrell, Puran Mongia, Alan Sanstad, and Dian Phylipsen for their valuable assistance and comments on previous drafts of this paper. This work was supported by the Environmental Science Division, Office of Biological and Environmental Research (OBER), Office of Energy Research, U.S. Department of Energy, under Contract No. DE-AC03-76SF00098. ii
  • 5. Abstract Historical estimates of productivity growth in India’s cement sector vary from indicating an improvement to a decline in the sector’s productivity. The variance may be traced to the time period of study, source of data for analysis, and type of indices and econometric specifications used for reporting productivity growth. We derive both growth accounting and econometric estimates of productivity growth for this sector. Our results show that over the observed period from 1973-74 to 1993-94 productivity increased by 0.8% as indicated by the Translog index. Calculations of the Kendrick and Solow index support this finding. The increase was mainly driven by a period of progress between 1983 and 1991 following partial decontrol of the cement sector in 1982. Before 1983, productivity declined probably due to government protection regarding prices and distribution, inefficiencies in plant operation and constraints in essential input factors. Between 1991 and 1993, the sector suffered a downfall in accordance with overall economic recession. Using a translog specification the econometric analysis reveals that technical progress in India’s cement sector has been biased towards the use of energy and capital, while it has been material and labor saving. We examine the current changes in structure and energy efficiency undergoing in the sector. Our analysis shows that the Indian cement sector is moving towards world-best technology, which will result in fewer carbon emissions and more efficient energy use. However, substantial further energy savings and carbon reduction potentials still exist. iii
  • 6. Table of Contents List of Tables vi List of Figures vii 1. Introduction 1 2. Cement Industry 2 2.1. The Cement Industry in Context 2 2.2. Cement Process 3 2.2.1. Raw Material Preparation 4 2.2.2. Clinker Production 4 2.2.3. Finish Grinding 4 2.3. Cement Production in India 5 2.3.1. Raw Materials 8 2.3.2. Energy Use 8 2.4. Policy 9 3. Statistical and Econometric Analysis 12 3.1. Statistical Analysis 12 3.1.1. Previous Studies 13 3.1.1.1. Partial Productivity 13 3.1.1.2. Total Factor Productivity Growth 17 3.1.2. Own Estimates 17 3.1.2.1. Partial Productivity 17 3.1.2.2. Total Factor Productivity 19 3.1.2.3. Total Productivity 21 3.2. Econometric Analysis 23 3.2.1. Previous Studies 23 3.2.2. Own Estimates 23 3.3. Discussion 25 iv
  • 7. 4. Future Development of the Cement Sector 28 4.1. Ongoing Changes in the Cement Industry 28 4.2. Potentials for Energy Efficiency Improvements 30 4.2.1. India versus Best Practice 30 4.2.2. Categories for Energy Efficiency Improvement 33 4.2.3. Barriers to Energy Efficiency Improvement 33 4.3. Scenarios of Future Energy Efficiency 34 4.4. Effects on Carbon Dioxide Emissions 38 5. Summary and Conclusions 40 References 40 Appendix 44 v
  • 8. List of Tables Table 2.1 Economic Indicators for the Cement Industry Table 2.2 Regionwise Cement Production, Capacity, and Capacity Utilization Table 2.3 Technology Mix for Cement Production in India Table 2.4 Energy Consumption in Indian Cement Industry (1991-93) Table 2.5 Fuel Consumption in Cement Industry 1991-1993 Table 2.6 Overview of Policies Regarding the Cement Industry (1973-93) Table 3.1 Partial Productivity Growth Table 3.2 Total Factor Productivity Growth Table 3.3 Total Productivity Growth Table 3.4 Decomposition of Growth in Value of Output Table 3.5 Estimated Parameters for the Translog Cost Function Approach Table 3.6 Technical Change Bias Table 3.7 Price Elasticities and Allen Partial Elasticities of Substitution Table 3.8 Elasticities of Substitution – Qualitative Overview Table 4.1 Expansion of Cement Manufacturing Capacities Table 4.2 Projected Cement Production Table 4.3 Specific Energy Consumption: India vs. Best Practice Table 4.4 Energy Savings Potentials in India’s Cement Industry (1993) Table 4.5 Scenarios for Energy Consumption in 2001, 2006 and 2011 Table 4.6 Carbon Dioxide Emissions: India vs. Best Practice Table 4.7 Total Carbon Dioxide Emissions vi
  • 9. List of Figures Figure 2.1 Changes in Physical Energy Intensity of Various Industries Figure 2.2 Production and Installed Capacity – Small and Large Cement Plants Figure 3.1 Estimates of Partial Productivity Growth: Capital Figure 3.2 Estimates of Partial Productivity Growth: Labor Figure 3.3 Estimates of Capital-Labor Ratio Figure 3.4 Estimates of Total Factor Productivity Growth Figure 3.5 Index of Partial Productivity Figure 3.6 Index of Total Factor Productivity Figure 3.7 Index of Total Productivity Figure 4.1 Frozen Efficiency vs. Best Practice in Indian Cement Industry vii
  • 10. 1. Introduction The cement industry presents one of the most energy-intensive sectors within the Indian economy and is therefore of particular interest in the context of both local and global environmental discussions. Increases in productivity through the adoption of more efficient and cleaner technologies in the manufacturing sector will be effective in merging economic, environmental, and social development objectives. A historical examination of productivity growth in India’s industries embedded into a broader analysis of structural composition and policy changes will help identify potential future development strategies that lead towards a more sustainable development path. Issues of productivity growth and patterns of substitution in the cement sector as well as in other energy-intensive industries in India have been discussed from various perspectives. Historical estimates vary from indicating an improvement to a decline in the sector’s productivity. The variation depends mainly on the time period considered, the source of data, the type of indices and econometric specifications used for reporting productivity growth. Regarding patterns of substitution most analyses focus on interfuel substitution possibilities in the context of rising energy demand. Not much research has been conducted on patterns of substitution among the primary and secondary input factors: Capital, labor, energy and materials. However, analyzing the use and substitution possibilities of these factors as well as identifying the main drivers of productivity growth among these and other factors is of special importance for understanding technological and overall development of an industry. In this paper, we contribute to the discussion on productivity growth and the role of technological change within the context of global environmental change. We introduce the cement industry in more detail taking into account industry specific aspects such as structural composition, production, technologies, energy consumption within processes, environmental impacts, sector specific policies etc. Subsequently, we derive both statistical and econometric estimates of productivity growth for the cement sector over time. For the statistical analysis we calculated partial and total productivity in a growth accounting framework while for the econometric analysis a translog cost function approach is employed to estimate productivity growth, technical change biases and substitution elasticities. The results are then interpreted within a broader context of structural and policy changes in the sector as well as other sector specific aspects. Future energy use and carbon emissions depend mainly on the level of production and the technologies employed. Furthermore, different economic and policy settings affect structures and efficiencies within the sector. The final section therefore examines the ongoing changes in the cement industry structure. It compares world best technologies to Indian technologies and identify potentials and barriers to the achievement of efficiency improvements. A scenario analysis concludes the report in highlighting the energy efficiency and productivity improvements that could be achieved by employing more efficient technologies. 1
  • 11. 2. Cement Industry 2.1 The Cement Industry in Context In the course of this study, six industries in India have been identified as energy-intensive industries: Aluminum, cement, fertilizer, iron and steel, glass, and paper. Together they account for 16.8% of manufacturing value of output (VO) and for 38.8% of all fuels consumed in the manufacturing sector (Table 2.1). The cement sector holds a considerable share within these energy-intensive industries. In 1993, it accounted for 11.7% of the value of output within the six industries and for 2.0% of that in the manufacturing sector. Table 2.1: Economic Indicators for the Cement Industry Unit Cement Aggregate of Six Aggregate Energy-intensive Manufacturing Industries Growth in Value of Output1 Nominal 1973-1993 % p.a. 16.7 16.4 15.1 1973-1983 % p.a. 18.8 18.1 15.3 1983-1991 % p.a. 17.5 15.4 14.6 1991-1993 % p.a. 3.2 12.2 16.2 Real 1973-1993 % p.a. 8.7 7.9 7.4 1973-1983 % p.a. 6.3 8.6 7.7 1983-1991 % p.a. 13.7 8.9 6.9 1991-1993 % p.a. 0.4 0.4 7.3 In 1993-94: VO Share in Aggr. Sector VO/ 2.0% 16.8% 100% Manufacturing (nominal) Manuf. VO Nom. Sector Fuel Share in Sector Fuel/ 10.3% 38.8% 100% Aggr. Manuf. (nominal) Manuf. Fuel Fuel Cost Share in Sector Fuel/ 35.5% 15.8% 6.8% Value of Output (nominal) Sector VO Source: Government of India, ASI: Summary Results for the Factory Sector (various years). 1 calculated as exponential annual growth. Production in the cement sector has been increasing over the last 20 years. Over the study period 1973-1993, real VO increased by an average of 8.7% p.a. Following the fertilizer industry the cement sector shows second highest growth in the group of energy-intensive industries. Major cement-specific policy changes took place in 1982 and 1989. As seen in Table 2.1 growth of real value of output was around 6.3% during the period of total control (1973-1983). It increased significantly to 13.7% in the following period of partial and eventually total decontrol (1983-91), accounting for higher than average growth in both the group of six energy-intensive industries and total manufacturing. After 1991, the real value of output growth was substantially lower at 0.4% until 1993. 2
  • 12. Figure 2.1: Changes in Physical Energy Intensity of Various Industries (Real Fuel Cost/Real Value of Output - 1973-74 values) 0.35 0.30 0.25 0.20 0.15 0.10 0.05 0.00 Years 7 4 7 5 7 6 7 7 7 8 7 9 8 0 8 1 8 2 8 3 8 4 8 5 8 6 8 7 8 8 8 9 9 0 9 1 9 2 9 3 9 4 7 3- 7 4- 7 5- 7 6- 7 7- 7 8- 7 9- 8 0- 8 1- 8 2- 8 3- 8 4- 8 5- 8 6- 8 7- 8 8- 8 9- 9 0- 9 1- 9 2- 9 3- 19 19 19 19 19 19 19 19 19 19 19 19 19 19 19 19 19 19 19 19 19 Paper Fertilizer Glass Cement Iron & Steel Aluminum Total Manufacturing The cement sector accounts for 10.3% of total fuel costs in the manufacturing sector. The fuel cost share, fuel costs per unit of output (VO), in the cement sector is more than two times higher than the average fuel cost share of the six energy-intensive industries and amounts to more than five times the average of total manufacturing. Within the group of energy-intensive industries the sector, therefore, holds the lead in energy intensity measured as the nominal value of fuels consumed compared to the nominal value of output. Figure 2.1 displays the energy intensity of the cement sector in real values. The ‘real-value’ indicator reflects the changes in physical energy intensity over time and gives a comparison to other sectors. Except for aluminum, cement production has been most energy intensive not only in 1993 but almost over the whole time period. Despite its fluctuating pattern it shows a relatively stable trend over time. 2.2. Cement Process Cement acts as a bonding agent, holding particles of aggregate together to form concrete. Cement production is highly energy intensive and involves the chemical combination of calcium carbonate (limestone), silica, alumina, iron ore, and small amounts of other materials. Cement is produced by burning limestone to make clinker, and the clinker is blended with additives and then finely ground to produce different cement types. Desired physical and chemical properties of cement can be obtained by changing the percentages of the basic chemical components (CaO, Al2O3, Fe2O3, MgO, SO3, etc.). 3
  • 13. Most cement produced is portland cement: other cement types include white, masonry, slag, aluminous, and regulated-set cement. Cement production involves quarrying and preparing the raw materials, producing clinker through pyroprocessing the materials in huge rotary kilns at high temperatures, and grinding the resulting product into fine powder. The following detailed description is borrowed from the World Energy Council (1995). 2.2.1 Raw Materials Preparation Raw materials preparation involves primary and secondary crushing of the quarried material, drying the material (for use in the dry process) or undertaking a further raw grinding through either wet or dry processes, and blending the materials. The energy consumption in raw materials preparation accounts for a small fraction of overall primary energy consumption (less than 5%) although it represents a large part of the electricity consumption. 2.2.2. Clinker Production Clinker production is the most energy-intensive step, accounting for about 80% of the energy used in cement production in the United States. Produced by burning a mixture of materials, mainly limestone (CaCO3), silicon oxides (SiO2), aluminum, and iron oxides, clinker is made by one of two production processes: wet or dry; these terms refer to the grinding processes although other configurations and mixed forms (semi-wet, semi-dry) exist for both types. In the wet process, the crushed and proportioned materials are ground with water, mixed, and fed into the kiln in the form of a slurry. In the dry process, the raw materials are ground, mixed, and fed into the kiln in their dry state. The choice among different processes is dictated by the characteristics and availability of raw materials. For example, a wet process may be necessary for raw materials with high moisture content (greater than 15%) or for certain chalks and alloys that can best be processed as a slurry. However, the dry process is the more modern and energy-efficient configuration. Once the materials are ground, they are fed into a kiln for burning. In modern kilns, the raw material is preheated (in four to five stages) using the waste heat of the kiln, or it is pre-calcined. During the burning or pyroprocessing, the water is first evaporated after which the chemical composition is changed, and a partial melt is produced. The solid material and the partial melt combine into small marble-sized pellets called clinker. 2.2.3 Finish Grinding Cooled clinker is ground in tube or roller mills and blended by simultaneous grinding and mixing with additives (e.g., gypsum, anhydrite, pozzolana, fly-ash or blast furnace slags) to produce the cement. Drying of the additives may be needed at this stage. 4
  • 14. 2.3 Cement Production in India Following China, Japan and the US, India is the fourth largest cement-producing country in the world. In 1996, around 115 large cement plants within 57 cement companies and about 300 small plants produced 76.2 million tonnes1 (Mt) cement per year. Ownership is mostly private (85% of installed capacity) and centralized for the large plants with four production houses controlling most units. This has led to financial and administrative integration of different factories. (Datt and Sundharam, 1998) Installed capacity increased considerably between 1970 and 1996, particularly in the last few years following complete deregulation of the cement sector. While in the two decade period from 1970 to 1990 total installed capacity rose by around 47 million tonnes from 17 million tonnes to 64 million tonnes, within only 6 years between 1990 and 1996 it increased by another 41 million tonnes to 105 million tonnes of installed capacity. Figure 2.2: Production and Installed Capacity - Small and Large Cement Plants Mt 110 100 90 Capacity: Large Plants Capacity: Small Plants Production: Large Plants Production: Small Plants 80 70 60 50 40 30 20 10 0 Year 1980 1981 1982 1983 1984 1985 1986 1987 1988 1989 1990 1991 1992 1993 1994 1995 1996 Source: Karwa (1998). Production, however, did not increase accordingly. Due to a high frequency of power failures, shortage of coal, inadequate availability of wagons for rail transportation, limited availability of furnace oil etc. capacity utilization decreased steadily from as high as 90% in 1978 to a low point of 67% in 1980-81. Following policy changes towards deregulation in the early and late 1980s capacity utilization reimproved to 82% in 1991-92. Yet, since then it has again shown a decreasing trend to 72% in 1996-97. (Datt and Sundharam, 1998; Karwa, 1998) Figure 2.2 shows installed capacity and production for large as well 1 metric tonnes, sometimes abbreviated as t, or million tonnes as Mt in the following. 5
  • 15. as small plants. Appendix A gives production, capacity and capacity utilization from 1970- 96 for India as a whole and Table 2.2 by region for 1995-96. Table 2.2 shows that, in 1995-96, cement production in India is regionally quite dispersed with major clusters in the west and the south. Installed capacity as well as production is highest in the west. However, as capacity utilization at 90.9% is substantially better in the south, cement output in the south is only slightly lower than in the west. This pattern - high levels of installed capacity at relatively low utilization level in the west resulting in roughly the same output as in the south where capacity utilization is higher at lower levels of installed capacity - can be observed for previous years 1991-1995 as well. It is noteworthy that, in contrast to the national development, capacity utilization in the south improved continuously between 1991 and 1995. Table 2.2: Regionwise Cement Production, Capacity, and Capacity Utilization (million tonnes) Year: 1995-96 Region Capacity Production Capacity Utilization (%) North 18.3 12.1 66 East 7.3 4.6 63 West 38.6 25.9 67 South 23.9 21.7 91 All India 88.2 64.4 73 Source: Karwa (1998). The viability of the location plays a major role in the economics of cement manufacturing. It is determined by factors such as proximity to raw materials (limestone, coal), distance to market areas as well as availability of continuous power supply. Proximity to limestone deposits contributes considerably to pushing down costs in transportation of heavy limestone. If units are located close enough to limestone resources, trucks can be used to move limestone over the short distance instead of relying on scarce railway capacity. The proximity of coal deposits constitutes another important factor in cement manufacturing. Generally, coal is transported by railway throughout the country. Coal distribution and coal prices are strictly controlled by the government. Although coal deposits are located all over the country constraints in availability of wagons for railway transportation have led to major shortfalls in the amount of coal received against the quota assigned to the cement industry. For the year 1973, Chakravarty (1989) computed losses in cement production due to coal shortages of up to 37%. However, they were considerably lower at 10% in 1981 and have since steadily decreased. In 1987, coal shortage accounted for only 0.4% of production losses. In order to reduce transportation as well as capital costs, to increase regional development and to make use of smaller limestone deposits many small and mini cement plants with a capacity of up to 650 tonnes per day were set up in dispersed locations in India. As seen in Figure 2.2, construction of such plants began in the early 1980s and amounted to 180 mini cement plants in 1992 together producing 3 Mt (about 6% of total cement production) 6
  • 16. and 311 plants producing 5 Mt (7.3% of total cement) in 1996. (World Energy Council, 1995; International Cement Review, 1998). Despite the advantages, there were several drawbacks associated with the setting up of units in dispersed areas, mainly due to increased distances to market areas other than the local markets. Limits in transportation capacity, particular in rail transport, constrained the delivery of cement from the production site to the consumer. Consequently, due to lack of storage capacity (silos) at the production site producers were often forced to cut back cement production. Only in recent years the government finally allowed the cement industry to purchase and own rail wagons to overcome these problems. Demand for cement has been growing at rates of up to 10% p.a. in the past. While in 1987 demand was about 37 million tonnes (Mt), it reached 53 Mt in 1993 and further increased to more than 65 Mt in 1995 (CMA, 1994 and Karwa, 1998). Providing a main input for construction, cement consumption is highly dependent on activities in the construction sector which are in turn dependent on governmental and private investment in infrastructure and buildings. Appendix B provides gross value added in the construction sector from 1977-95. During most of the past, demand could not be met by national production. Therefore, imports had to fill the balance. Since 1987, however, cement production has increased and India reached self-sufficiency. And, more recently exports, particularly to neighboring countries, have been increasing. (Mittal, 1994) At present the Indian cement industry produces 13 different varieties of cement employing three different process types. Amongst the varieties, Ordinary Portland Cement (OPC), Portland Pozzolana Cement (PPC) and Portland Slag Cement (PSC) constitute the major shares accounting for almost 99% in total production. Ordinary Portland Cement is most commonly used in India. It holds a share of about 70% in total production. PPC production accounts for about 18% of total cement production while PSC assumes a share of only 11%. (Karwa, 1998) Generally, the two varieties, PSC and OPC, can be used for same purposes, while PPC cannot be used for prestressed and high strength concrete, as used in bridges and airports (Das and Kandpal, 1997) Cement is produced using the wet, the semi-dry, and the dry processes. The shareo f the wet process in total installed capacity has declined from over 90% in 1960 to only 12% today (Table 2.3). The wet process has been substituted by the significantly less energy- using dry process over time. Following the two oil price shocks the shift in technology mix has become substantial. The dry process nowadays accounts for the majority (86%) of India’s cement production. Due to new, even more efficient technologies, the wet process is expected to be completely pushed out in the near future. The semi-dry process never played an important role in Indian cement production. Its share in total installed cement capacity has been small over time. It currently accounts for 2% of total production. Mini cement plants usually use vertical shaft kilns for cement production. 7
  • 17. Table 2.3 Technology Mix (%) for Cement Production in India Technology 1960 1970 1980 1993 1997 Dry process 1.1 21.5 32.7 82.0 86.0 Semi-dry process 4.5 9.0 5.7 2.0 2.0 Wet process 94.4 69.5 61.6 16.0 12.0 Source: TERI, 1994; Karwa (1998). 2.3.1 Raw Materials Limestone presents the major raw material input to cement production. High quality limestone is accessible almost all over the country. For the production of OPC, clay and gypsum serve as additives while the production of PPC and PSC requires additives that can be taken from industrial wastes such as fly ash and blast furnace slag respectively. Neither of these inputs currently places any constraint in terms of availability or quality on the production of cement. Fly ash can be recovered as a waste product from electricity generation while slag residues from blast furnace of steel plants. 2.3.2 Energy Use Energy consumption per tonne of cement varies from technology to technology. The dry process uses more electrical but much less thermal energy than the wet process. Overall, it requires substantially less total energy. Additionally, as shown in Table 2.4 energy consumption per tonne of clinker (cement respectively) in the dry process has been declining over the past. The increase in final energy consumption in 1993 is solely due to an increase in the clinker/cement ratio for that year. Table 2.4 Energy Consumption in Indian Cement Industry (1991-1993) Process Thermal Energy Electricity Final Energy GJ/t clinker GJ/t cement GJ/t cement* 1991 1992 1993 1991 1992 1993 1991 1992 1993 Dry Process Plants 3.58 3.47 3.41 0.43 0.41 0.40 3.45 3.30 3.40 Semi Dry Process Plants 4.02 3.95 3.95 0.44 0.42 0.41 3.82 3.71 3.88 Wet Process Plants 5.53 5.69 5.61 0.39 0.39 0.36 5.05 5.13 5.29 Source: Karwa (1998). * calculated for a clinker-cement ratio of 0.842 (1991), 0.833 (1992), 0.878 (1993). Primary energy consumption in a typical dry process Portland Cement Plant as found in industrialized countries consists of up to 75% of fossil fuel consumption and up to 25% of electricity consumption. Within the fuel category pyroprocessing requires the most energy, consuming 99% of the fuel energy while electricity is mainly used to operate both raw material (33%) and clinker (38%) crushing and grinding equipment. In addition, electricity is needed for pyroprocessing (22%) making it by far the most energy intensive step of the production process. India’s cement units are generally less energy efficient using both more thermal and electrical energy. However, the shares of energy used within the different sections of production are about the same. (Karwa, 1998) 8
  • 18. Table 2.5: Fuel Consumption in the Indian Cement Industry 1991-1993 Fuel Units 1991-92 1992-93 1993-94 Electricity* GWh 4800.52 6420.97 6754.60 Coal Mt 10.8 11.7 11.1 Petroleum Products Mt 0.293 0.296 0.291 Total Cement Production Mt 53.6 54.1 58.0 Source: TERI (1996, 1997); Government of India, ASI (1991-1993). * Electricity consumption includes purchased and captive power (excluding sales). About 94% of the thermal energy requirement in the Indian cement manufacturing is met by coal. The remaining part is met by fuel oil and high speed diesel oil (see Table 2.5). So far, no real substitute for coal exists. Increasing the oil share would imply significant outflows of foreign exchange and impose a burden on the economy. Natural gas is mainly used as feedstock in newly-built large fertilizer plants and is thus not sufficiently available for the cement industry. Actual coal consumption varies with qualitative factors. Over the years there has been a steady decline in the quality of coal. In particular, the ash content of coal has increased implying lower calorific values of coal, and improper and inefficient burning, ash ring formation in the kiln etc. Coal consumption thus had to be increased to provide the energy needed for clinker production resulting in additional costs for transportation, handling, grinding and burning of coal. In order to reduce these problems the cement industry started implementing coal washeries which reduce the ash content of coal at the mine itself. Generally, power is provided by the State Electricity Boards. Yet, problems in power supply, such as frequent power cuts, power failures and low voltage, impose immense problems on the cement industry. Interruption of power affects the industry negatively by causing production losses and low capacity utilization, idle running of equipment during stop and restart of the plant, thermal losses during reheating, damages to refractory etc. Cement companies have therefore started installing captive power to ensure continuos running of process plants and emergency equipment. In 1993, 974 GWh of electricity was produced onsite (Government of India, Annual Survey of Industry, 1993). 2.4 Policy The Indian cement sector has been under strict government control for almost the whole period since independence in 1947. Government intervention took place both directly and indirectly. Direct intervention happened in the form of government control over production capacity and distribution of cement, while indirect intervention took the form of price control. Table 2.6 provides a summary overview of major policy changes between 1951 and today. Three significant periods can be distinguished: First, the period of total control where both prices and distribution of output were strictly regulated by the government. Second, the 9
  • 19. period of partial decontrol starting in Feb. 1982 and finally the period since 1989 when all price and distribution controls were withdrawn. The price and distribution control system on cement, implemented after liberalization in 1956, aimed at ensuring fair prices to producers and consumers all over the country, thus reducing regional imbalances, and at reaching self-sufficiency within a short time horizon. Because of slow growth in capacity expansion and continued cost increases, the government had to increase the fixed price several times. However, these price increases as well as financial incentives (tax returns on capital) to enhance investment showed little to no effect on the industry. In 1977, higher prices were allowed for cement produced by new plants or major expansions of existing plants. Due to sustained slow development the uniform price imposed by the government was substituted by a three tier price system in 1979. Different prices were assigned to cement produced in low, medium and high cost plants. However, further increases of input costs (including those that were likewise regulated by the government such as fuel and power costs as well as wages) could not be neutralized adequately and in time. Thus, the controlled price did not reflect the true economic cost and profit margins dwindled increasingly deterring essential investments in capacity and production expansion. A permit system introduced by 14 states and unified territories in the 1970s comprised direct control over public distribution of cement to ensure fair supplies to priority sectors, discourage consumption of cement for non-priority and essential purposes. Furthermore, it was thought to facilitate cement availability to small users and to eliminate black marketing. However, the system resulted in artificial shortages, extensive black marketing and corruption in the civil supply departments of the government (Datt and Sundharam, 1998). The system of price control was accompanied by a policy of freight pooling. The price control fixed a uniform price according to estimated production costs at which cement was required to be sold all over the country. This price contained a freight component that was averaged over the country as a whole. If the actual freight component experienced by a particular firm was lower than the element included in the uniform price, producers had to pass on to the pool a sum representing the difference between the uniform price freight component and the freight costs incurred by them. On the other hand, if the actual freight incidence was higher than the freight element accounted for in the uniform price, producers were reimbursed the difference. The freight pooling system promoted equal industrial development all over the country. It supported regional dissemination and ensured that cement was available at equal prices in any part of the country. Yet, it also implied that producers had no incentive in locating production such that transportation costs of cement would be minimized. Market distance became a less important issue. As a result of non optimal location of industries, average costs of production as well as demand for scarce railway capacity increased. (Ahluwalia, 1985 and Chakravarty, 1989) 10
  • 20. Table 2.6: Overview of Policies Regarding the Cement Industry (1973 - 1993) Period Policy Specifics Notes 1951 – 1982 Price and Distribution Control April 1975 14% tax return on capital Did not show any noticeable employed impact on industry 1977 12% post tax return on net Showed effect on output worth Until 1978 Uniform retention price May 1979 Three tier price system (different retention prices for low, medium and high cost plants) Feb. 1982 Partial Decontrol Levy Obligation, Uniform Retention price slightly Retention Price lower for PPC than OPC, specific mini units exempted from price and distribution control 1982-1988 Progressive decrease in levy See table below and increase in retention price Since 1986 Rebate in excise duty for new plants March 1989 Withdrawal of all price and distribution controls Until 1989 Freight Pooling No freight pooling for non levy cement since 1982 Until 1991 Industrial licensing Source: Indian Economy (1998), Ahluwalia (1985, 1991), and Chakravarty (1989). On account of these difficulties in the cement industry the government of India introduced a system of partial decontrol in 1982. A levy quota of 66.6% for sales to government and small house builders was imposed on existing units while for new and sick units a lower quota at 50% was established. Levy cement was fixed uniformly for OPC and slightly lower for PPC. The balance of 33.4% could be sold in the free open market to general consumers. A ceiling price was set for sales in the open market in order to protect consumers from unreasonable high pricing. Under the system of partial decontrol non levy cement was no longer covered by freight pooling. Furthermore, specific mini cement units were completely freed from price and distribution controls. Although overall profitability increased substantially immediately after the introduction of partial decontrol, profits obtained through non-levy sales decreased with greater availability of cement in the market and continuously rising input costs. To sustain an accelerating course the government subsequently introduced changes in levy obligations and retention prices. At four points in time the government simultaneously reduced levy quotas and increased retention prices. As a result, in late 1988 the levy quota was as low as 30% for units established before 1982 and the retention price had increased substantially. In addition, during 1982 and 1987 the ceiling on non-levy prices was increased occasionally. In 1987, the cement manufacturers association and the government decided that there was no further need for a maximum price ceiling. 11
  • 21. Finally, in 1989, the industry was considered to be prepared for free market competition and all price and distribution controls were withdrawn. The system of freight pooling was abandoned and a subsidy scheme to ensure availability of cement at reasonable prices in remote and hilly regions of the country was worked out. By removing all controls in the cement sector the government hoped to accelerate growth and induce further modernization and expansion investments. 3. Statistical and Econometric Estimates 3.1 Statistical Analysis A variety of studies on productivity growth and technological change in Indian industries has been carried out so far. Originally these studies were driven by an interest in understanding the capital vanishing phenomena in the Indian industry between 1950 and 1980. During that time, labor productivity as well as capital availability and use increased considerably, while the overall growth rate of the economy stagnated at low levels (see Ahluwalia, 1991). Concerned about the efficiency of resource use researchers started investigating productivity growth and input factor substitutions for aggregate manufacturing as well as various industries. The results of these analyses differed substantially depending on the methodology, statistical specification employed as well as on the underlying sources of data, levels of aggregation and time periods considered. Over time more sophisticated and refined methodologies in connection with longer time series were employed to study productivity change. The contribution of total factor productivity to output growth was of primary interest to explain the continously low economic development. Partial factor productivity was investigated to better understand the importance of each factor of production and to evaluate substitution possibilities. In this context, the role of energy within the production process received increasing attention and consequently, besides the primary factors of production (capital and labor), energy and materials were added as secondary input factors into the analyses. Total factor productivity growth (TFPG) measures the growth in gross value added (GVA) in excess of the growth of a weighted combination of the two inputs capital and labor. For measuring output in form of gross value added all intermediate inputs are deducted. Thus, gross value added only provides the value that is actually added in the production process by using the two primary inputs of production: capital and labor. Total Productivity Growth, in contrast, relates gross value of output (VO) to the four input factors capital, labor, energy and materials. Since it accounts for intermediate inputs as well as primary inputs, value of output provides the more appropriate output measure if interested in analyzing energy and material as well as capital and labor. Commonly, three major growth accounting approaches are considered for estimating total factor productivity as well as total productivity growth: the Translog Index, the Solow Index and the Kendrick Index. The three indices differ in their complexity and the 12
  • 22. underlying economic assumptions. A detailed derivation of the three indices is provided in a survey report by Mongia and Sathaye (1998a). The Kendrick index is easy to understand in using an arithmetic aggregation scheme for the inputs. It is restrictive in that it is based on the assumption of a linear production function and in assigning constant (base year) shares in GVA (VO respectively) to the inputs. The Solow index is slightly more general in assuming a neo-classical, Cobb-Douglas, specification of the production function with constant returns to scale, perfect competition in the market and factors being rewarded their marginal products. The translog measure is based on a more complex production function associated with only a minimum numbers of assumptions. It is therefore of more general nature and provides the preferably used measure for productivity growth. Partial factor productivity (PP) indices are reported for all input factors. They are obtained by simply dividing the value figure for each factor by the gross value of output or by the gross value added respectively. Partial factor productivity growth indicates how much output changes in relation to a fixed amount of each single input. It measures how “productive” a factor is. The inverse means how much of a factor has to be used to produce a specific amount of output - it measures the factor intensity of production. Changes over time indicate a shift in production towards more intensive use of one factor probably accompanied by less use of another factor. Additionally, the capital labor ratio (K-L ratio) shows how much capital per head is used in the production process and provides a rough measure of the capital intensity of production. The tradeoff between capital and labor is particularly interesting in the context of labor-intensive developing countries, like India, that have put the emphasis on capital-intensive industries in its early development stages in order to improve the overall economic situation. Considering capital and labor productivity one should keep in mind that conceptually, in situations where capital intensity is increasing over time, the analysis of partial productivity changes may overstate the increase in labor productivity and understate the increase in capital productivity (Ahluwalia, 1991). With rising capital/labor ratio resources may shift from labor to the use of capital. Due to this shift, the measured increase in labor productivity may be larger than the pure increase in the productivity component (i.e. the change that is solely due to learning, learning-by-doing, improvement of skills, experience etc.). Similarly, the increase in pure capital productivity may be higher than the measured increase. The next section will give an overview of previous studies that have been conducted on productivity changes in the cement industry. Thereafter, in the following section, we develop our own estimates for both total and partial productivity using a consistent theoretical and empirical framework. 3.1.1 Previous Studies Previous results for statistical estimates of total factor productivity using the Translog, Solow and/or Kendrick index as well as measures of partial factor productivity and production functions for the cement industry are given in Appendix C. Figures 3.1 - 3.4 13
  • 23. display both the historical as well as our own estimates graphically. The graphical presentation allows to immediately realize the large differences in the estimates obtained by researchers for various points of time. The overview draws on Mongia and Sathaye (1998a). 3.1.1.1 Partial Productivity Capital Productivity Partial productivity growth estimates for capital are presented in Figure 3.1. The estimates for the different time periods range widely from positive numbers to very negative ones. Sawhney is the only author reporting positive capital productivity growth at 1.5% for his entire study period (1950-61). Gupta receives considerable positive growth at 8.7% for a subperiod of his time series (1958-65). While his entire time period estimate (1946-65) results in slightly negative growth at –0.6%, the first subperiod covering the years 1946- 58 reveals stronger capital productivity decline at –2.8%. Arya and Mehta estimate the strongest decrease in capital productivity of all studies under consideration, at –6.0%, and -5.6% respectively. Their time periods are similar to Gupta. Goldar concludes a loss in productivity for the years 1960-70 at –0.4% similar to the results from Gupta’s study. Likewise, the estimates of Ahluwalia and Arora are very close. While Ahluwalia investigates a 25 year period from 1960 to 1985, Arora considers a subperiod from 1973-81. Productivity declines at –1.4% in Ahluwalia’s and at –1.7% in Arora’s study. Labor Productivity Historical estimates reveal by and large positive development for labor productivity for the various time periods. Sawhney estimates a strong productivity increase of 7.3% on average between 1950-61. For a similar time range (1946-65), Gupta points out an increase of 2.5%, while Mehta (1953-64) concludes an average productivity loss of –1.6%. For labor productivity Arora's results differ substantially from Ahluwalia's estimates. For the period 1973-81, Arora indicates a decline in labor productivity of –2.3%. For 1960-85, Ahluwalia, however, reports an increase by 1.3%. Figure 3.2 provides a summary overview of historical estimates. Capital-Labor Ratio The overall trend of increasing labor productivity accompanied by declining capital productivity to some extent results from a process of capital deepening. Capital deepening in the Indian cement sector is confirmed in most studies by growing capital labor ratios (Figure 3.3). Both Goldar and Ahluwalia conclude a modest increase in the capital labor ratio over time at 3.0% and 2.7% for the time periods 1960-70 and 1960-85 14
  • 24. Figure 3.1: Estimates of Partial Productivity Growth: Capital Growth (% p.a.) 9 Gupta 8 7 6 5 CSO 4 3 2 Sinha CSO 1 Sawhney 0 Goldar Gupta -1 Ahluwalia Own Estimates (VO) -2 CSO Arora Own Estimates (GVA) Gupta -3 -4 -5 Mehta Arya -6 Year 46 48 50 52 54 56 58 60 62 64 66 68 70 72 74 76 78 80 82 84 86 88 90 92 19 19 19 19 19 19 19 19 19 19 19 19 19 19 19 19 19 19 19 19 19 19 19 19 Figure 3.2: Estimates of Partial Productivity Growth: Labor Growth (% p.a.) 8 Sawhney 7 6 Own Estimates (VO) Own Estimates (GVA) 5 Sinha 4 3 Gupta Goldar Arya Arora Gupta 2 Gupta CSO Ahluwalia 1 CSO 0 CSO -1 Mehta -2 Year 46 48 50 52 54 56 58 60 62 64 66 68 70 72 74 76 78 80 82 84 86 88 90 92 19 19 19 19 19 19 19 19 19 19 19 19 19 19 19 19 19 19 19 19 19 19 19 19 15
  • 25. Figure 3.3: Estimates of Capital-Labor Ratio Growth (% p.a.) 8.8 Arya 7.8 Own Estimates 6.8 Sawhney 5.8 Arora 4.8 Mehta CSO 3.8 Gupta Goldar Ahluwalia 2.8 Sinha 1.8 0.8 -0.2 CSO -1.2 -2.2 -3.2 -4.2 CSO -5.2 Year 46 48 50 52 54 56 58 60 62 64 66 68 70 72 74 76 78 80 82 84 86 88 90 92 19 19 19 19 19 19 19 19 19 19 19 19 19 19 19 19 19 19 19 19 19 19 19 19 Figure 3.4: Estimates of Total Factor Productivity Growth Growth Rate (% p.a.) 4 3 CSO (Kendrick) Gupta (Kendrick) Arya (Solow) 2 Sawhney (Kendrick) Pradhan (Translog ) Mahopatra (Solow) Sinha (Kendrick) CSO (Kendrick) 1 Goldar (Kendrick) Arya (Solow) Own Estimate (Kendrick) 0 CSO (Kendrick) Pradhan (Translog) Own Estimate (Translog) Gupta (Kendrick) Ahluwalia (Translog) -1 Gupta (Kendrick) Own Estimate (Solow) -2 Arora (Translog) -3 Arya (Solow) -4 -5 Mehta (Solow) Pradhan (Translog) Mehta (Kendrick) -6 Pradhan (Translog) -7 Year 46 48 50 52 54 56 58 60 62 64 66 68 70 72 74 76 78 80 82 84 86 88 90 92 19 19 19 19 19 19 19 19 19 19 19 19 19 19 19 19 19 19 19 19 19 19 19 19 Note: “Own Estimates” are compound growth rates for the time period under consideration. For the translog indices they present exponential growth. 16
  • 26. respectively. Mehta obtains a capital labor ratio of 4% for the period 1953-64, while Arora's estimate leads to a number even higher at 5.2% for the period 1973-81. Material Productivity Few authors consider additional inputs and productivity changes in their investigations. Exceptions to this are Gupta and Sawhney who include material inputs in their estimations and conclude very reverse results for the change in productivity. Gupta states a negative growth of material productivity at an average of –1.3% between 1946 and 1965, while Sawhney points out a positive change in productivity at 1.2% between 1950-61. 3.1.1.2 Total Factor Productivity Growth Total factor productivity change has been investigated in various studies. The examinations result in both positive and negative development of total factor productivity depending on the time range and subperiods under consideration. Estimated productivity growth is highest in the CSO study for the subperiod 1969-77 at 3.0% p.a. and lowest for Pradhan’s study, subperiod 1982-92, at –6.8% p.a. A cluster can be observed for growth of 1% to 2% p.a. for various time periods and different indices. Furthermore, most studies considering more recent time periods seem to reveal negative productivity development in the cement sector. Besides that, no clear pattern can be identified. As mentioned above aside from the time period the study results vary substantially with the underlying data and methodology employed. 3.1.2 Own Estimates In this section we present in detail our own estimates for both total and partial productivity. We develop the Translog, Solow and Kendrick index using a consistent theoretical and empirical framework. With the recognition of energy as a critical factor for economic growth and the special emphasis on energy use within this report, we explicitly account for energy in using a four factor input approach (K,L,E,M) in our analysis. As a comparison, we additionally state the results obtained from the two input factor model. Data has been compiled for the years 1973-93 from the Annual Survey of Industries, Government of India (various years). The methodology is explained in detail in Mongia and Sathaye (1998). 3.1.2.1 Partial Productivity Table 3.1 gives the partial productivity growth for the various inputs based on both value of output and gross value added. The table indicates the growth rate over the whole time period as well as split up by different time ranges within this period. Growth rates for the time periods are calculated as compound growth rates and time trends. This is to be in accordance with existing growth estimates conducted by various authors and presented in 17
  • 27. Section 3.1.1. above. Figure 3.5 displays the partial productivity of capital, labor, energy and material in relation to the value of output. Table 3.1 Partial Productivity Growth (selected time periods, per cent p.a.) Capital Labor Energy Material K / L ratio Capital Labor Growth VO / K VO / L VO / E VO / M K/L GVA / K GVA / L 1973-93 -1.65 5.77 0.08 2.21 7.54 -1.91 5.49 1973-83 -4.95 2.97 -0.50 -0.87 8.32 -2.51 5.60 1983-91 4.16 12.13 1.10 7.05 7.65 6.36 14.50 1991-93 -7.34 -4.27 -1.03 -1.06 3.32 -26.81 -24.38 Trend Rate 1973-93 -3.53 6.56 -0.37 2.27 10.09 -2.65 7.44 Note: Compound Growth; Trend Rate calculated as semi-logarithmic time trend, significant on 5% level. The table as well as the figure support significant changes in average productivity in the early 1980s and again in 1991. The first ten years of the time period under consideration (1973-83) show fluctuating patterns. Labor and capital productivity first increase and then fall at similar rates. In 1980, a turnaround in labor productivity can be observed while capital productivity further decreases. Energy and material productivity grow and fall at similar rates during that period. The following period, 1983-91, substantiates a period of progress with positive factor productivity growth for all factors. Yet, a sharp drop in productivity interrupts the overall upward trend in 1991. Most factors indicate a positive turn from 1992 on but for drawing further conclusion the time horizon would need to be expanded to include more recent trends. Over the whole time period 1973-93, factor productivity was increasing for labor and material and decreasing for capital and slightly for energy. Capital and labor productivity changes are of particular interest. Labor productivity increases over the whole time period as well as for different subperiods except the years following 1991. Labor productivity growth is by far highest at 12.1% in the period of overall progress in the cement sector between 1983 and 1991. Conversely, capital productivity shows an overall decreasing trend at –3.5% between 1973 and 1993. The downward trend is continual in the late 1970s and early 1980s. In accordance with the overall trend, capital productivity increases at 4.2% between 1983 and 1991 followed by a modest drop after 1991. The increase in labor productivity is to some extent the result of the process of capital deepening, the increasing use of capital per head, indicated by a high growth in the capital labor ratio at 10.1%. Resources have shifted from labor to the use of capital over time. The examination of capital and labor in relation to gross value added rather than gross value of output confirms the results for capital and labor productivity. Due to an extraordinary drop in GVA in 1991 losses in productivity of capital and labor in relation to GVA are of much higher values than in relation to VO. However, the results are of similar nature in terms of direction and size of change. 18
  • 28. Figure 3.5: Index of Partial Productivity (KLEM and Value of Output) based on 1973-74 constant values Index 3.6 3.2 2.8 Capital 2.4 Labor Energy Materials 2.0 1.6 1.2 0.8 0.4 Year 1973 1974 1975 1976 1977 1978 1979 1980 1981 1982 1983 1984 1985 1986 1987 1988 1989 1990 1991 1992 1993 Unlike capital and labor, energy and material follow a very similar path over the whole time range. They show slightly decreasing growth in the first ten years of the time period considered (1973-83). Between 1983 and 1991, however, they progress substantially with material productivity rising at 7.05% and energy productivity at 1.1%. Thereafter, following 1991, both energy and material productivity fall down to negative productivity development again. 3.1.2.2 Total Factor Productivity Total factor productivity relates the input factors capital and labor to gross value added. It measures the growth in gross value added (GVA) that can not be explained by the growth of a weighted combination of the two inputs capital and labor. Figure 3.6 shows the development of total factor productivity as measured by the Kendrick, Solow and Translog Indices over time. In addition, Table 3.2 gives total factor productivity growth for different time periods. The growth rates for the Kendrick and the Solow indices are estimated as compound growth rates. The Translog index, however, is based on the assumption of exponential growth due to its logarithmic, non-linear nature. 19
  • 29. Figure 3.6: Index of Total Factor Productivity based on 1973-74 constant values Index 2.0 1.8 1.6 Translog Solow 1.4 Kendrick 1.2 1.0 0.8 0.6 Year 1973 1974 1975 1976 1977 1978 1979 1980 1981 1982 1983 1984 1985 1986 1987 1988 1989 1990 1991 1992 1993 The three indices are related in their patterns. The Translog index fluctuates in between the Kendrick and the Solow index. The division into three subperiods reveals similar behavior of total factor productivity to partial productivity. The period 1973-1983 on average shows negative growth for the Translog and Solow index (Translog: -0.22%, Solow: -1.49%) and minimal positive growth at 0.16% for the Kendrick index. In contrast, the second period, 1981-93, gives very positive factor productivity growth at 7.75% (Translog), 6.04% (Solow) and 8.04% (Kendrick) with a strong peak for all indices in 1991. Following this peak, total factor productivity decreases rapidly at high rates of 26.42% to 30.23%. Table 3.2: Total Factor Productivity Growth (selected time periods, per cent p.a.) Growth Translog Solow Kendrick 1973-93 -0.03 -1.66 0.16 1973-83 -0.22 -1.49 0.26 1983-91 7.75 6.04 8.04 1991-93 -30.23 -27.90 -26.42 Time Trend 1973-93 0.09 -1.82 0.38 Note: Translog: Exponential Growth; Solow, Kendrick: Compound Growth. Trend Rate calculated as semi-logarithmic time trend, significant on 5% level. 20
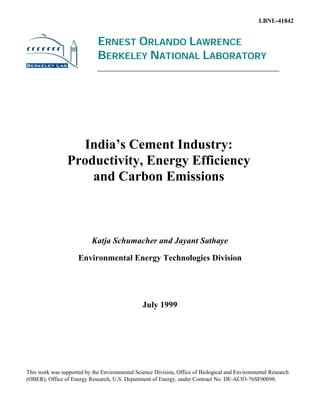
  • 30. 3.1.2.3 Total Productivity Total productivity measures the growth in gross value of output in excess of the growth of a weighted combination of the inputs capital, labor, energy and material. As with total factor productivity we consider three different indices for measuring total productivity. Table 3.3 and Figure 3.7 present the growth of the three indices and their evolution over time. The patterns differ slightly from total factor productivity estimates due to the more modest development of value of output over time compared to the development of gross value added. Figure 3.7 best supports the division into the three subperiods (1973-83, 1983-91 and 1991-93). All three indices show fluctuating behavior for the first time period, accounting for a decrease in total productivity of –1.66% (Translog), -2.50 (Solow) and –1.47 (Kendrick). Reaching a low point in 1983, total productivity increases steadily thereafter. Total productivity growth of around 4.8% for all indices supports the notion of overall progress in the cement industry between 1983 and 1991. Following a peak in 1991, total productivity drops in 1992 and then again recovers slightly. For the whole time period under consideration two indices, Translog and Kendrick, indicate a slight increase in total productivity of 0.26% and 0.47%. The Solow index shows a decrease of –0.28% p.a. As explained above this growth is driven by a very positive development in the mid 1980s to the beginning of the 1990s which offsets the losses in the remaining years. To see why these three distinctive time periods can be extracted and which factors underlie the specific development, Section 3.3 will in more detail discuss the results in the context of overall economic and policy changes at specific points of time. Table 3.3: Total Productivity Growth (selected time periods, per cent p.a.) Growth Translog Solow Kendrick 1973-93 0.77 0.28 0.90 1973-83 -1.66 -2.50 -1.47 1983-91 4.71 4.80 5.04 1991-93 -2.84 -3.32 -3.28 Time Trend 1973-93 0.26 -0.28 0.47 Note: Translog: Exponential Growth; Solow, Kendrick: Compound Growth. Trend Rate calculated as semi-logarithmic time trend, significant on 5% level. 21
  • 31. Figure 3.7: Index of Total Productivity based on 1973-74 constant values Index 1.4 1.3 1.2 1.1 1 0.9 Translog Solow Kendrick 0.8 0.7 Year 1973 1974 1975 1976 1977 1978 1979 1980 1981 1982 1983 1984 1985 1986 1987 1988 1989 1990 1991 1992 1993 Decomposition of Growth in Value of Output A very insightful way of looking at growth in output is to decompose growth into the contribution of factor input changes and total productivity growth. Generally, growth in production is two-folded consisting of increased use of inputs and some additional change (gain or loss) in productivity. As mentioned growth in productivity thereby includes technological change, learning, education, organization and management improvements etc. The two-folded base of growth in output can naturally imply that growth in output is accompanied by increase in factor input and decrease in productivity, by decrease in factor input and increase in productivity or by increase in both factor input and productivity. Table 3.4 presents the decomposition results for our study period and the subperiods identified above. Table 3.4: Decomposition of Growth in Value of Output Growth (%) in Year Value of Labor Capital Material Energy Total Total Output Input Input Input Input Input Productivity 1973-93 8.69 0.23 2.89 2.57 2.22 7.92 0.77 1973-83 6.35 0.30 3.05 3.04 1.61 8.01 -1.66 1983-91 13.68 0.15 2.82 2.54 3.46 8.97 4.71 1991-93 0.43 0.22 2.34 0.37 0.33 3.27 -2.84 Table 3.4 shows that overall output in the cement sector measured as average exponential growth of gross output followed a quite positive trend growing at 8.69% over the period 1973-93. However, the decomposition reveals that this positive development is mainly due 22
  • 32. to increased use of factor inputs (7.92% growth in factor inputs). Productivity growth over the same time period only contributes 0.77%. The same is true for the subperiod of progress, 1983-91. Increases in output contribute 8.97% to the increase in output of 13.68% during that period. Productivity gain reaches its highest share accounting for more than a third, 4.71%, of output growth. The periods 1973-83 and 1991-93 show less positive development. Productivity decreases at –1.66% (-2.84% respectively) during these periods implying that output growth is solely driven by the increased use of factor inputs. Total inputs contribute 8.01% in the earlier period, about the same amount they contribute in the period of progress. Productivity growth, however, is negative so that overall output in the early period is lower. The last period (1991-93) gives small increases in the use of factor inputs as well as a significant decline in productivity resulting in almost stagnating output (0.43%). 3.2 Econometric Analysis The accounting framework employed for the derivation of total and total factor productivities does not explain why factor demand changes over time. However, understanding substitution processes between input factors and the effects of factor price changes on input use is crucially important for determining the rate and direction of technological change and thus productivity growth. Few researchers so far have tried to tackle this issue in econometrically estimating production or dual cost functions and concluding patterns and relationships between input factors. 3.2.1 Previous Studies Arya (1983) studied technological and productivity changes for 15 cement manufacturing companies. Using data from annual reports of the companies for the years 1956-72 he estimates Cobb-Douglas production functions. The trend rates of growth show wide variation across his sample and fall in the range of 0.8% to 6.8% p.a. Capital intensity during that time period increases at an average rate of 2.8% p.a. for the sample group. Mehta (1980) also estimates Cobb Douglas production functions for some energy- intensive industries including the cement industry. His sample period encompasses the years 1953 to 1965. He finds evidence of capital deepening in the production process but could not conclude any clear trend regarding efficiency improvements. Productivity in the cement sector for his time period grows at 6.1%. 3.2.2 Own Estimates Our results for the econometric estimation of productivity change and patterns of input substitution are received from both the statistical analysis and from estimating a translog cost function approach with four input factors: capital, labor, energy and material. For a detailed presentation of the economic framework, the specifications and the estimates see 23
  • 33. Roy et al. (1999). The following tables extract from their results and present the most important and most interesting findings to our analysis. Our analysis focuses on the causes and effects of changes of factor inputs with particular emphasis on energy use. Accordingly, energy prices and energy price changes over time play a dominant role. Therefore, Table 3.5 presents the elasticities of the cost shares2 for each input with respect to changes only in energy prices. The technical bias parameter is reported for all factor inputs and is crucially important for understanding direction and rate of technological change. It indicates which of the factors have been substantially made use of in the process of technological change. Table 3.5: Estimated Parameters for the Translog Cost Function Approach Parameter bme ble bke bee bmt blt bkt bet btt -0.181 0.018 0.123 0.040 -0.004 -0.004 0.003 0.005 -0.002 t-value (-3.672) (1.353) (3.785) (1.393) (-2.930) (-9.732) (2.521) (7.265) (-0.552) bij= elasticity of share of i input with respect to the change in the price of jth input bit= technical bias parameter Regarding the cost share elasticities the table shows that the cost shares of capital, labor and energy increase with rising energy prices while the cost shares of material decreases with rising energy prices. However, the increase in labor and energy are insignificant. The parameter btt a slight but insignificant acceleration of technical change over time. Economically, a constant technical change parameter would mean a downward or upward shift of the production function to be constant over time, or in other words a constant autonomous increase/decrease in production independent of inputs. As shown in the previous section productivity in the cement sector has been increasing in the past. Thus, a technical change parameter btt equal to zero would indicate that this advance has been quite stable over time. This hypothesis, however, can not be sustained from the analyses of the previous chapter. Changes in productivity usually affect all input factors differently. The technological change bias parameters, bit, indicate a significant energy and capital using bias. At the same time technological change is significantly material and labor saving (Table 3.6). Table 3.6: Technical Change Bias Material Labor Energy Capital Technical Change saving saving using using For the analysis of patterns of substitution and effects of price changes on the immediate use of input factors the own and cross price elasticities are of particular interest. Price elasticities show the extent to which the input of one factor changes in response to a price change of one other or the same input factor. Own price elasticities have to be negative by theory. A price increase for a normal good leads to reduced demand for this particular good. A positive cross price elasticity indicates a substitutional relationship between the 2 Cost shares are defined as factor input costs over total input costs (sum of capital, labor, energy and material costs). 24