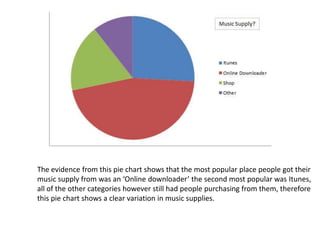
1. The evidence from this pie chart shows that the most popular place people got their
music supply from was an ‘Online downloader’ the second most popular was Itunes,
all of the other categories however still had people purchasing from them, therefore
this pie chart shows a clear variation in music supplies.
2. Its clear from the information given in this pie chart that the most popular age
range taking this survey was 11 to 18 year olds, the other age ranges did take the
survey however 11-18 was by far the most popular category, this shows the ages
range in which the details of music magazines in this survey applies to.
3. From the information shown in this pie chart the large dark blue area
resembles those who don’t buy music magazines. However
concentrating on the music magazines people taking the survey do
buy the most popular ones seem to be Kerrange and NME, this gives
me help when designing my magazine as to give my magazine similar
characteristics to the those that my readers are already fond of and
buy.
4. From the information given in this pie chart taken from mu survey it’s not really
obvious which reader hobby is more popular that others, however large areas
include Going out, friends, internet and shopping. This again gives ideas of what
type of articles could be included in my magazine given the hobby information
supplied by readers.
5. Evident in the bar chart here the most popular genre of music listened
to by the survey takers by quite a chunk is R&B, other genres such as
Hip-Hop, Pop, Dance, Club and Metal are all quite popular but not as
much as R&B. This gives an idea of what genre of bands to include in my
magazine in order to keep up with the demand of reader interest.
6. It’s quite obvious that when buying a magazine what many of the readers look for
is bands they like and something eye catching with colours and intriguing fonts as a
front cover, followed by what is to be included in the content. This therefore gives
an idea how the magazine should be designed in order to appeal to reader, a good
front cover which makes people want to read/buy.
7. As shown in the small pie chart the majority of people answering the survey
preferred a busy and eye catching cover rather than a simple and classy one. This
includes lots of pictures/colours/fonts/bands/artists. This also gives an idea when
thinking about the designing of my cover on what the readers prefer.
8. As shown here £1-2 is the most popular price readers would
be willing to pay for a music magazine. However it also shows
that a decent chunk of those taking the survey would be
willing to pay from £3-5 or over as those ranges were not left
un-filled. These results as a whole give me a good
understanding to prices and how much people are willing to
pay, also how to price mine matching with the content of the
magazine also.
9. The majority of those filling out my survey were females, this means that a lot
of the answers given in my survey were in correspond with female opinions
rather than male ones. This shows me that much of the content should cater to
a female gender as they’re the main readers.
10. The pie chart shows the type of social networking sites those taking my survey used
most. Therefore the most popular social networking site is twitter. This could help me
in designing my magazine as I would be able to include twitter references, or even
advertise my magazine to audiences via twitter.