
Recomendados
Más contenido relacionado
Destacado
Similar a Nautilus Allocator Dec2010
Similar a Nautilus Allocator Dec2010 (20)
Nautilus Allocator Dec2010
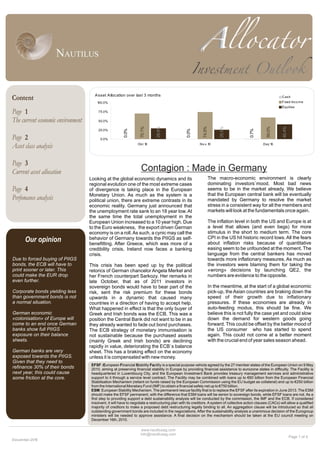
- 1. A sset A llocation over last 3 months Content C ash F ixed Inco m e 100.0% Equities Page 1 75.0% The current economic environment 50.0% 70.1% 29.9% 74.5% 25.5% 59.0% 40.4% 0.0% 0.0% 0.7% 25.0% Page 2 0.0% Okt 10 N o v 10 D ez 10 Asset class analysis Page 3 Current asset allocation Contagion : Made in Germany Looking at the global economic dynamics and its The macro-economic environment is clearly regional evolution one of the most extreme cases dominating investors`mood. Most bad news Page 4 of divergence is taking place in the European seems to be in the market already. We believe Monetary Union. As much as the system is a that the European central bank will be eventually Perfomance analysis political union, there are extreme contrasts in its mandated by Germany to resolve the market economic reality. Germany just announced that stress in a consistent way for all the members and the unemployment rate sank to an 18 year low. At markets will look at the fundamentals once again. the same time the total unemployment in the European Union increased to a 10 year high. Due The inflation level in both the US and Europe is at to the Euro weakness, the export driven German a level that allows (and even begs) for more economy is on a roll. As such, a cynic may call the stimulus in the short to medium term. The core behavior of Germany towards the PIIGS as self- CPI in the US hit historic record lows. All the fears Our opinion benefitting. After Greece, which was more of a about inflation risks because of quantitative credibility crisis, Ireland now faces a banking easing seem to be unfounded at the moment. The crisis. language from the central bankers has moved Due to forced buying of PIIGS towards more inflationary measures. As much as bonds, the ECB will have to This crisis has been sped up by the political the investors were blaming them for taking the print sooner or later. This retorics of German chancelor Angela Merkel and «wrong» decisions by launching QE2, the could make the EUR drop her French counterpart Sarkozy. Her remarks in numbers are evidence to the opposite. even further. late October, that as of 2011 investors in sovereign bonds would have to bear part of the In the meantime, at the start of a global economic Corporate bonds yielding less risk, sent the risk premium for these bonds pick-up, the Asian countries are braking down the than government bonds is not upwards in a dynamic that caused many speed of their growth due to inflationary a normal situation. countries in a direction of having to accept help. pressures. If these economies are already in What happened in effect is that the only buyer of auto-feeding modus, this should be fine. We German economic Greek and Irish bonds was the ECB. This was a believe this is not fully the case yet and could slow «colonisation» of Europe will position the Central Bank did not want to be in as down the demand for western goods going come to an end once German they already wanted to fade out bond purchases. forward. This could be offset by the better mood of banks show full PIIGS The ECB strategy of monetary immunisation is the US consumer who has started to spend exposure on their balance not sustainable because the purchased assets again. This could not come at a better moment sheets. (mainly Greek and Irish bonds) are declining with the crucial end of year sales season ahead. rapidly in value, deteriorating the ECB`s balance German banks are very sheet. This has a braking effect on the economy exposed towards the PIIGS. unless it is compensated with new money. Given that they need to EFSF :European Financial Stability Facility is a special purpose vehicle agreed by the 27 member states of the European Union on 9 May refinance 30% of their bonds 2010, aiming at preserving financial stability in Europe by providing financial assistance to eurozone states in difficulty. The Facility is next year, this could cause headquartered in Luxembourg City, and the European Investment Bank provides treasury management services and administrative some friction at the core. support to it through a service level contract. The Facility may be combined with loans up to €60 billion from the European Financial Stabilisation Mechanism (reliant on funds raised by the European Commission using the EU budget as collateral) and up to €250 billion from the International Monetary Fund (IMF) to obtain a financial safety net up to €750 billion. ESM: European Stability Mechanism. The permanent rescue facility that is to replace the EFSF after its expiration in June 2013. The ESM should make the EFSF permanent, with the difference that ESM loans will be senior to sovereign bonds, while EFSF loans are not. As a first step to providing support a debt sustainability analysis will be conducted by the commission, the IMF and the ECB. If considered insolvent, it will have to negotiate a restructuring plan with its creditors. A system of collective action clauses (CACs) will allow a qualified majority of creditors to make a proposed debt restructuring legally binding to all. An aggregation clause will be introduced so that all outstanding government bonds are included in the negociations. After the sustainability analysis a unanimous decision of the Eurogroup ministers will be needed to approve assistance. A final decision on the mechanism should be taken at the EU council meeting on December 16th, 2010. www.nautilusag.com info@nautilusag.com Page 1 of 4 Decem ber-2010
- 2. General Market Returns (November 2010) Asset Allocation (December 2010) Market Month-to-date Year-to-date Cash (0.6%,+0.6%):small allocation increase. The short term yields are beginning to pick up in yield. Performance Performance 3M Treasury Bill 0.0% 0.1% Bonds (59%, -15%): As the impact of QE2 (Quantitative Easing) Barclays US Treasury 1-3Y Index-0.2% 2.6% seems to be fading out after the announcement of the US to start up Barclays US Treasury 7-10Y Index -0.8% 13.3% another 600 billion, the allocation to bonds have been reduced Barclays US Treasury +20Y Index1.3% - 13.6% substantially. In the allocation we increased the 1-3 years by 5% and the 20+ years by 18%. The 7-10 years has been reduced by 11% and Barclays Corp.Inv.Grade Index -0.8% 10.0% the corporate bonds have been liquidated. We believe that the sell-off Dow Jones World Index -1.9% 5.4% on the long end has been overdone and that the QE, which is still ongoing and might even start in Europe, will also focus on longer Top 5 perform ing sectors duration bonds, where most of the economic stimulus can be Sector Return (Nov 2010) Allocation (Nov 2010) delivered. This is a dynamic reweighting and needs to be seen in the Energy 1.35% 0.00% light of the reduction of the fixed income allocation by 15%. Basic Materials 0.56% 11.23% Industrial 0.30% 0.00% The duration in the model increased from 9 to 10.5 this month. Consumer Services -0.57% 5.88% Equity (40%, +15%): Most of the bad macro-economic news from the Consumer Goods -0.75% 1.62% sovereign side in Europe seems to be in the markets. The Emerging markets saw a serious correction in November and so did the Flop 5 perform ing sectors developed countries, with Europe suffering the most. With the earning Sector Return (Nov 2010) Allocation (Nov 2010) season behind us, it is clear that the companies are in good shape, Technology -1.44% 6.06% with plenty of cash and EBITDA margins not seen in over a decade. Healthcare -3.37% 0.00% This has not really shown up in the equity prices which were dominated Financials -5.07% 0.00% by macro themes. We continue to have little exposure to the financial sector (banks and insurances) which is clearly carrying the biggest risk Telecoms -5.52% 0.40% in the sovereign crisis. Utilities -5.63% 0.00% European CDS spreads and EUR/USD (Oct-Nov 2010) Sector Allocation B ilateral agreement between M erkel and Sarko zy saying 1.44 500 that private secto r sho uld be invo lved in risk sharing. The main overweights and underweights of last month remain or were increased: Basic materials (11.3%, -0.6%), consumer goods (10%, 1.42 +8.3%) and consumer services (7%, +1.5%.) Biggest underweights are 400 in Oil&Gas (0.7%, +0.7%), financials (2.6%, +2.5%) and utilities (0.9% 1.4 +0.9%). The weight in Technology was reduced by -4.2% to 1.9%. CDS Spread (% points) EUR/USD rate 1.38 The biggest overweight we have is in the basic materials. There is a 300 large wave of consolidation taking place in the sector. There seems to be 1.36 more and more resilience in commodities versus the evolution of the USD. Once this decoupling becomes clearer, there could be a second 200 1.34 bull wave in the commodity sector. 1.32 Geographical Allocation 100 1.3 A clear increase in the allocation to Japan, which at 16.9% is the biggest geographical exposure. Japan did very well in the previous month and has room to recover as it has underperformed this year. furthermore the 0 1.28 01 0 .1 08.10 1 0 5.1 22.10 29.10 05.11 1 1 2.1 1 1 9.1 26.11 recent weakening of the Yen versus its main trading partners will help. All P o rtugal Spain Italy B elgium Germany EUR/USD (right scale) other countries are underweight versus the index, except for a neutral So urce : B lo o mberg, Nautilus weight to the United States which will continue to benefit from QE. The above graph illustrates the European misery made in Germany. It Europe, Latin America and Asia Pacific remain underweight due to shows the market reaction to the bilateral talks between Germany and macro-economical factors such as sovereign debt and capital flow France that the bondmarket should carry the pain of countries in taxing. The exposure to Europe would change for the positive once a distress being bailed out. This was seen as very negative by the new QE is introduced in Europe and a more inflationary stance would be market and made investors focus on other countries than Greece and taken by the ECB. This will most probably happen in the months to Ireland. Even the core countries (such as Belgium) saw their spreads come. against Germany increasing fast. This statement has been revised in the meantime, but the damage has been done...Euro lower will make the German economy even stronger. Nautilus Capital AG Landstrasse 60 •FL-9490 Vaduz • Liechtenstein • www.nautilusag.com T +423 232 1540 • info@nautilusag.com Page 2 of 4 Decem ber-2010
- 3. Current Asset Allocation Asset Allocation Historical Asset Allocations Cash Cash (Last 5 years) Fixed Inco me 80.0% Fixed Inco me Equity Equity 100.0% 60.0% 75.0% 40.0% 50.0% 20.0% 25.0% 0.7% 59.0% 40.4% 0.0% 0.0% Dez 05 Dez 06 Dez 07 Dez 08 Dez 09 Dez 10 A sset Classes Fixed Income Allocation: Sector Fixed Income Allocation: Duration 40.0% 40.0% 30.0% 30.0% 20.0% 20.0% 10.0% 10.0% 2.9% 35.6% 20.5% 0.0% 2.9% 35.6% 20.5% 0.0% 0.0% UST 1 Year UST 7-1 Year UST 20+ Year -3 0 US Co rp.Inv <3 Years 7-1 Years 0 10-20 Years Equity Allocation: Regions Equity Allocation: Industries 0% 4% 8% 12% 16% 20% 0% 2% 4% 6% 8% 10% 12% United Kingdom 2.2% B asic M aterials 10.7% Co ns. Go o ds 10.0% No rth A merica 14.5% Co ns. Services 7.4% Latin A merica 0.0% Financials 2.6% Health Care 1.3% Japan 16.9% Industrials 3.8% Europe, Ex-UK (Eme) 0.0% Oil & Gas 0.7% 5.1% Techno lo gy 1.9% Europe, Ex-UK (Dev) Telco s 1% .1 A sia/P acific, Ex-Japan 1.6% 0.9% Utilities Equity Allocation: Under/Over Regions Equity Allocation: Under/Over Industries Europe, Ex-UK (Eme) -87.1% B asic M aterials 166.0% Co nsumer Go o ds 105.3% Europe, Ex-UK (Dev) -28.3% Co nsumer Services 91.7% United States 1% .1 Financials -69.2% Health Care -49.0% United Kingdom -3.0% Industrials -30.4% Latin A merica -100.0% Oil & Gas -83.2% Techno lo gy -44.1% Japan 435.6% Telco s -44.8% A sia/P acific, Ex-Japan -64.3% Utilities -52.5% -50% -25% 0% 25% 50% -50 -25 0% 25 50 75 100 125 150 1 200 75 % % % % % % % % % % Nautilus Capital AG Landstrasse 60 •FL-9490 Vaduz • Liechtenstein • www.nautilusag.com T +423 232 1540 • info@nautilusag.com Page 3 of 4 Decem ber-2010
- 4. Performance Analysis DRM US 3M US Aggregate Benchmark** Dow Jones Treasury Agg. World Bond Index Return Currency USD USD USD USD USD Month Return (Nov-10) -0.8% -1.2% -1.9%0.0% -0.6% Year-to-date Return 3.1% 6.6% 5.4%0.1% 7.7% Last 12 Months Return 3.9% 6.7% 7.6%0.1% 6.0% Last 24 Months Return 3.7% 12.8% 20.1%0.1% 8.8% Total Annual Return * 8.9% 5.3% 4.9%2.1% 5.7% Standard Deviation (Volatility) * 7.5% 8.4% 16.9%0.5% 3.8% Semi-Standard Deviation (<0) * 7.1% 9.9% 19.2% NM 3.8% Sharpe Ratio * ( rf = 2.07% ) 0.91 0.38 0.17 NM 0.97 Sortino Ratio * ( rf = 2.07% ) 0.96 0.33 0.15 NM 0.97 Positive Months * 67.3% 64.5% 99.1% 58.9% 69.2% Average Monthly Return * 0.7% 0.4% 0.4%0.2% 0.5% All figures are annualized measures of returns. * Period: Jan-02 to Nov-10. ** Benchmark = 5% UST 3M + 22.5% UST 1-3Y + 9% UST 7-10Y + 5.4% UST 20+Y + 8.1% US Corp. Inv. Grade Bonds + 50% Dow Jones Aggr. World Equity Index. Cummulative Performance 250 Cummulative Outperformance 100% DRM 200 B enchmark 75% 150 50% 25% 100 0% 50 -25% Dez Dez Dez Dez Dez Dez Dez Dez Dez Dez Dez Dez Dez Dez Dez Dez Dez Dez 01 02 03 04 05 06 07 08 09 01 02 03 04 05 06 07 08 09 Current Month Performance Attribution Cash Rew ard to Risk Analysis of Returns vs. Benchmark Fixed Inco me 12.5% Equities To tal 10.0% Realized Return 5.0% 5.0% DRM (Reward) 7.5% 2.5% 2.5% 5.0% US Ag Bd Benchmark Dow Jones 0.0% 0.0% Index Agg. World 2.5% Index 3M -Treasury -2.5% -2.5% 0.0% 0% 5% 10% 15% 20% 25% -5.0% -5.0% A sset A llo catio n Secto r Ro tatio n To tal Value A dded Incurred Volatility (Risk) This publication is for your information only and is not intended as an offer, or a solicitation of an offer, to buy or sell any Investment or other specific product. Although all information and opinions expressed in this document were obtained from sources believed to be reliable and in good faith, no representation or warranty, express or implied, is made as to its accuracy or completeness. All information and opinions as well as any prices indicated are subject to change without notice. At any time Nautilus Capital ("Nautilus") (or employees thereof) may have a long or short position, in relevant securities. Some investments may not be readily realisable at times of illiquid market circumstances. Therefore valuing the investment and identifying the risk to which you are exposed may be difficult to quantify. Futures and options trading is considered risky and past performance of an investment is not a guide to its future performance. Some investments may be subject to a decline in value and on realisation you may receive back less than you invested. Changes in FX rates may have an adverse effect on the price, value or income of an investment. Each investment needs to be seen in the context of your particular investment objectives, financial situation and needs and we would recommend that you take financial advice as to the tax implications of investing in any of the products mentioned herein. Nautilus Capital AG Landstrasse 60 •FL-9490 Vaduz • Liechtenstein • www.nautilusag.com T +423 232 1540 • info@nautilusag.com Page 4 of 4 Decem ber-2010