Passenger Rail vs. Multi-Modal Transportation Corridor
•
0 recomendaciones•1,573 vistas

Comparison of Passenger Rail and Multi-Modal Transportation Corridor in Santa Cruz County.

Recomendados
Recomendados
Más contenido relacionado
La actualidad más candente
La actualidad más candente (20)
Similar a Passenger Rail vs. Multi-Modal Transportation Corridor
Similar a Passenger Rail vs. Multi-Modal Transportation Corridor (20)
Último
Último (20)
Passenger Rail vs. Multi-Modal Transportation Corridor
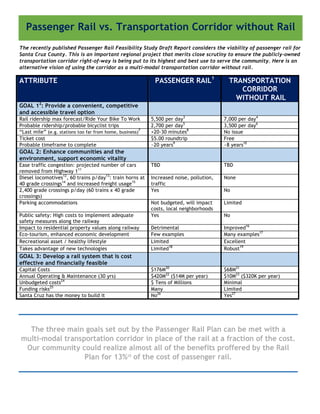
- 1. Passenger Rail vs. Transportation Corridor without Rail The recently published Passenger Rail Feasibility Study Draft Report considers the viability of passenger rail for Santa Cruz County. This is an important regional project that merits close scrutiny to ensure the publicly-owned transportation corridor right-of-way is being put to its highest and best use to serve the community. Here is an alternative vision of using the corridor as a multi-modal transportation corridor without rail. ATTRIBUTE PASSENGER RAIL1 TRANSPORTATION CORRIDOR WITHOUT RAIL GOAL 12 : Provide a convenient, competitive and accessible travel option Rail ridership max forecast/Ride Your Bike To Work 5,500 per day3 7,000 per day4 Probable ridership/probable bicyclist trips 2,700 per day5 3,500 per day6 “Last mile” (e.g. stations too far from home, business) 7 +20-30 minutes8 No issue Ticket cost $5.00 roundtrip Free Probable timeframe to complete ~20 years9 ~8 years10 GOAL 2: Enhance communities and the environment, support economic vitality Ease traffic congestion: projected number of cars removed from Highway 111 TBD TBD Diesel locomotives12 , 60 trains p/day13 : train horns at 40 grade crossings14 and increased freight usage15 Increased noise, pollution, traffic None 2,400 grade crossings p/day (60 trains x 40 grade crossings) Yes No Parking accommodations Not budgeted, will impact costs, local neighborhoods Limited Public safety: High costs to implement adequate safety measures along the railway Yes No Impact to residential property values along railway Detrimental Improved16 Eco-tourism, enhanced economic development Few examples Many examples17 Recreational asset / healthy lifestyle Limited Excellent Takes advantage of new technologies Limited18 Robust19 GOAL 3: Develop a rail system that is cost effective and financially feasible Capital Costs $176M20 $68M21 Annual Operating & Maintenance (30 yrs) $420M22 ($14M per year) $10M23 ($320K per year) Unbudgeted costs24 $ Tens of Millions Minimal Funding risks25 Many Limited Santa Cruz has the money to build it No26 Yes27
- 2. 1 Sources: Statistics and costs (including both capital and O&M costs) in this column include Passenger Rail according to Scenario G1 in Passenger Rail Feasibility Study (PRFS), May 2015 2 Goals stated here are from the PRFS 3 See Scenario G and G1 in PRFS p.98 4 Source: “State of Cycling” Santa Cruz County 2015 data of 7,000 participants in last 3 years Bike to Work/School Days 5 Based on analysis of comparable rail project – San Diego County’s SPRINTER – actual ridership is 7,800 vs. initial feasibility forecasted ridership of 16,000; Sources: http://web1.ctaa.org/webmodules/webarticles/articlefiles/North_County_SPRINTER.pdf and http://www.gonctd.com/wp-‐content/uploads/2013/08/012313-‐SPRINTERFactSheet.pdf. It is also worth noting that North San Diego County has almost 4x the population of Santa Cruz County (U.S. Census Bureau). 6 Data from other cities shows that when a safe alternative for bikes is provided, usage spikes. In Minneapolis, MN bicyclists increased 81% on protected bike lanes. Source http://www.planetizen.com/node/73269. Bicycling is a popular workstyle in Santa Cruz which as the 2nd highest rate of bike-‐to-‐work trips in the state; RTC 2014 bike ridership count for Santa Cruz County was 2,503 (one-‐time annual count). 7 Most mass transit fails due to what urban planners call the first-‐ and last-‐mile problem. You'd like to commute on public transit, but it's unlikely that you live or work close enough to a station to walk. So even if public transit is available, commuters often stay in their cars because the alternative-‐the hassle of driving, then riding, then getting to your final destination-‐is inconvenient, or too time consuming. Source: http://magazine.good.is/articles/convenience-‐is-‐ king 8 http://media.metro.net/projects_studies/sustainability/images/path_design_guidelines_draft _november_2013.pdf 9 Proposition 116 funds used to buy the current rail ROW were granted in 1990. 22 years later (2012) the rail ROW was purchased from Union Pacific and now 3 years later (2015) we have the first Passenger Rail Feasibility Study. With very little of the $176M capital cost needed to build the passenger rail budgeted or readily available, many years of design and engineering work ahead, plus environmental review, many regulatory issues (PUC, STB, Coastal Commission, etc.), potential lawsuits, 24 bridges in need of repair, and an RTC with no experience building or operating a passenger rail service, one quickly gets to the 20 year estimate noted here. As an example, San Diego did their Feasibility Study for the SPRINTER passenger rail project in 1990 and the first train ran in 2008. 10 Since the Monterey Bay Sanctuary Scenic Trail Master Plan was published in November 2013 – less than 2 years ago – already approximately 8 miles or 25% of the trail is funded with construction moving forward on several segments. 11 It is incumbent on the Santa Cruz County RTC to survey actual commuters on Hwy 1 to understand who they are and what their needs are, and whether passenger rail or bike would
- 3. be viable alternatives for them (e.g. contractors, landscapers, and others who depend on their truck to carry equipment are not likely to take the train or bike). 12 See pg. 26 and pg. 94 of PRFS 13 See pg. 98 of PRFS 14 Under the Train Horn Rule (49 CFR Part 222), locomotive engineers must begin to sound train horns at least 15 seconds, and no more than 20 seconds, in advance of all 40 public grade crossings (p.79 of PRFS). Source: https://www.fra.dot.gov/Page/P0104 15 Statement by Iowa Pacific, the current rail operator, that they are “actively looking for new freight customers”. Source: 6/4/15 RTC meeting 16 Source: Analysis of Economic and Social Impact of Trail Development, Johnson City, TN Rail Trail Report, Chapter 6: “Dedicated multi-‐use trails provide communities with a valuable amenity that translates into increased housing values. According to the National Association of Homebuilders, trails are consistently ranked one of the most important community amenities by prospective homebuyers, above golf courses, parks, security, and others.” See www.nahb.com. Another study of over 90,000 U.S. home sales found that improved walking conditions correlated with higher housing prices in 13 of the 15 housing markets studied, controlling for other factors that influence housing value. The results showed that houses in walkable neighborhoods have property values $4,000 to $34,000 higher than houses in areas with average walkability. Source: Cortright, J. (2009). Walking the Walk: How walkability raises housing values in U.S. cities. 17 Source: www.railstotrails.org, “From Trail Towns to Trail-‐Oriented Development (TrOD): Trails and Economic Development” 18 The train is essentially 19th century technology dressed up with more modern (but still noisy and polluting) diesel engines. There are 40 grade crossings which will need to accommodate 60 trains per day (see p.ix of PRFS), which will further stall already badly clogged auxiliary roads. 19 A multi-‐modal transportation corridor can take advantage of new and emerging technologies: electric bicycles, new battery technologies, solar powered bike paths, electric powered jitneys, etc. These technologies in combination with new emerging transportation technologies (digitized smart buses, electronic carpooling, transportation services like Uber and Lyft, and even electric and clean gas driverless cars where passengers can spend time on non-‐ driving activities) could optimize Highway 1 and auxiliary roads and reduce traffic congestion. See http://cleantechnica.com/2015/05/29/dutch-‐solar-‐bike-‐path-‐pleases-‐many/ 20 Scenario G1 capital & construction costs $176M (see p. x of PRFS). It should be noted that rail transit projects typically cost about 40 to 50 percent more than projected, with some projects costing double the original projections and very few costing less than 20 percent more than the projections. Source: Dept of Transportation reports summarized on http://ti.org/antiplanner/?p=10036 21 Source: Monterey Bay Sanctuary Scenic Trail (MBSST) according to the MBSST Network Master Plan, February 2014; estimates are based on total costs minus rail infrastructure not needed for a trail only implementation. 22 Source: p.x of PRFS for Scenario G1
- 4. 23 Source: p. 7-‐16 of MBSST Master Plan “The estimated annual cost for maintenance of the MBSST Network as described in Table 7.1 will be approximately $6,000-‐$10,000 per mile per year.” Max: $320,000 per year 24 Costs for auto parking infrastructure, to acquire adjacent properties/easements along railway to allow for width accommodation in narrow areas, and to implement “Quiet Zones” are not included in the Study or the above costs. Nor is inflation. 25 Sources of funding for capital and O&M costs are tenuous, may be unreliable (e.g. state and federal grants). See p.xi of PRFS. Rail project implementation predicated on successful passage of 1/2 cent County-‐wide sales tax measure in November 2016. However, of approximately $15M -‐ $17M per year to be generated IF the 1/2 cent sales tax measure is passed, current projections show $86M over 30 years being available for rail subsidies, which is approximately $3M per year, well short of the needed subsidy of $12M per year (which is the $14M annual O&M cost minus 15% in revenues, aka “farebox recovery rate” expected from ticket sales). For more on farebox recovery rates see pgs 111-‐112 of PRFS. 26 Most capital costs are projected to be sourced from federal and state grants. Only 25% of the annual Operating and Maintenance costs (at best) are funded, and that is ONLY IF the 1/2 cent sales tax is passed in 2016. If more of those funds are used to subsidize rail, it will crowd out funds expected to be available for road maintenance, pedestrian improvements, buses, bike paths, senior transportation and other public transportation priorities. 27 Approximately 8 miles of the 32 mile trail already have funds available or committed, and are on a timeline to be built in the next 2 -‐ 3 years. There are also public, non-‐profit and private donors that have indicated interest in the project. The amount to be raised is manageable given the funding already sourced and the indications of interest from multiple parties and sectors. 28 When combining the current estimated capital costs with the 30 years of operation and maintenance costs, this is the percentage that a transportation corridor without rail would cost vs. implementing passenger rail.