
Recomendados
Recomendados
Más contenido relacionado
La actualidad más candente
La actualidad más candente (20)
Similar a The Economic Impact of Child Care in San Mateo County - Key Findings
Similar a The Economic Impact of Child Care in San Mateo County - Key Findings (20)
Último
Último (20)
The Economic Impact of Child Care in San Mateo County - Key Findings
- 1. THE ECONOMIC IMPACT OF CHILD CARE IN SAN MATEO COUNTY KEY FINDINGS Size • 1,012 licensed child care establishments (255 centers and 757 family child care homes) care for about 20,700 children in San Mateo County. • Licensed child care is a $109 million industry in San Mateo County. Centers account for $80 million in gross receipts and family child care homes account for $29 million. • Parent fees account for more than 80% of the gross receipts of the licensed child care industry. Employment • Licensed child care establishments directly employ 3,294 people, about eight-tenths of one percent of civilian employment in San Mateo County, and also create 2,442 jobs in other industries (“indirect” jobs) in the county. • Statewide, direct child care employment is comparable in size to motion pictures and air transportation. • For every $1 million that consumers spend on licensed child care operations in San Mateo County over a one-year period, more than 52 jobs are created, including 22 indirect jobs in other local industries, such as business services, retail trade, and wholesale trade. In contrast, informal, unlicensed care appears to have little, if any, effect on indirect jobs. • Virtually all jobs supported by the total dollars spent, or final demand, for child care remain in the local community in contrast with other local industries that are more global. • A capital investment of $1 million for the construction of child care facilities creates 23 jobs for one year, including more than nine in the construction industry itself. • Average wages in the child care industry are less than $15,000 annually and are in the bottom tenth percentile of occupational wages. The average wages of child care direct and indirect employment in San Mateo County amount to about $19,770—more than the average wages of child care direct employment. Recent Expansion, Current Shortages, and Projected Future Child Care Needs • A partner in San Mateo County’s economic growth, the county’s licensed child care industry has accomplished significant expansion, growing its workforce by 67% between 1987 and 1996, compared with overall civilian employment growth of 10% and service sector growth of 28%. • As of 1994, 54% of San Mateo County’s income-eligible children of working parents were enrolled in subsidized child care and development programs, in contrast with an enrollment rate of 81% in the City and County of San Francisco. Subsidized waiting lists in San Mateo County have been growing steadily since 1993. • The industry may have already realized much of the expansion that is feasible within the constraints of the county’s existing land use, public finance and local development framework. This is indicated by chronic, consumer-identified shortages in infant care, - - 1
- 2. subsidized care, and affordable care for families with incomes above subsidy eligibility levels but below the local area median income. • The county’s population growth rate has been at about 0.9% annually since 1990 and is projected to continue to grow at an annual rate of 1.1% between 1996 and 2000. • Birth rates in San Mateo County have been holding steady at a crude rate of about 10,000 annually, although the percentage of Medi-Cal eligible births has been growing rapidly. • If local trends correspond to national trends, continued increases in labor force participation rates of San Mateo County women would also contribute to an increase the number of children needing child care. However, the San Mateo County labor force has been growing more slowly overall than the Bay Area’s, the state’s or the nation’s. • The implementation of welfare reform will increase child care needs, particularly for subsidized care. • Job growth in the lower-paying service sector and in the transportation sector will increase the need for subsidized and affordable child care supply and child care supply that suits work schedules other than 8 a.m. to 6 p.m. Local Constraints on Licensed Child Care Growth in San Mateo County • Effective demand that translates into new child care supply continues to be weakened by San Mateo County’s escalating housing costs, as rent and mortgage payments consume a disproportionate share of the household income of low- and moderate-income families. • The county’s high cost of housing has the greatest impact on the child care purchasing power of residents in jobs paying the county’s average wage of $19.50/hour and below. Yet these jobs will account for much of San Mateo County’s future job growth. • The county’s low real estate vacancy rates and high land and development costs threaten the retention of existing licensed supply and create barriers to the continued growth of the industry. Growing enrollment and class-size reduction in the public elementary schools is requiring local School Districts to dedicate all available space to regular classrooms and is reducing their role in addressing the facilities needs of the child care industry. • The county’s strong job growth in other, better-paying industries makes it difficult for existing establishments to retain qualified child care workers or recruit new ones for expansion. • Child care workforce retention and growth are also threatened by the increasing gulf between the low wages of the child care industry and San Mateo’s housing market. Yet child care wages are not high enough in general to induce long commutes from more affordable housing markets outside the county, where comparable child care work is also readily available. Economic Benefits of Local Investment in Licensed Child Care Supply-Building • Licensed child care is a more stable support for parental employment than informal care and increases worker productivity. • Like transportation policies and investments that relieve traffic congestion, local policies and investments that support licensed child care supply-building affect the productivity of all of the county’s industries and increase the county’s economic competitiveness. - - 2
- 3. • Shortages of infant care, care during nontraditional hours, and care that is affordable by lower-wage workers probably contribute to San Mateo County’s slow labor force growth rate, which has been identified as one of the county’s greatest barriers to continued economic growth. • Like land use policies and capital investments to increase affordable housing production, local policies and investments that support child care supply-building enable the county to supply a skilled, local labor force at wage rates that are competitive with other counties. Such policies and investments would help the county to retain and continue to attract high-value-added industries. • Appropriately targeted investments in child care supply-building would contribute to labor force participation gains among lower-income, moderate-income, and middle- income families in San Mateo County. Such gains would directly increase output, personal income, business formation, and property and sales tax revenues in the county. • The child care industry captures more than $22 million in federal and state child care subsidies for low-income working households in San Mateo. Federal and state expenditures for child care are growing but are still well below the amount needed to serve all eligible families. • Federal and state child care subsidies are, for the most part, not individual entitlements or county or city block grants. Supportive local policies and investments are necessary to help San Mateo County capture a larger share of these much-needed transfer payments for child care. • When San Mateo County residents use tax-complying—typically licensed—child care establishments, the county gains additional federal and state transfer payments for child care in the form of state and federal tax credits and deductions for child care expenditures. • Investments in high-quality, licensed child care reduce local public sector expenditures in other categories. One national study, which followed children for over 25 years, found that each dollar spent on high-quality preschool programs saved $7 in future spending on criminal justice, welfare, and other social programs. Other studies show that licensed child care is often of higher quality than unlicensed care, and thus can be expected to produce more public sector savings. - - 3
- 4. TABLE OF CONTENTS GLOSSARY ................................................................................................ i I. INTRODUCTION ....................................................................................1 II. THE ECONOMY OF SAN MATEO COUNTY ....................................6 Employment and Industry........................................................6 Demographics ..........................................................................8 Implications for Child Care .....................................................9 III. THE ECONOMIC IMPACT OF THE CHILD CARE INDUSTRY ..11 Accounting for the Child Care Industry ................................11 Measuring Output or Gross Receipts.....................................12 Direct Employment................................................................15 Indirect Employment .............................................................19 Multiplier Effects of Child Care Capital Investment.............22 Local vs. Global Integration of Child Care............................23 Wages and Other Occupational Characteristics.....................23 IV. RECENT EXPANSION IN THE CHILD CARE INDUSTRY, CURRENT SUPPLY SHORTAGES, AND FUTURE NEEDS................25 Child Care Expansion in the Last Decade..............................25 Current Shortages of Supply in the County............................27 Projected Growth in Child Care Needs ..................................31 V. CHILD CARE AND LOCAL ECONOMIC DEVELOPMENT .........40 The Impact of Licensed Child Care on Productivity and Economic Competitiveness....................................................40 Labor Force Participation Effects of Child Care Supply.......43 Capture of Federal and State Subsidies .................................46 Federal and State Tax Credits and Deductions for Child Care ........................................................................................52 Avoided Public Sector Costs in the Context of Devolution ..53 FIGURES 1. April 1997 California Child Care and Other Industry Employment...............................................................................18 - - 4
- 5. 2. Direct and Indirect Employment Created by Child Care Final Demand in San Mateo County...................................................20 3. Indirect Employment Created by Different Child Care Categories ..................................................................................21 4. Direct and Indirect Employment from $1 Million in Child Care Facilities Construction.......................................................22 5. Growth in Child Care, Civilian Employment in San Mateo County........................................................................................26 6. Child Care and Other Industry Growth in San Mateo County, 1988-1995 ..................................................................................27 7. Labor Force Participation Rates ................................................32 8. Young Women's Labor Force Participation Rates.....................34 9. Wages Associated with Fastest Growing Jobs in California .....37 10. Distribution of Family Expenditures .........................................38 TABLES 1. Licensed Child Care Industry Employment in San Mateo County in 1997...........................................................................15 2. Child Care and Development Subsidies in San Mateo County .47 - - 5
- 6. APPENDICES A. STANDARD INDUSTRIAL CLASSIFICATION (SIC) STRUCTURE AND THE CHILD CARE INDUSTRY..............1 B. SAN MATEO COUNTY ECONOMY...................................................5 C. EMPLOYMENT MULTIPLIERS FOR CHILD CARE CENTERS, FAMILY CHILD CARE, AND BABYSITTING .......................8 D. EMPLOYMENT MULTIPLIERS AND CHILD CARE INDUSTRY GROSS RECEIPTS ...................................................................11 E. ESTIMATING CHILD CARE EMPLOYMENT, OUTPUT USING OTHER METHODS..................................................................12 F. WAGES AND OTHER OCCUPATIONAL CHARACTERISTICS....16 G. CONVERTING NOMINAL TO INFLATION-ADJUSTED DOLLARS .................................................................................23 H. LOCAL PROVIDERS GROSS RECEIPTS AND DIRECT EMPLOYMENT METHODOLOGY........................................25 I. ENROLLMENT IN SUBSIDIZED CARE ............................................31 FIGURES E.1. Federal Child Care Income Tax Credits ....................................13 E.2. U.S. Child Care Arrangements ..................................................14 F.1. U.S. Child Care Worker Wages.................................................17 F.2. Average Wages, All Jobs Created .............................................19 F.3. Tenure Among Selected Workers..............................................21 F.4. Benefits Provided to Workers in Child Care Centers in San Mateo and in Other Small Businesses Nationally .....................22 I.1. Correlation Between Number of Licensed Facilities and Enrollment Rates in Subsidized Care ........................................31 TABLES A.1. Child Care and SIC Categories ....................................................2 A.2. 1994 San Mateo County Child Care Industry Employee By SIC Code......................................................................................4 B.1. Ethnic Background of San Mateo County Residents in 1990 .....5 - - 6
- 7. B.2. Employment Summary for San Mateo County (1995) ................5 C.1. Child Care Industry Employment Multipliers .............................7 C.2. Typical Family Child Care Expenditures ....................................8 F.1. Average Child Care Industry Wages in San Mateo County, 1995............................................................................................18 G.1. Nominal U.S. Child Care Weekly Wages..................................23 G.2. CPI-U Index and Real Wages ....................................................24 - - 7
- 8. GLOSSARY Term Definition Example(s) Establishment Individual firm or business McDonalds, Bank of America selling products, services, or branch, family child care both home Standard Industrial U.S. Commerce Department SIC 8211 (Schools), SIC 37 Classification (SIC) system for measuring (Transportation Equipment) employment, industries, and output Industry Sector (1 digit SIC) Major aggregation of SIC 3 (Manufacturing), SIC 7, industries with similar 8 (Services) products and/or services Industry Major Group (2 digit Aggregation of 3 and/or 4 SIC 35 (Industrial SIC) digit SIC industries Machinery), SIC 83 (Social Services) Industry (3 and 4 digit SIC) Most detailed industry level SIC 3524 (Lawn and Garden Tractor Manufacturing), SIC 8351 (Child Day Care Services) Civilian Labor Force Working-aged population About 15.7 million in looking for work or working California Labor Force (also Work Civilian labor force divided by About 67 percent in U.S., Force) Participation Rate working-aged population California Civilian Employment Number of individuals About 14.7 million in working California Direct Employment Employment created by an Child care center workers and industry in that industry family child care providers in the child care industry Indirect Employment Employment created by an Construction employment due industry in related or to refurbishing a child care supporting industries through facility the purchase of goods and/or services Unemployment Rate Number of unemployed About 6.5 percent in divided by civilian labor force California in April, 1997 Output Total value of goods and/or At least $40 billion nationally services produced for child care industry Final Demand Purchases of final product in Purchases of child care, an industry category cheeseburgers Employment Multiplier Shows total jobs—direct and 52 jobs are created by $1 Effect indirect—created by $1 million of final demand in the million in final demand for an child care industry in San industry Mateo County. Inflation Change in general price level Consumer Price Index (CPI), shows price increases/decreases for most consumers Real dollars Dollars adjusted for the effects See Appendix G. of inflation Term Definition Example(s) - - 8
- 9. Deflator Allows nominal figures to be See Appendix G. expressed in real dollars Wage Hourly, weekly, or annual Averages $32,000 in pecuniary compensation California Job Quality Considers wages, benefits, and other characteristics, such as tenure, etc. Subsidy Capture Rate Percent of income-eligible In San Mateo County, 51% of children who actually receive the eligible 2-5 year olds are subsidized child care or early enrolled in subsidized State childhood education. Preschool, child care, or Head Start. In San Francisco, the rate is 81%. Licensed Child Care Child care programs in a An estimated 73% of children center or provider’s home in child care outside the which follow state regulations family in San Mateo County for staff to child ratios, are in licensed care. educational standards, program structure, and facilities. License-Exempt Child Care Child care which under state A family child care home with law does not require a license. only the provider’s children and children from one other family; a school-based extended day program. Unlicensed Non-Exempt Child care providers that A family child care home with Child Care operate without a required 7 children from 3 families and license and thereby avoid no license. regulation. Child Care Subsidies Financial assistance for child The California State care to families who meet Department of Education’s income and employment federally financed General eligibility requirements. Child Care Program provides Available for care received full-day child care for children from licensed centers and with employed parents with family child care homes and family income below 75% of certain license exempt the state median income. caregivers. - - 9
- 10. I. INTRODUCTION This report has two purposes: • To quantify the local economic effects of licensed child care in San Mateo County. • To assess how local policies and investments to support licensed child care supply-building would affect local economic development. “Child care” encompasses a range of services used to educate and nurture young children, while allowing parents to go to work or school. For purposes of this report, child care includes not only full-day care, but part-day child development programs (such as Head Start, State Pre-School, and other pre- schools) because they are part of the system of care that parents rely on during working hours. This report measures the overall economic effects of child care by the size of the industry (both output and employment), changes in these measures over time, global vs. local integration of the industry, and occupational characteristics. The report identifies some of the local constraints on the industry’s ability to develop adequate supply for several chronic, consumer-identified shortages. The report assesses child care’s impact on local economic development by examining its effect on local job creation and labor force participation, the county’s rate of capture of limited federal and state child care transfer payments, tax revenues, and local government expenditures in other categories. The report explores the differing effects of licensed and unlicensed child care on the local economy. Licensed establishments include most child care centers and many home-based providers, also known as family child care homes, which can be licensed to serve twelve (or fourteen) children1, six (or eight) 1 The California Health and Safety Code was recently amended to permit family child care homes licensed for twelve to serve an additional two school-aged children for a total maximum enrollment of fourteen. Homes licensed for six can also add two additional school-aged children - - 1
- 11. children, or four infant/toddlers. Licensed child care services are provided by nonprofit corporations, for-profit corporations, public agencies, and sole proprietors. Although the form of legal ownership may vary, all licensed child care establishments contend with the same business challenge: How to generate adequate revenues from parent fees (or transfer payments that substitute, in whole or in part, for parent fees) That are competitive with the formal—and informal—providers in the same market area For the maximum number and most desirable age mix of children Permitted in the available indoor and outdoor square footage of a licensable facility With just enough properly credentialed workers to meet minimum staff- child ratios for regulatory compliance and competitive quality. Unlicensed child care includes license-exempt care outside of the child’s home,2 for example, in the home of a relative, a neighbor, or a “babysitter” who may be caring for the children of one family in addition to her own. It also includes license-exempt care provided at the child’s home by, for example, nannies, babysitters, and relatives3. Specific kinds of centers (such as school- based extended day programs and certain recreation programs) are also exempt from licensing. Approximately 76 such centers care for several thousand children in San Mateo County. They are treated in this report as part of the county’s for a total of eight. If the home elects this increased enrollment, new restrictions limit the number of children under the age of two that can be cared for. 2 In San Mateo County, approximately 7,500 children between the ages of 0 and 13 with two parents in the workforce (or a single parent in the workforce) are in unlicensed (including license-exempt) care outside the home, while more than 20,000 are in licensed care outside the home. California Child Care Resource and Referral Network, The California Child Care Portfolio, 1997. 3 In San Mateo County, approximately 50,000 children between the ages of 0 and 13 with two parents in the workforce (or a single parent in the workforce) are not in care outside the home. In-home care can include a variety of paid and unpaid arrangements: a paid babysitter or nanny may come into the home, the parents may have arranged their work hours so that one parent is at home when the children are at home, an older sibling or other relative may care for the children, or the children, typically school-aged, may be in self-care (“latch-key”). California Child Care Resource and Referral Network, The California Child Care Portfolio, 1997. - - 2
- 12. licensed supply because of their similar operating, workforce, and financial requirements. In addition to license-exempt care, unlicensed child care includes care that, because of group size and other factors, is required to be licensed but is not. This report seeks to quantify some of the differing local economic effects of licensed establishments (including license-exempt centers) and unlicensed, informal care because several factors threaten the retention and growth of the licensed child care industry in San Mateo County. Most fundamentally, the licensed child care industry is affected by the reality that, in setting consumer fees, it must compete with the lower cost, in many cases lesser quality, unregulated individual caregivers who offer care both inside and outside the child’s home. Thus, the informal providers undermine the market feasibility of licensed establishments. In contrast with unregulated, informal caregivers, the licensed side of the industry, especially the center-based providers, must make capital investments in buildings and equipment and attract and retain educated, credentialed workers in order to stay in business. This industry-wide problem is compounded in San Mateo County because, as is discussed in the report, high housing costs constrain the ability of all consumers, but especially lower paid service workers, to allocate more household income to child care expenses. As housing expenses rise, consumers face pressure to seek out lower cost child care arrangements, even when their preference is for licensed care. Yet for every percentage gain in market share that is made by the unregulated, informal side of the industry because of these factors, it becomes even more difficult for the county’s licensed establishments to charge the fees that are necessary to comply with minimum quality standards. Exacerbating this problem, San Mateo County’s low real estate vacancy rates and high land and development costs make it difficult to develop (or even retain) the facilities required for licensed centers to operate. And its expensive housing market means that child care workers, both center employees and family child care operators, increasingly find it too costly to live in San Mateo County. - - 3
- 13. They may be driven either to leave the field for a higher paid occupation or to leave San Mateo County for a neighboring county with lower housing and living costs and comparable child care employment opportunities. The county’s explosive rate of job growth simply exacerbates the difficulty that the licensed child care industry faces in retaining qualified staff. This report explores some of the reasons why, without local intervention to address these barriers, the result may be the erosion of the existing supply of licensed establishments and the failure to develop new licensed supply adequate to meet current consumer-identified shortages, as well as new demand. San Mateo residents who would prefer stable, licensed child care may be forced to prolong their period of separation from the labor force following childbirth, reducing the local labor force at a time when its slow rate of growth has been identified as one of the greatest barriers to San Mateo County’s continued economic development. The alternative is for those consumers to rely on an unstable pool of relatives, babysitters, and other informal caregivers. But that pool is itself shrinking because of San Mateo County’s very low unemployment rate. Extensive research has shown that, even if available to parents, such informal care does not achieve the same positive child outcomes as quality, licensed care. Its instability affects the parent’s productivity and advancement in the workplace. Reliance on informal caregivers also impairs the county’s capture of expanding federal and state child care transfer payments, and increases county and city public sector expenditures in other areas. - - 4
- 14. II. THE ECONOMY OF SAN MATEO COUNTY Basic trends in the San Mateo County economy provide an important context for understanding the local child care industry because child care, in addition to its child development function, is an essential support for labor force participation and local economic development. This section examines the county’s overall economic structure, including employment, key industries, and demographics, and explores the implications of those trends for the child care industry. EMPLOYMENT AND INDUSTRY During the 1990s, San Mateo County has experienced steady economic growth, outpacing the U.S., California and the rest of the Bay Area.4 Its per capita income is 50% greater than the national per capita income, and second among Bay Area counties only to Marin.5 The countywide unemployment rate in April 1997 was just under 3 percent, about half the state average. In addition: • New job growth in San Mateo County is expected to greatly exceed the local labor market supply. 42,000 additional residents of San Mateo County will become employed between 1995 and 2015, while the county is projected to produce 87,400 new jobs during that period.6 • Redwood City is expected to account for 14 percent of the county’s projected new job growth between 1995 and 2014.7 • As the last remaining part of the county with significant development potential, extraordinary job growth is also expected in East Palo Alto8, 4 San Mateo County Economic Development Association (SAMCEDA), Economic Indicators and Outlook, San Mateo County, California, p. 13. 5 Id., p. 13. 6 Association of Bay Area Governments, Projections 96, p. 224. 7 Id., p. 224. 8 Id., p. 224. - - 5
- 15. now the site of the county’s highest unemployment rate, estimated in April 1997 at 7.3 percent.9 • The service sector provides the most jobs in San Mateo County (more than 100,000 in 1996),10 and continues to enjoy the fastest rate of growth of any sector. • Collectively, the transportation sector and the business services industry will account for 46% of San Mateo County’s new job demand11. • Employment associated with San Francisco International Airport contributes to the important role of the county’s transportation sector, which was relatively unaffected by the economic downturn of the first half of the decade and should continue to be a steadying influence even when economic growth in other categories slows.12 • Available jobs are holding steady in the high wage, high technology industries, but the productivity gains in that sector have not been accompanied by comparable job creation gains.13 • Strong economic growth is triggering an undersupply of commercial, office and residential real estate.14 • Housing costs in San Mateo County are among the highest in the country, apartment vacancy rates are under 2%, and rental rates increased by 20% in the first six months of 1996.15 9 Economic Development Department (http://www.calmis.cahwnet.gov) 10 Note that ABAG, p. 23, estimates the 1995 employment in the service sector at more than 100,000, not including business services, which it estimates at more than 35,000. However, SAMCEDA estimates service sector employment at about 111,000 in 199y including 14,000 in business services. SAMCEDA, p. 23. This discrepancy may arise from differences in accounting for business services, which represents an amalgam of local activities that support basic industries in the county, for example, legal services, printing and publishing, accounting, etc. 11 ABAG, p. 224. 12 ABAG, p. 224. 13 ABAG, p. 1. Although the comment is made with reference to the Bay Area in general, the specific forecast of available jobs in high technology in San Mateo County at p. 223 does not show significant additional job creation. 14 SAMCEDA, p. 24. - - 6
- 16. Table B.2, in Appendix B, contains employment information for all industries in the county from 1995. DEMOGRAPHICS San Mateo County demographic characteristics have significant implications for projecting future demand for child care: • Between 1990 and 1995, San Mateo County’s population grew from 649,623 to 696,450, and it is expected to grow by the end of the decade to a total population of 727,300.16 Although the county’s rate of growth slowed during the economic downturn, for the entire decade it is expected to be close to the national rate of growth, at about 0.9% annually.17 • Although the California Department of Finance has projected a decline in birth rates in San Mateo County, local Health Department statistics show that the birth rate has been holding steady at about 10,000 births annually for several years. • Population growth is also affected by total net migration which is now positive for San Mateo County, in contrast with recent years where negative domestic migration (people leaving the county for other counties in the U.S. in excess of those entering it) outstripped net foreign migration (people entering the county from other countries in excess of those leaving the county for other countries). • Household size is also continuing to increase, growing from 2.64 persons for household in 1990 to a projected 2.79 in 2000.18 • Mean, or average, household income in San Mateo County is $77,800,19 among the highest in the state, but it masks an increasing disparity of 15 SAMCEDA, p. 26 and 27. 16 ABAG, p. 234. 17 SAMCEDA, p. 16. 18 ABAG, p. 225. 19 ABAG, p. 223. - - 7
- 17. income attributable to the county’s dual labor market. As of 1996, the local median household income was $61,300.20 • Although the county’s poverty rate in 1990 was lower than the state average, the number of Medi-Cal eligible births since then has been growing at a faster rate than in any other Bay Area county or the state. • Implementation of K-3 class-size reduction in the public schools, as well as continued modest growth in the school-aged population, is reducing the ability of School Districts to make excess space available to the child care industry. IMPLICATIONS FOR CHILD CARE The child care industry in San Mateo County is affected by the county’s basic economic and demographic characteristics in several ways: • Strong job growth, low unemployment, net positive migration to the county, steady birth rates, and increasing household size will fuel continued growth in demand for child care services in the county. • The licensed child care industry’s ability to meet this demand is threatened by the extraordinarily high land and development costs and very low vacancies in commercial, office and residential properties, which make it difficult to develop new facilities or to retain and expand existing ones. • The stability and continued growth of the licensed child care industry is also threatened by the county’s high cost of housing, which makes it difficult for low-wage workers, such as child care center employees and self-employed family child care providers, to live in San Mateo County. Child care workers are unlikely to commute long distances to work in the county’s child care establishments because comparable employment 20 http://www.huduser.org/data/asthse/fmrdata/allstate/txt - - 8
- 18. is readily available in neighboring counties with lower housing and other living costs. • San Mateo County’s slow labor force growth rate and its well-paying advanced technology industries result in higher average wages than the state or the Bay Area generally. But the cost of child care in San Mateo County is among the highest in the state. The county will need to expand its supply of affordable child care in order to grow an adequate supply of labor, especially for those earning less than the county’s average hourly wage of $19.50. This workforce is essential for the supply of all of the community’s needed goods and services. • Continued increases in housing costs, especially in the rental housing market, will continue to shrink the portion of the family income available to pay for child care and will increase the need for affordable child care supply. • Implementation of time limits on income maintenance for low-income families under the federal Temporary Assistance for Needy Families program will also contribute to the need for more subsidized child care. • The county’s strong transportation sector, as well as the service sector, may contribute to a greater demand for child care during hours outside the traditional 8 a.m. to 6 p.m. child care schedule. - - 9
- 19. III. THE ECONOMIC IMPACT OF THE CHILD CARE INDUSTRY This section assesses the economic impact of the child care industry in San Mateo County. After explaining some of the difficulties in applying traditional economic accounting tools to the industry, it measures the overall effects of child care in the local economy and compares the economic impact of child care with other local industries, taking into account: • The size of the industry, as reflected in output or gross receipts. • The size of the industry, as reflected in direct21 employment. • The size of the industry and the extent of its local economic integration, as reflected in indirect22 employment. • The degree of global integration of the industry. • Occupational characteristics, such as average wages. ACCOUNTING FOR THE CHILD CARE INDUSTRY Economists typically analyze industries and their impacts based on a set of definitions and tools developed by the U.S. Department of Commerce (DOC). The DOC monitors economic activity through its Standard Industrial Classification (SIC) system, which assigns three- and four-digit codes to industries with similar products or services and then aggregates these industries into industry major groups (two-digit SIC) and sectors (one-digit SIC). Economists also utilize survey results developed by the U.S. Department of Labor (DOL) and other sources. The DOL approach is similar to the DOC 21Direct employment refers to that supported by and included in the child care industry itself (e.g., child care workers, managers, etc.). 22Indirect employment refers to that generated by the child care industry in supporting and related industries through child care industry purchases of goods and services. These might include construction employment due to refurbishing a child care facility, agricultural - - 10
- 20. approach, albeit with a focus on employment and wages, rather than gross receipts or output. The survey and identification methods that underly these traditional economic accounting tools undercount the licensed child care industry in several ways, discussed in Appendix A. However, in San Mateo County, the San Mateo Child Care Coordinating Council, Inc. (the “Council”), like other resource and referral agencies (R&Rs) in California, is funded by the state Department of Education to systematically track licensed child care inventory and market rates. Based on existing data bases, the R&R can estimate direct employment and gross receipts of the licensed child care industry in San Mateo. The local estimate of gross receipts and direct employment by the Council seems more reliable than the estimates generated by DOC or DOL data for several reasons. First, the locally generated figure was estimated by a local agency charged with maintaining a current data base of San Mateo County’s licensed child care inventory in order to provide referrals to child care consumers. Second, unlike the DOC or DOL approach, it is based on a methodology that applies state-mandated minimum staff-to-child requirements to estimated child care enrollment figures and thus represents minimum employment levels. Third, this local estimate is not limited by government survey methods regarding establishment size or independent contractor status. Finally, this locally generated figure stated as a percentage of civilian employment is consistent with similar locally derived employment estimates from three other California counties. MEASURING OUTPUT OR GROSS RECEIPTS Output or gross receipts measure the size of an industry in terms of the overall value of the goods and services produced by the industry. The Council recently identified approximately 1,012 licensed child care establishments (757 licensed family child care homes and 255 licensed centers) and an additional 76 employment due to food purchases made by the child care program, and gasoline due to field trips taken by child care program participants. - - 11
- 21. license-exempt centers that care for about 20,700 children in San Mateo County. Based simply on enrollment data and market rates of care, the agency estimated gross receipts in the licensed23 child care industry of $109,324,499, including $80,405,025 for child care centers and $28,924,474 for family child care homes.24 Another method of estimating industry output applies employment multipliers developed by the Bureau of Economic Analysis of the U.S. Department of Commerce (BEA). According to the BEA, each $1 million in licensed child care final demand creates 25.6 jobs in San Mateo County, including 14.7 direct jobs and about 10.9 jobs in other industries (indirect employment). Applying this employment multiplier of 25.6 to Department of Commerce employment estimates results in a child care industry output of $85.7 million.25 The BEA estimate of direct employment is more than 60% lower than the local direct employment estimate (1,259 vs. 3,294). As discussed in Appendix A, this can be attributed to the Department of Commerce’s accounting only for private licensed centers, excluding many other types of licensed child care establishments (for example, licensed family child care homes and publicly operated centers). Yet the Department of Commerce derived output is little more than 20% less than the locally derived estimate of gross receipts ($85.7 million vs. $109.3 million). This lack of proportionality may be attributable to several factors. First, the private licensed centers, the only ones counted in the BEA estimate, may produce greater output in proportion to direct employment than the excluded kinds of licensed establishments. Second, the local estimates of gross receipts are conservative because the only revenue that they count is parent fees 23 And license-exempt centers, which are included in the economic analysis of the licensed industry because of their similar workforce requirements, operating structure, and financial requirements. 24 This estimate is based on the number of children in care and the market rates of care. See Appendix H for an explanation of the methodology. 25This is expressed in 1994 dollars, which are worth about 7 percent less than 1997 dollars. The calculation is expressed as follows. O = E/M, where O is output (in millions), E is direct and indirect employment, and M is the employment multiplier. In this case, O=2,193 divided by 25.6. (See Appendix D for a discussion of employment, employment multipliers, and output.) - - 12
- 22. (or transfer payments that function like parent fees). For example, the county’s nonprofit centers and some licensed family child care homes capture more than $3 million in revenue from the Child Care Food Program. Schools and other local agencies supply some facilities at no-cost or below-market rents. And foundations, corporations, and others make charitable contributions to the nonprofit part of the industry as a supplement to revenues derived from parent fees and public sector transfer payments. If the Council’s direct employment estimate and its output estimate are correct, they would yield a direct employment multiplier of 30.26 When the BEA ratio of direct-to-indirect employment is applied to the local estimate of direct employment27, the child care direct and indirect employment multiplier increases from 25.6 to 52.4.28 When this multiplier is applied to the local direct employment estimates, child care output is approximately $109 million.29 This estimate is almost the same as the estimate of gross receipts derived by the Council based on the estimated number of children in licensed care and the market rates of care. Appendix E discusses other methods to estimate the industry’s output. This report relies on the locally derived direct employment and gross receipts estimates and concludes that the gross receipts of the licensed child care industry in San Mateo County are approximately $109 million. DIRECT EMPLOYMENT 26 The local direct employment estimate is 3,294 child care jobs created in a $109.3 million industry. Therefore, $1 million creates approximately 30.2 jobs (3,294÷109.3=30.2). 27 The BEA estimated ratio of direct to indirect employment is probably accurate, based on a comparison with the ratio of direct to indirect employment in similar service industries such as nursing and personal care. 28 The ratio of direct to indirect employment is 14.7:10.9, which can be expressed as .74. If direct employment is 30, then indirect employment is 30 x.74 or 22.3, and total employment is 52.4 (rounded). 29 O=E/M, therefore O=5,783/52.9=109.3 million. - - 13
- 23. Direct employment in the San Mateo County licensed child care industry is assessed below, with the results summarized in Table 1, using three approaches: • Data generated by the Council. • Estimates based on SIC categories described in Appendix A. • Estimates based on U.S. Department of Labor surveys. TABLE 1 LICENSED CHILD CARE EMPLOYMENT IN SAN MATEO COUNTY, 1997 Approach Estimated direct employment Locally Generated by the Council 3,294 DOC 1,259 DOL 1,619 Sources: Bureau of Economic Analysis, Department of Labor (ES-202 data), San Mateo County Child Care Coordinating Council. As discussed in Appendix A, the latter two accounting methods seem to omit a significant share of the licensed child care industry. While presenting DOC and DOL estimates for comparative purposes, this report relies on the local estimate developed by the San Mateo County Child Care Coordinating Council. Of course, even the local estimate understates total child care economic activity in the county because it counts only formal child care establishments and excludes informal, individual caregivers. In particular, it excludes unlicensed care provided outside the child’s home, estimated at more than 27 percent of care provided outside the child’s home in San Mateo County30, as well as paid care provided in the child’s home. Local Estimates of Direct Employment 30As discussed above, this is based on the number of children in care outside the home and the number in licensed facilities. California Child Care Resource and Referral Network, The California Child Care Portfolio, January 1997. - - 14
- 24. Direct employment in 1997 in the licensed San Mateo County child care industry and license-exempt centers totals 3,294, according to a recent estimate by the San Mateo County Child Care Coordinating Council. This figure is derived from the actual child care inventory and the number of children in different types of care, assuming compliance with minimum staffing requirements imposed by licensing laws for different age groups. In fact, the actual direct employment count is probably higher for two reasons: 1. It is an extremely difficult management task for child care centers to keep their doors legally open while employing only the exact minimum number of employees required by licensing, given changing scenarios in the number and age mix of children actually enrolled from time to time and also given the high rate of turnover in the child care workforce arising from low wages. 2. Because of facilities constraints and educational program elements, the provider may elect to employ more than the regulatory minimum number of employees in order to achieve specific quality goals that help make the business more competitive in the long-term. The Council’s estimate of direct employment in the licensed child care industry represents about eight-tenths of one percent of civilian employment in the county and does not include unlicensed care.31 This ratio of child care employment to civilian employment is comparable to those derived by similar means in three other California counties. SIC Estimates of Direct Employment 31The approach assumed 533 employees in 533 family child care homes licensed for six children, 448 employees in 224 family child care homes licensed for 12 children, and 2,313 employees at child care centers. See Appendix H for a complete explanation of the methodology. - - 15
- 25. The second approach, based on the SIC method discussed in Appendix A, estimates 1,081child care jobs in 1994.32 Because employment overall in San Mateo County rose 5.2% between 1994 and 1997, and the child care share of civilian employment increased 10.7%, this method would yield an estimated number of child care jobs today of 1,259.33 Estimates of Direct Employment Based on U.S. Department of Labor Surveys A 1995 U.S. Department of Labor survey indicated a total of 207 child care establishments with 1,493 employees in San Mateo County—a figure well below that developed locally by the Council. Because employment overall in San Mateo County rose between 1995 and 1997 by 5% and the child care share of civilian employment increased by 3.3%, this method yields an estimated number of jobs today of 1,619. As noted in Appendix A, the DOL method appears to understate child care employment because it excludes a variety of licensed establishments. Direct Employment Compared with Other Industries San Mateo County Licensed child care (an industry or four-digit SIC category) is, of course, small compared with many sectors (one-digit SIC categories) and major industry groups (two-digit SIC categories) in San Mateo County. The San Mateo County service sector, for example, where the child care industry is grouped, accounts for more than 100,000 employees, including more than 14,000 in Business Services, a major industry group.34 On the other hand, child care employment in the county 321994 data are reported initially since the latest available BEA statistics reflect 1994 industry employment and output. 33In short, this higher figure represents employment that has more than recovered from the 1991-1994 recession. 34 SAMCEDA, P. 38. - - 16
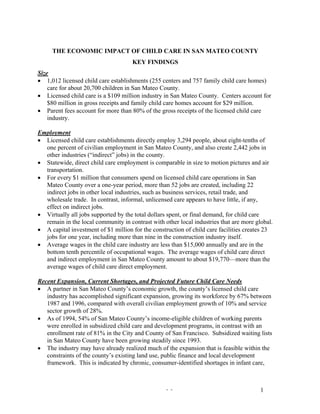
- 26. is comparable in size to at least one major industry cluster in the county, Biotech (a group of three three-digit SIC categories), with 4,200 employees.35 California In California, direct employment in licensed child care36 (a four-digit SIC category) is comparable in size to a number of other two-digit industry groupings, including motion pictures (SIC code 78) and air transportation (SIC code 45), as shown in Figure 1. The largest three-digit SIC industry, electronic components (SIC code 367) is only slightly larger than child care. Child care employment is larger in size than a number of other three-digit industries, such as computer and office equipment manufacturing (SIC code 357), personal services (SIC code 72, which includes dry cleaning and laundry services, beauty and barber shops, funeral services, and tax preparation services) and legal services (SIC code 81 or 810). However, in the state as in San Mateo County, licensed child care is small compared to the largest industry grouping in the service sector, business services (SIC code 73). Figure 1 35 SAMCEDA, p. 47. - - 17
- 27. APRIL 1997 CA. CHILD CARE AND OTHER INDUSTRY EMPLOYMENT 160 140 120 100 80 60 40 20 0 Electronic Movie Air Child Care Personal Legal Services Computer & Components Production Transport. Services Office Source: Labor Market Information Division, Equipment Employment Development Department (http://www.calmis.cahwnet.gov/) Note: Child care is estimated by Economics Online. INDIRECT EMPLOYMENT The licensed child care industry, like most industries, generates indirect employment in supporting and related industries through its purchases of goods and services. Affected industries include, for example, business services due to business accounting, tax compliance and audits; agriculture due to food purchases made by the child care program; and gasoline due to home-to-school transportation provided by some programs (e.g., Head Start) or field trips taken by child care program participants. All jobs created by final demand in an industry—generally called employment multiplier effects—are expressed as the number of jobs created per $1 million of final demand for an industry or commodity. As discussed above with reference to the estimate of gross receipts, the Bureau of Economic Analysis of the U.S. Commerce Department has estimated 36 The Bureau of Labor Statistics estimates child care employment nationally as a percentage of civilian employment. Economics Online estimated California child care - - 18
- 28. the number of direct and indirect jobs created by child care in San Mateo County (Figure 2). Applying the BEA ratio of direct and indirect jobs created (14.7:10.9) to the local estimates of direct employment (3,294), $1 million of child care final demand creates approximately 52 jobs, including about 30 direct jobs in child care establishments and 22 indirect jobs. Of these indirect jobs, 8.5 (16 percent) are in a broad range of industry groups, including transportation, health services, and eating and drinking places, slightly more than three (six percent) are in miscellaneous services, and an additional six percent are in business services. FIGURE 2 DIRECT AND INDIRECT EMPLOYMENT CREATED BY CHILD CARE FINAL DEMAND IN SAN MATEO COUNTY Other 16% Financial i i i 2% Health services 2% Transport. 3% Eating and drinking places 3% Retail trade Child care (direct) 4% 58% Business services 6% Misc. services 6% Source: Employment Development Department (http://www.calmis.calwnet.gov) In conclusion, based on locally generated direct job estimates of 3,294 and the BEA ratio of direct to indirect jobs in child care and similar service industries, 2,442 indirect jobs (3,294 x 10.9/14.7) are created by San Mateo County’s licensed child care industry, for a total of 5,736 direct and indirect jobs. employment by applying this national percentage to civilian employment in California. - - 19
- 29. Indirect employment figures and program budgets can be used to compare the local economic impact of licensed versus unlicensed child care. (See Appendix C for a detailed breakdown of the expenditures and the distribution of jobs created by these categories.) As expected, licensed programs are much more integrated into the economy and support indirect employment in a variety of ways not supported by unlicensed and other informal child care activities, such as babysitting. Licensed providers make local purchases of goods and services in order to provide formal, licensed care of good quality, including, for example, salaries to achieve minimum teacher-pupil ratios, purchases of goods and services necessary to ensure adequate marketing, tax and business compliance, financial monitoring or staff development, and purchases of goods and supplies that promote child development and health and safety. In contrast, unlicensed providers, such as babysitters and nannies, appear to create little, if any, indirect employment, based on their business expenditures and operational structure. MULTIPLIER EFFECTS OF CHILD CARE CAPITAL INVESTMENTS The analysis of the local economic impact of $1 million of licensed child care final demand considers only the effects of licensed child care operations and excludes any economic effects from the construction of facilities. The construction of licensed child care facilities also provides substantial local economic impacts.37 A one-time investment of $1 million for the construction of child care facilities creates 23 jobs for one year, including more than nine in the construction industry itself (Figure 4). 37 These benefits are not limited to child care, but accrue to any industry with construction expenditures. - - 20
- 30. + FIGURE 3 DIRECT AND INDIRECT EMPLOYMENT FROM $1 MILLION IN CHILD CARE FACILITIES CONSTRUCTION 10 9 8 Employment supported by $1 million in 7 construction final demand 6 5 4 3 2 1 0 Construction Business Retail trade Eating and Miscellaneous Wholesale Other services drinking services trade places Source: Bureau of Economic Analysis Each $1 million investment in a child care facility also creates more than two jobs in business services and retail trade, about one job in eating and drinking places and miscellaneous services, slightly less than one job in wholesale trade and five jobs in other industries. These figures may, in fact, understate the variety of economic effects of child care facilities construction since these specialized facilities must conform to a number of safety, health and other guidelines, and thus may involve categories of expenditures not found in typical commercial or office construction. LOCAL VS. GLOBAL INTEGRATION OF CHILD CARE As the San Mateo County economy becomes more integrated into the global marketplace, a smaller share of the total jobs created by local industries will remain in the local area. For example, an increase of $1 million in final demand for electronic equipment manufacturing creates up to 19 jobs overall. - - 21
- 31. However, no more than two-thirds of these jobs are added in the San Mateo County region because at least one-third are outside the United States. An equivalent increase in child care final demand adds approximately 52 jobs, with virtually all jobs in the local economy. See Appendix J for a comparison of the global vs. local integration of child care as compared with other industries. WAGES AND OTHER OCCUPATIONAL CHARACTERISTICS Average wages in the child care industry, as well as other important employment-related characteristics such as tenure, benefits, and full-time versus part-time status, typically have ranked low in comparison with other industries. This is as true in San Mateo County as elsewhere. As discussed in Appendix F, the average wage of direct employment in San Mateo County licensed child care establishments is about $14,850, which is eight percent higher than the industry’s statewide average of $13,768 annually38, but is still in the bottom tenth percentile of occupational wages. A broader quantitative measure of the wage contribution of any industry is the average wage of all jobs created by that industry—both direct and indirect— weighted by direct and indirect employment. According to recent wage data from the Employment Development Department and the Bureau of Economic Analysis, the average wage of all jobs created by the ten-county Bay Area child care industry in 1994 was about $19,770, significantly higher than direct child care wages but still less near the bottom when compared with average wages across other industries. However, this average wage is comparable to many other service-oriented industries that are growing rapidly. (See Figure F.2 in Appendix F). For example, child care created average wages are comparable to hotel, physical fitness center, and beauty shop wages. 38 Bureau of Labor Statistics ES-202 Survey. - - 22
- 32. There are some positive aspects to the industry’s occupational characteristics. As discussed in Appendix F, child care industry wages statewide have kept pace with inflation since 1987. This is superior to many other service industries, where wages have fallen statewide at about one percent annually, when adjusted for inflation. Moreover, as child care demand increases, child care wages may continue to increase. - - 23
- 33. IV. RECENT EXPANSION IN THE CHILD CARE INDUSTRY, CURRENT SUPPLY SHORTAGES, AND FUTURE NEEDS The San Mateo County economy recovered more quickly and more vigorously from the economic downturn of 1993 and 1994 than other Bay Area counties, generating significant expansion in the child care industry in the last ten years, as measured by changes in local child care employment. Despite the industry’s expansion, significant shortages in certain kinds of licensed supply still exist, especially in infant care, subsidized care, affordable care for households earning more than the income limit for subsidized care but less than the local median household income, and care outside traditional hours between 8 a.m. and 6 p.m. And, as discussed below, a number of factors will lead to increasing child care needs in the county, especially in the types of care that are already in short supply. CHILD CARE EXPANSION IN THE LAST DECADE Fueled by--and an essential partner in--San Mateo County’s exceptional economic growth, the county’s licensed child care industry has accomplished significant expansion over the last decade. According to the Employment Development Department, civilian employment in San Mateo County grew by about ten percent from 1987 to 1996 (Figure 5). During the same period, child care employment grew an estimated 67 percent, or by about six percent annually.39 39Local figures are based on applying child care industry share of civilian employment at the national level to local civilian employment. Child care became a larger share of the total employment picture from 1987 to 1996. - - 24
- 34. FIGURE 5 GROWTH IN CHILD CARE, CIVILIAN EMPLOYMENT IN SAN MATEO COUNTY 180 160 Child care 140 Civilian employment 120 100 Index (1987=100) 80 60 40 20 0 1987 1988 1989 1990 1991 1992 1993 1994 1995 1996 Source: Economics Online, based on Bureau of Labor Statistics (http://www.stats.bls.gov) and Employment Development Department (http://www.calmis.cahwnet.gov) data. Child care employment in San Mateo County expanded at a faster rate than any reported major industry (two-digit SIC) or sector (one-digit SIC) between 1988 and 199540 (Figure 6). Services, the fastest growing sector and the one in which child care is located, grew by 28 percent. Trucking and warehousing, a major industry, expanded almost as fast as child care. 40 Detailed employment data for other industries is not available for 1987 or 1996. - - 25
- 35. FIGURE 6 CHILD CARE AND OTHER INDUSTRY GROWTH IN SAN MATEO COUNTY, 1988-1995 60% 50% Increase in employment, 1988-1995 40% 30% 20% 10% 0% Child care Trucking & Engineering Paper, State Amusement, Private Other Wholesale Warehousing & Mgmt. Printing & Government Including Educational Services Trade Source: Employment Development Department data Publishing Movies Services http://www.calmis.cahwnet.gov/ Given the regulated nature of the industry, with specific facilities and trained workforce requirements that must be satisfied by the provider on a daily basis, and the dampening effect of informal caregivers on market rates, the extent of the expansion that has been accomplished is impressive. Serious shortages still exist, however, in infant care, subsidized care, and care that is affordable for the many lower wage San Mateo households who earn more than the state and federal income guidelines for subsidized care but less than the local area median household income. The severe and chronic nature of these shortages may indicate that the industry may have reached a limit in its ability to expand within the existing land use, public capital, and local development constraints of San Mateo County. Significant local intervention may be needed to help the industry overcome systemic barriers to expansion of the types of care that are in chronically short supply in San Mateo County. - - 26
- 36. CURRENT SHORTAGES OF SUPPLY IN THE COUNTY The San Mateo County Child Care Coordinating Council, Inc. maintains a database of available child care and provides referrals to consumers seeking care. The agency also manages a centralized waiting list for all subsidized care in the county, eliminating the need for parents to place themselves on multiple waiting lists. As a result of these and other responsibilities, the agency is able to present a reliable picture of the specific kinds of licensed child care actually being sought by consumers41 that are in short supply. Infant care is one of the greatest child care needs in the county, and the shortage affects all income groups. In 1994, it was estimated that there were 4,000 infants in need of care in the county, and fewer than 1,666 licensed spaces (669 full-time spaces and 125 part-time spaces in centers and approximately 500 spaces in family child care homes).42 That year, the Council recorded that over 64% of the agency’s telephone requests for referrals were from parents seeking to return to the labor force before their child was one year old. Subsidized care is also in short supply in the county, especially subsidized care for infants. In 1993, there were 6,499 children on waiting lists for subsidized care in San Mateo County, up from 5,640 in 1991. One thousand two hundred ninety four (1,294) of the children on waiting lists for subsidized care were infants, but there are only 170 full-time and 68 part-time subsidized spaces available for infants.43 Because of the county’s higher wages, waiting lists for subsidized care do not reflect the full scope of the shortage of affordable child care supply in San Mateo County. Income-eligibility for subsidized child care is capped either at 84% of the state median income (for certain state-subsidized child care 41 Not all consumers prefer licensed care. Therefore the shortage in supply cannot be measured simply by the difference between licensed slots and the number of young children or school-aged children of parents in the workforce. 42 Child Care Coordinating Council of San Mateo County, Child Care Update—1993- 1994: A Needs Assessment for San Mateo County, p. 4. 43 Id., p. 5. - - 27
- 37. administered by the California Department of Education), at 75% of the state median income (for certain federally-subsidized child care administered by the California Department of Education), at 60% of the state median income (for State Pre-School), or at the federal poverty rate (for Head Start). But 1996 median household income in San Mateo County ($61,300) is well above the state median household income ($48,400),44 and compared to the state, the county enjoys a relative wage advantage even in very low paid occupations, such as child care workers.45 The wages earned by many service, retail, transportation, and clerical and administrative workers in San Mateo County are higher than the wages earned in these same occupations in much of the rest of the state. As a result, San Mateo County workers often find themselves above the income eligibility guidelines for subsidized child care and development programs. But the San Mateo wage advantage that makes these households ineligible for subsidized care falls far short of what is needed to make up for San Mateo’s higher costs. The average cost of licensed child care in San Mateo County, for example, is less than the cost of care in only two other California counties.46 Some San Mateo County examples help to illustrate how federal and state child care transfer payment program use of state median income to calculate income-eligibility for child care transfer payments hurts San Mateo County families with young children who are working and earning up to the local area median income. EXAMPLE: A single parent earning a few pennies more than $15/hour in an airline job at the San Francisco International Airport ($31,400 annually or a little more than three times the minimum wage) would need to use almost one- third of his gross salary to pay the average cost of licensed care for a child under 44 The state median income in 1996 was $48,400, while the county median income in that year was $61,300. Source: http://www.huduser.org. 45 For example, as discussed in Appendix F, the average wage of direct employment in San Mateo County licensed child care establishments is about $14,851, which is eight percent higher than the industry’s statewide average of $13,768 annually. 46 California Child Care Resource and Referral Network, The California Child Care Portfolio, 1997. - - 28
- 38. two years of age in San Mateo County ($8,944 annually). After paying the average rent for a two-bedroom/one bath apartment in San Mateo County (more than $1,100/month at the close of 1996), his disposable before-tax income for all household expenses other than housing and child care (transportation, health care, utilities and telephone, etc.) would be about $9,000. But his income would exceed the maximum amount permitted to place his child on the waiting list for subsidized care that had the highest allowable income ($31,399 or 84% of state median income using certain state funds) and would be well above the highest allowable income for subsidy programs using federal funds ($28,035 or 75% of state median income). EXAMPLE: A similar single parent with one child earning $15/hour ($31,200 annually or a little more than 50% of San Mateo County’s median income) would just be able to get on the waiting list for subsidized care using certain state funds, but, according to the Council which administers a centralized subsidy waiting list, this family would almost certainly not receive assistance because lower-income families in the county would constantly supercede the family on the waiting list. EXAMPLE: A two-parent family with two full-time incomes totaling $61,300 (the 1996 San Mateo County median income for families) and two young children—one infant and one three-year-old--would also have difficulty paying for child care although they earn almost twice as much as similar families in San Mateo County who are able to qualify for state and federal child care subsidies. Assuming the family had the necessary 20% down payment, it would be able to qualify with a lender to purchase a median priced home in the county for $280,00047, while paying an estimated $1,800 for monthly mortgage principal and interest, taxes and insurance (or $21,600 annually) on an outstanding mortgage of about $224,000. As discussed above, the family would have to pay $8,944 annually for full-time infant care and $5,824 annually for full-time pre-school- 47 SAMCEDA, p. 38, showing “Existing Home Price” for 1996. - - 29
- 39. aged care, or almost $15,000 annually. Using 35% of household income for housing, this median-income family would not be considered to be significantly burdened by the cost of median-priced housing. But with almost 25% of the household income consumed by child care expenditures, even a median income family seems to be burdened by the high cost of child care in San Mateo County. Thus, the County’s shortage of affordable child care is a serious problem not just for the San Mateo households who--at about 50% of the local area median income and below—are eligible for federal or state child care subsidies but not able to receive them, but also for the many households who earn between 50% and 100% of the local area median income and are ineligible for federal or state child care subsidies. PROJECTED GROWTH IN CHILD CARE NEEDS Child care needs in San Mateo County are likely to continue to grow at a moderate pace as a result of several factors, including population growth, modest growth in labor force participation, the implementation of welfare to work requirements of Temporary Assistance for Needy Families program, and the rate of job growth in lower-paid service and transportation occupations. Population Growth The population in San Mateo County has been growing at a rate of 0.9% annually for the period from 1990 to 1996, and is expected to grow at a compounded rate of 1.1% annually for the period from 1996 to 2,000.48 Although lower than the state’s growth rate, the county’s growth rate is now close to the national growth rate.49 Between 1989 and 1994, the number of children born (and the crude birth rate) in San Mateo County remained relatively stable at 10,000 births a year.50 In 48 SAMCEDA, p. 16. 49 SAMCEDA, p. 38. 50 San Mateo County Health Department. - - 30
- 40. 1989, 6.3% of the San Mateo population (and 8% of the child population) lived in poverty, well below the state average of 12.5%. However, from 1989 to 1994, the percentage of county births paid for by Medi-Cal increased from 17% to 29% of all births.51 This rate of increase was higher than the state’s rate of increase and higher than the rate of increase of any other Bay Area county. This may indicate that an increasing percentage of San Mateo’s young children are from families that are in need of subsidized child care. In addition to births, net migration to San Mateo County will also contribute to population growth. International migration to San Mateo County has been holding steady at about 6,000 per year, while domestic migration is a negative, with 4,100 more San Mateo County residents leaving the county for other U.S. counties than entering it from other U.S. counties. A reduction in the rate of domestic migration from the county in 1996 caused the first net positive migration (both foreign and domestic) to the county in several years.52 Labor Force Participation Rates Today's U.S. labor force participation rate (the civilian labor force divided by the working age population) is about 67 percent, compared with a rate of about 60 percent in 1971 (Figure 7). This increase has resulted primarily from an increase among women. In 1971, the labor force participation rate for all U.S. women registered 43 percent, before rising to 60 percent in recent years. Figure 7 LABOR FORCE PARTICIPATION RATES 51 SAMCEDA, p. 52 using data from California Department of Health Services. 52 SAMCEDA, p. 16. - - 31
- 41. 80 70 Labor force participation rate (percent) 60 50 40 30 20 10 0 Total Men Women Source: Bureau of Labor Statistics 1971 1982 1997 http://stats.bls.gov From 1971-1997, the labor force participation rate for young women jumped dramatically (Figure 8). For women 20-24, labor force participation rates climbed from 57 to 71 percent. The increase for women aged 25-34 was even starker. In 1971, less than one-half of these women worked. In 1993, the figure reached nearly three-fourths of women in this age group. In 1994, 62% of married mothers with a child under age six were in the workforce, as compared to 30% in 1970.53 FIGURE 8 YOUNG WOMEN'S LABOR FORCE PARTICIPATION RATES 53 Sandra Hofferth, “Child Care in the United States Today.” In The Future of Children: Financing and Child Care, Vol. 6, No. 2, Center for the Future of Children, The David and Lucile Packard Foundation. - - 32
- 42. 80 70 Labor force participation rate (percent) 60 50 40 30 20 10 0 20 to 24 25 to 34 1971 1982 1993 Source: Bureau of Labor Statistics (http://www.stats.bls.gov) The Bureau of Labor Statistics projects that the national labor force participation rate for all women will increase an additional 2 points by the year 2005. A parallel increase locally would increase the number of San Mateo County children requiring child care in the year 2005 by about 3,000.54 However, San Mateo County’s total labor force growth rate (for both men and women) is growing at an average annual rate just below 0.1%, well below the 0.5% for the Bay Area and 1% for the U.S.55 Thus, the rate of increase in women’s participation in the labor force that would be expected based on national figures may not be fully realized in San Mateo County--perhaps because specific shortages in local child care supply are constraining labor force participation. 54 Estimated by Economics Online based on current labor force participation rates among two-parent and single-parent families with children. 55 SAMCEDA, p. 17. - - 33
- 43. Transition from Welfare to Work The current effort to reform welfare (Temporary Assistance to Needy Children, or TANF) also will add to child care demand in San Mateo County over the next few years. Under TANF, 25 percent of virtually all welfare recipients56 must transition to work in 1997 and an additional 25 percent must transition by 2002. The TANF caseload in San Mateo County in 1996 was 16,300 adults and children.57 Based on TANF criteria, about 1,600 adult recipients58, in San Mateo County must transfer to work by 2002.59 If these recipients successfully transfer to work (though they could still be receiving some welfare assistance), they will also increase the need for subsidized child care in San Mateo County. Implications of Occupational and Industry Growth for Child Care Need The San Mateo County economy, like the state economy, has changed since the mid-1980s. Among other structural changes, there have been employment shifts from high-wage, goods-producing industries (e.g., manufacturing, construction, mining) to low-wage, service-producing industries (e.g., trade, finance, services). San Mateo County’s higher than average wages across all industries are attributable to the positive effects of high wage, high technology industries and tend to mask the significant growth of lower-wage employment in the county. In fact, the service sector has been, and will likely continue to be, the biggest job producer in the county and the one with the fastest growth rate. In contrast, the high-value-added industries, while increasing wages for their 56Child-only recipients and the disabled are exempt. This category makes up about 20 percent of recipients in California. The Urban Institute, Diversity Among State Welfare Programs: Implications for Reform, Series A, No. A-1, January 1997, p. 4. 57Department of Social Services, California Health and Welfare Agency. 58One-half of the July 1996 caseload. 59 As of July, 1997, San Mateo County estimated that 5,200 families (adult recipients with children or children on their own) in the county receive welfare benefits. - - 34
- 44. workforce and widening the gap between the upper half and the lower half of the labor market, are not contributing appreciably to job creation gains.60 Continued countywide growth in lower-wage industries and occupations will increase the demand for child care in general because in more cases, both parents in two parent households will need to work. This shift will also increase the demand for subsidized child care. A closer examination of service industries and specific occupations suggests that the need for child care beyond the typical hours of 8 a.m. to 6 p.m. may also expand considerably. Many lower-wage service occupations (for example, Home Health Workers, who are projected to be among the fastest growing occupations in San Mateo County)61 are characterized by non-traditional hours, and workers may need child care in the evenings and on weekends. Nontraditional hours are also more prevalent in the transportation sector, a significant part of the San Mateo County economy because of the presence of San Francisco International Airport. Statewide, a review of the fastest-growing jobs and their associated wages also suggests continuing increases in subsidized child care demand (Figure 9). The highest projected job growth statewide (nearly 110,000 jobs) from 1993 to 2005 is for waiters and waitresses. High job growth is projected in several other low-wage occupations. Retail sales employment, with median wages in 1995 of only $5.50, is projected to rise by 105,000. Of the ten fastest-growing occupation categories, only two pay above median wages. Most wages in these fast-growing industries are near the poverty level, estimated at just over $6 per hour in 1996.62 The increasing numbers of California workers in low-wage occupations will be hard-pressed to meet their child care needs without access to subsidized care. FIGURE 9 60 ABAG, p. 1. 61 Employment Development Department, http://www.calmis.cahwnet.gov. - - 35
- 45. WAGES OF CALIFORNIA’S FASTEST GROWING JOBS 25 20 Average hourly wage $14.90 Median 1995 hourly wage 15 10 5 0 Reg. Food Recept. Secretary Instruct. General Cashier Retail General Waiter/ nurse prep. aide office sales mgr. waitress worker Higher job growth Sources: Bureau of Labor Statistics, Employment Development Department Child Care and the Family Budget An analysis of the distribution of family expenditures supports the projection of an increased need for affordable child care, both for the part of the San Mateo County population that is eligible for federal and state child care transfer payments and for the part of the population that is above the eligible income but still not able to afford the county’s current market rates of care. According to the Bureau of Labor Statistics, most families have little discretionary income that can be applied to child care expenses. The BLS has failed to even list child care as a discrete expenditure, and thus it is assumed to be included in “other” expenses in the BLS distribution of family expenditures. (See Figure 10). 62California Budget Project, “Are There Jobs for Those Who Face Time Limits?,” March - - 36
- 46. FIGURE 10 DISTRIBUTION OF FAMILY EXPENDITURES Apparel 5% Health care 5% Entertainment 5% Housing 33% Personal insurance 9% Other 10% Transportation Food 19% 14% Source: Bureau of Labor Statistics (http://stats.bls.gov) Although the BLS has failed to separately account for child care expenditures in the household budget, Bureau of the Census (BOC) reports show that child care expenditures are consuming an increasing share of family income.63 The exact share varies depending on income level. BOC figures indicate that while all families with children under five spent an average of 8% of their income on child care, families with annual incomes under $14,400 spent 25% of their income on child care.64 17, 1997. 63“Who’s Minding the Kids,” Survey of Income and Program Participation, Child Care Arrangements, Fall 1991, Current Population Reports, Series P70-36. 64 Hofferth, p. 53. - - 37