Function points and elements
•Descargar como DOCX, PDF•
0 recomendaciones•671 vistas

Project Estimation using Function points.

Recomendados
Más contenido relacionado
La actualidad más candente
La actualidad más candente (19)
Destacado
Destacado (20)
Similar a Function points and elements
Similar a Function points and elements (20)
Último
Último (20)
Function points and elements
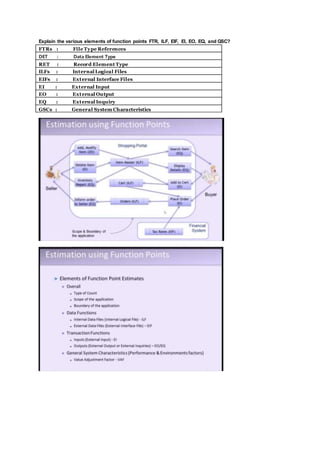
- 1. Explain the various elements of function points FTR, ILF, EIF, EI, EO, EQ, and GSC? FTRs : File Type References DET : Data Element Type RET : Record Element Type ILFs : Internal Logical Files EIFs : External Interface Files EI : External Input EO : External Output EQ : External Inquiry GSCs : General System Characteristics
- 2. File Type References (FTRs): An FTRis a file or data referenced by a transaction. An FTRshould be an ILF or EIF. So count each ILF or EIF read during the process. If the EPis maintained as an ILF then count that as an FTR. Soby default you willalways have one FTRin any EP. Data Element Type (DET): A data element type (DET)is a unique,user-recognizable,non-repeated field. Record Element Type (RET): A record element type (RET) is a user-recognizable subgroup of data elements within an ILF or EIF. Internal Logical Files (ILFs): ILFs are logically related data from a user's point of v iew. They reside in theinternalapplication boundary and are maintained through theelementary process of the application. ILFs can havea maintenance screen but not always. External Interface Files (EIFs): EIFs reside in the externalapplication boundary.EIFs are used only for reference purposes and are not maintainedby internal applications. EIFs are maintained by externalapplications. External Input (EI): EIs are dynamic elementary processes in which data is received from the externalapplication boundary. Example: User interaction screens, when data comes from the User Interfacetothe Internal Application. External Output (EO): EOs are dynamicelementary processes in which derived data crosses from the internal application boundary tothe externalapplication boundary. External Inquiry (EQ): An EQ is a dy namic elementary process in which result data is retrieved from one or more ILF or EIF. In this EPsome input requests haveto enter the application boundary.Output results exits the application boundary. General System Characteristics (GSCs): This section is the most important section.All the previously discussed sections relate only toapplications.But thereare other things alsotobe considered while making software, such as are you going tomake it an N-Tier application,what's theperformance level theuser is expecting, etc. These other factors are called GSCs. Record Element Type (RET): A record element type (RET) is a user-recognizable subgroup of data elements within an ILF or EIF ===================================x========================================= Introduction To Function Point Analysis Software systems,unless theyare thoroughly understood,can be like an ice berg. They are becoming more and more difficultto understand. Improvementofcoding tools allows software developers to produce large amounts of software to meetan ever expanding need from users.As systems grow a method to understand and communicate size needs to be used.Function PointAnalysis is a structured technique of problem solving.It is a method to break systems into smaller components,so theycan be better understood and analyzed. Function points are a unit measure for software much like an hour is to measuring time,miles are to measuring distance or Celsius is to measuring temperature. Function Points are an ordinal measure much like other measures such as kilometers,Fahrenheit,hours,so on and so forth
- 3. Reboot! - The Book Reboot!Free Online Book - http://www.RebootRethink.Com - It is time to Reboot,Rethink and RestartSoftware Development. Blog davidlongstreet.wordpress.com Function Point Training Online FunctionPointTraining course Human beings solve problems bybreaking them into smaller understandable pieces.Problems thatmayappear to be difficult are simple once they are broken into smaller parts -- dissected into classes.Classifying things, placing them in this or that category, is a familiar process.Everyone does it at one time or another -- shopkeepers when theytake stock of what is on their shelves,librarians when theycatalog books,secretaries when they file letters or documents. When objects to be classified are the contents of systems,a setof definitions and rules mustbe used to place these objects into the appropriate category, a scheme ofclassification.Function Point Analysis is a structured technique ofclassifying components ofa system.It is a method to break systems into smaller components,so they can be better understood and analyzed. It provides a structured technique for problem solving. In the world of Function Point Analysis,systems are divided into five large classes and general system characteristics.The firstthree classes or components are External Inputs,External Outputs and External Inquires each of these components transactagainstfiles therefore theyare called transactions.The next two Internal Logical Files and External Interface Files are where data is stored that is combined to form logical information. The general system characteristics assess the general functionalityof the system. Brief History Function Point Analysis was developed firstby Allan J. Albrecht in the mid 1970s.It was an attempt to overcome difficulties associated with lines ofcode as a measure ofsoftware size,and to assistin developing a mechanism to predict effort associated with software development.The method was first published in 1979,then later in 1983 . In 1984 Albrecht refined the method and since 1986,when the International Function Point User Group (IFPUG) was setup, several versions ofthe Function Point Counting Practices Manual have been published by IFPUG. The currentversion of the IFPUG Manual is 4.1. A full function pointtraining manual can be downloaded from this website. Objectives of Function Point Analysis Frequently the term end user or user is used withoutspecifying whatis meant.In this case,the user is a sophisticated user.Someone thatwould understand the system from a functional perspective --- more than likely someone thatwould provide requirements or does acceptance testing. Since Function Points measures systems from a functional perspective they are independentoftechnology. Regardless oflanguage,developmentmethod,or hardware platform used,the number of function points for a system will remain constant.The only variable is the amountof effort needed to deliver a given set of function points;therefore,Function Point Analysis can be used to determine whether a tool,an environment,a language is more productive compared with others within an organization or among organizations.This is a critical point and one of the greatestvalues of Function PointAnalysis. Function Point Analysis can provide a mechanism to track and monitor scope creep.Function Point Counts at the end of requirements,analysis,design,code,testing and implementation can be compared.The function point count at the end of requirements and/or designs can be compared to function points actually delivered.If the projecthas grown,there has been scope creep.The amountof growth is an indication ofhow well requirements were gathered by and/or communicated to the project team.If the amountof growth of projects declines over time it is a natural assumption thatcommunication with the user has improved. Characteristic of Quality Function Point Analysis Function Point Analysis should be performed by trained and experienced personnel.If Function PointAnalysis is conducted by untrained personnel,itis reasonable to assume the analysis will done incorrectly.The personn el counting function points should utilize the mostcurrentversion of the Function Point Counting Practices Manual,
- 4. Currentapplication documentation should be utilized to complete a function pointcount. For example,screen formats,reportlayouts, listing ofinterfaces with other systems and between systems,logical and/or preliminary physical data models will all assistin Function Points Analysis. The task of counting function points should be included as partofthe overall projectplan. That is,coun ting function points should be scheduled and planned.The first function pointcount should be developed to provide sizing used for estimating. The Five Major Components Since it is common for computer systems to interactwith other computer systems,a boundarymustbe drawn around each system to be measured prior to classifying components.This boundarymustbe drawn according to the user’s pointofview. In short, the boundaryindicates the border between the project or application being measured and the external applications or user domain.Once the border has been established,components can be classified,ranked and tallied. External Inputs (EI) - is an elementaryprocess in which data crosses the boundaryfrom outside to inside. This data may come from a data input screen or another application.The data may be used to maintain one or more internal logical files. The data can be either control information or business information. If the data is control information itdoes nothave to update an internal logical file. The graphic represents a simple EIthat updates 2 ILF's (FTR's). .Please check out the online selfpaced function pointtraining. External Outputs (EO) - an elementaryprocess in which derived data passes across the boundaryfrom inside to outside. Additionally, an EO may update an ILF. The data creates reports or output files sentto other applications. These reports and files are created from one or more internal logical files and external interface file. The following graphic represents on EO with 2 FTR's there is derived information (green) thathas been derived from the ILF's External Inquiry (EQ) - an elementaryprocess with both inputand output components thatresultin data retrieval from one or more internal logical files and external interface files. The input process does notupdate any Internal Logical Files,and the output side does notcontain derived data. The graphic below represents an EQ with two ILF's and no derived data.
- 5. Internal Logical Files (ILF’s) - a user identifiable group oflogicallyrelated data that resides entirelywithin the applications boundaryand is maintained through external inputs. External Interface Files (EIF’s) - a user identifiable group oflogicallyrelated data that is used for reference purposes only.The data resides entirelyoutside the application and is maintained byanother application.The external interface file is an internal logical file for another application. After the components have been classified as one ofthe five major components (EI’s,EO’s,EQ’s, ILF’s or EIF’s), a ranking of low, average or high is assigned.For transactions (EI’s,EO’s,EQ’s) the ranking is based upon the number offiles updated or referenced (FTR’s) and the number of data elementtypes (DET’s). For both ILF’s and EIF’s files the ranking is based upon record elementtypes (RET’s) and data elementtypes (DET’s).A record elementtype is a user recognizable subgroup ofdata elements within an ILFor EIF. A data elementtype is a unique user recognizable,non recursive,field. Each of the following tables assists in the ranking process (the numerical rating is in parentheses).For example, an EI that references or updates 2 File Types Referenced (FTR’s) and has 7 data elements would be assigned a ranking of average and associated rating of4. Where FTR’s are the combined number ofInternal Logical Files (ILF’s) referenced or updated and External Interface Files referenced. EI Table Shared EO and EQ Table Values for transactions
- 6. Like all components,EQ’s are rated and scored.Basically,an EQ is rated (Low, Average or High) like an EO, but assigned a value like and EI. The rating is based upon the total number of unique (combined unique input and out sides) data elements (DET’s) and the file types referenced (FTR’s) (combined unique inputand output sides). If the same FTR is used on both the input and output side,then it is counted only one time. If the same DETis used on both the inputand outputside,then it is only counted one time. For both ILF’s and EIF’s the number of record elementtypes and the number ofdata elements types are used to determine a ranking of low,average or high. A Record ElementType is a user recognizable subgroup ofdata elements within an ILFor EIF. A Data ElementType (DET) is a unique user recognizable,non recursive field on an ILF or EIF. The counts for each level of complexity for each type of componentcan be entered into a table such as the following one.Each count is multiplied bythe numerical rating shown to determine the rated value. The rated values on each row are summed across the table,giving a total value for each type of component.These totals are then summed across the table,giving a total value for each type of component.These totals are then summoned down to arrive at the Total Number ofUnadjusted Function Points. The value adjustmentfactor (VAF) is based on 14 general system characteristics (GSC's) that rate the general functionality of the application being counted.Each characteristic has associated descriptions thathelp determine the degrees ofinfluence of the characteristics.The degrees ofinfluence range on a scale of zero to five, from no
- 7. influence to strong influence.The IFPUG Counting Practices Manual provides detailed evaluation criteria for each of the GSC'S, the table below is intended to provide an overview of each GSC. General System Characteristic Brief Description 1. Data communications How many communication facilities are there to aid in the transfer or exchange of information with the application or system? 2. Distributed data processing How are distributed data and processing functions handled? 3. Performance Was response time or throughputrequired bythe user? 4. Heavily used configuration How heavily used is the current hardware platform where the application will be executed? 5. Transaction rate How frequently are transactions executed daily, weekly, monthly, etc.? 6. On-Line data entry What percentage of the information is entered On-Line? 7. End-user efficiency Was the application designed for end-user efficiency? 8. On-Line update How many ILF’s are updated by On-Line transaction? 9. Complexprocessing Does the application have extensive logical or mathematical processing? 10. Reusability Was the application developed to meetone or manyuser’s needs? 11. Installation ease How difficult is conversion and installation? 12. Operational ease How effective and/or automated are start-up,back-up,and recovery procedures? 13. Multiple sites Was the application specificallydesigned,developed,and supported to be installed atmultiple sites for multiple organizations? 14. Facilitate change Was the application specificallydesigned,developed,and supported to facilitate change? Once all the 14 GSC’s have been answered,theyshould be tabulated using the IFPUG Value Adjustment Equation (VAF) -- 14 where:Ci = degree of influence for each General System Characteristic VAF = 0.65 + [ (Ci) / 100] .i = is from 1 to 14 representing each GSC. i =1 Ã¥ = is summation ofall 14 GSC’s. The final Function PointCount is obtained by multiplying the VAF times the Unadjusted Function Point(UAF). FP = UAF * VAF
- 8. Summary of benefits of Function Point Analysis Function Points can be used to size software applications accurately.Sizing is an importantcomponentin determining productivity(outputs/inputs). They can be counted by different people,at different times,to obtain the same measure within a reasonable margin oferror. Function Points are easilyunderstood bythe non technical user.This helps communicate sizing information to a user or customer. Function Points can be used to determine whether a tool, a language,an environment,is more productive when compared with others. For a more complete listofuses and benefits ofFP please see the online article on Using Function Points. Conclusions Accurately predicting the size of software has plagued the software industryfor over 45 years. Function Points are becoming widelyaccepted as the standard metric for measuring software size. Now that Function Points have made adequate sizing possible,itcan now be anticipated that the overall rate of progress in software productivity and software quality will improve. Understanding software size is the key to understanding both productivity and quality. Without a reliable sizing metric relative changes in productivity (Function Points per Work Month) or relative changes in quality(Defects per Function Point) can not be calculated.If relative changes in productivity and quality can be calculated and plotted over time,then focus can be put upon an organ izations strengths and weaknesses.Mostimportant,any attemptto correct weaknesses can be measured for effectiveness. pdf version of this article Online Function Point Training. rebootthe book