
Recomendados
Recomendados
Más contenido relacionado
La actualidad más candente
La actualidad más candente (20)
Similar a Misleadinggraphs
Similar a Misleadinggraphs (20)
Último
Último (20)
Misleadinggraphs
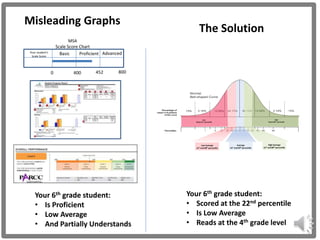
- 1. Scale Score Chart Basic Proficient Advanced 0 800 Your student’s Scale Score 452400 MSA Misleading Graphs The Solution High Above 80th percentile Low Below 21st percentile Low Average 21st and 40th percentile High Average 61st and 80th percentile Average 41st and 60th percentile Your 6th grade student: • Is Proficient • Low Average • And Partially Understands Your 6th grade student: • Scored at the 22nd percentile • Is Low Average • Reads at the 4th grade level
- 2. 261 342 0 100 6th grade reading ability most students What parents are shown. What parents are not shown. Same Student
- 3. 261 937 4th grade 6th grade School System’s Response:
- 4. Very Not 4th Grade Reading Level What parents are shown. Low Average • Limited comparison to others. • Meaningless scale. • Meaningless terms. Basic Proficient Advanced High Above 80th percentile Low Below 21st percentile Low Average 21st and 40th percentile High Average 61st and 80th percentile Average 41st and 60th percentile HowMisleading Levels of Misleading – ness. Current Student Score Reports Using Grade Level Descriptions Using Standardized Normal Curve
- 5. Least Most Your 6th grade student reads at a: 4th Grade Reading LevelWhat parents are shown. Low Average • Limited comparison to others. • Meaningless scale. • Meaningless terms. Basic Proficient Advanced High Above 80th percentile Low Below 21st percentile Low Average 21st and 40th percentile High Average 61st and 80th percentile Average 41st and 60th percentile HeadachleLevel Level of Headache for School System Current Student Score Reports Using Grade Level Descriptions Using Standardized Normal Curve
- 6. If you don’t want to talk about grade levels, Then don’t teach in grade levels. If you don’t want to talk about grade levels, Then you have a responsibility to give me the percentile.
- 7. 0 – 100 Scale One Decent Standardized Graph Statistical AVERAGE 50% below 50% above 15% less well 85% scored higher
- 8. 0 – 100 Scale One Decent Standardized Graph Statistical AVERAGE 0.13% is so tiny, It is represented by the line on the end of the graph.
- 9. One Decent Standardized Graph
- 10. One Decent Standardized Graph
- 11. One Decent Standardized Graph Graphs can be Misleading
- 12. One Decent Standardized Graph Statistical AVERAGE Low Average Reading Performance Is Surprisingly Low Grade Level Reading Performance Dead on Average CAUTION:
- 13. 1st 2nd 3rdThe Truth: Grade Level Reading Ability 3rd 4th 5th 6th 10th 7th 11th 8th 12th 9th My student may not be O.K. My student is not O.K. My student may not really be advanced Scale Basic Proficient Advanced Your student’s Scale Score 0 800452400 Graphic 0 400 800450 Numbers MSA Reading Score Report – 6th Grader Misleading
- 14. AdvancedBasic Proficient 4th – 5th grade Reading Level Informative Standardized Graph Year 2011 Grade 6 Form B MSA Reading Scores Student Labeled Proficient can be 2 grade levels behind. Basic Proficient Advanced 0 800 Your student’s Scale Score 452400
- 15. MAP testing Student Report 160 210 157 225 Graphed Scale Actual Scale Misleading Scale Everyone looks a little better Meaningless Numbers
- 16. i NWEA MAP testing results Representative samples of what is reported to parents. Student Performance Report Data Analysis of K-12 School System Performance Data Descriptive Terms Understanding and Using Literary: Texts LoAvg Building Vocabulary Low Understanding and Using Informational: Texts Low Lexile Range: 168-318L
- 17. NWEA MAP Scores on Normal Curve Any Grade High Above 80th percentile Low Below 21st percentile Low Average 21st and 40th percentile High Average 61st and 80th percentile Average 41st and 60th percentile Fall 08Spring 09 Fall 09 Term/Yr. %’tile Fall 09 10 Spring 09 06 Fall 08 20
- 18. NWEA MAP Scores on Normal Curve 6th Grade High Above 80th percentile 9th grade + Low Below 21st percentile 1st – 3rd grade Low Average 21st and 40th percentile 4th – 5th grade High Average 61st and 80th percentile 7th– 8th grade Average 41st and 60th percentile 6th grade
- 19. NWEA MAP Scores on Normal Curve Any Grade Most Important Slide Award NOTE: Low Average can mean 1, 2, or even 3 grade levels below the student’s current grade level. Low average percentiles are still considered statistically average – but might rightfully concern a parent. High Above 80th percentile Low Below 21st percentile Low Average 21st and 40th percentile High Average 61st and 80th percentile Average 41st and 60th percentile Parent and school should both be concerned. Parent should be concerned. School may not be concerned. Plot these numbers onto this scale.
- 20. Misleading Graph The Solution High Above 80th percentile Low Below 21st percentile Low Average 21st and 40th percentile High Average 61st and 80th percentile Average 41st and 60th percentile