Bacterial nitrogen cycling
•Descargar como PPTX, PDF•
4 recomendaciones•2,764 vistas

discussion of 3 journal papers on nitrification, microbiological ammonia oxidation

Recomendados
Más contenido relacionado
La actualidad más candente
La actualidad más candente (20)
Destacado
Destacado (20)
Similar a Bacterial nitrogen cycling
Similar a Bacterial nitrogen cycling (20)
Más de Carlos Loyola
Más de Carlos Loyola (12)
Último
Último (20)
Bacterial nitrogen cycling
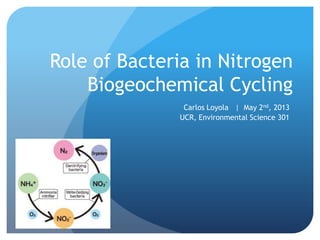
- 1. Role of Bacteria in Nitrogen Biogeochemical Cycling Carlos Loyola | May 2nd, 2013 UCR, Environmental Science 301
- 2. Outline of this talk A quick note on the Nitrogen biogeochemical cycle Hagopian & Riley 1998. A closer look at the bacteriology of nitrification Ruiz et al. 2003. Nitrification with high nitrite accumulation for the treatment of wastewater with high ammonia concentration. Fdz-Polanco et al. 2000. Spatial distribution of heterotrophs and nitrifiers in a submerged biofilter for nitrification
- 3. Biogeochemical Cycle: The cycling of a chemical element or compound along the biosphere and geosphere: http://www.h2ou.com/h2nitrogencycle.htm
- 5. Hagopian & Riley 1998. A closer look at the bacteriology of nitrification Review from an aquaculture perspective Sorry, this paper has too much text!
- 6. Hagopian & Riley 1998. A closer look at the bacteriology of nitrification Nitrogen: Proteins, nucleic acids, adenosine phosphates, nucleotides, pigments Fish N waste: urine, feces. (In aquaculture, uneaten feed also contributes to nitrogenous waste loadin.) Ammonia and ammonium: 60–90% of the total N excreted Urea: 9–27% of the soluble N excreted
- 7. A closer look at the bacteriology of nitrification If food/fecal matter accumulate in water, organic compounds are proteolyzed and deaminated to ammonia. A process called ammonification. Further mineralization takes place by nitrification. Both unionized ammonia and nitrite (NO2−) are toxic to fish at low concentrations.
- 8. Acute NH3 toxicity in salmonids: 0.2 mg l−1 Recommended NH3 maximum permissible level: 0.002 mg l−1 (Haywood, 1983) Nitrite toxicity varies greatly between species and life stages, a concentration as low as 1.8 mg l−1 NO2− has been documented to be lethal to rainbow trout (Oncorhynchus mykiss) within 24 h The lethal concentration of nitrate is 6200 mg l−1 for channel catfish (Ictalurus punctatus) A closer look at the bacteriology of nitrification
- 9. Nitrification is performed by two phylogenetically distinct groups of bacteria: Ammonia-oxidizing bacteria (or nitrite bacteria) obtain energy by catabolizing un-ionized ammonia to nitrite NH3+ 1.5O2 NO2 − + H2O + H+ + 84 kcal mol−1 nitrite-oxidizing bacteria (or nitrate bacteria) mineralize nitrite to nitrate NO2 − + 0.5O2 NO3 − + 17.8 kcal mol−1 A closer look at the bacteriology of nitrification
- 10. Nitrobacteraceae: Gram-negative chemoautotrophs, or lithotrophs. Nitrite bacteria: Nitrosomonas, Nitrosococcus, Nitrosospira, Nitrosolobus, and Nitrosovibrio. Nitrate bacteria: Nitrobacter, Nitrococcus, Nitrospira, and Nitrospina Chemoautotrophic bacteria are characterized by the ability to utilize an inorganic chemical substrate (e.g. NH3, H2, Fe2+) as a source of electrons for the immobilization of inorganic carbon (i.e. CO2 (aq) or HCO3−) into biomass A closer look at the bacteriology of nitrification
- 11. This sole energy source drives carbon fixation, the assimilation of monomers into precursor metabolites, and the subsequent polymerization of building blocks and macromolecules Chemoautotrophs are aerobic, usually employing dioxygen gas (O2) as the final or terminal electron acceptor In contrast to photoautotrophic cyanobacteria and algae, there is no net production of oxygen. A closer look at the bacteriology of nitrification
- 12. Nitrosomonas europaea is the most abundantly cited and extensively studied nitrifier. The bacteria are short rods (0.8×1–2 mm), typically non-motile, and ubiquitous in soils (Watson, 1971). Other Nitrosomonas species have one or two subpolar flagella and inhabit freshwater and marine sediments A closer look at the bacteriology of nitrification
- 13. As autotrophs, nitrifiers are independently capable of creating the entirety of their biomass through a full complement of biosynthetic pathways Urea and methane oxidation and the co-metabolism of a wide variety of hydrocarbons is common Cells may be maintained under starvation conditions (i.e. ammonia or nitrite deprivation) through the low- level endogenous respiration of cytoplasmic compounds, while anabolic processes are lowered to undetectable levels A closer look at the bacteriology of nitrification
- 14. At low DO levels, ammonia-oxidizers use nitrite as an artificial electron acceptor and generate nitrous oxide (N2O) gas. Nitric oxide (NO) is produced by ammonia- oxidizers, but less sensitive to DO Nitrifying bacteria are photoinhibited and are especially sensitive to disturbances away from optimal alkaline and mesophilic conditions A commonly cited optimum pH for nitrifiers is 7.8 For temperature, an overall optimum of 25°C has been suggested A closer look at the bacteriology of nitrification
- 15. The maximum specific growth rate of nitrifying bacteria is uncommonly slow, owing to the low yield of their energy producing pathways and the burden of precursor formation through the incorporation of inorganic carbon A doubling time of 7–8 h is possible under ideal conditions Nitrifiers normally make up a very low percentage of the total microflora in soils, sediments, and naturally derived waste streams Nitrifying biofilms are heavily overgrown by heterotrophs (pH and oxygen concentration gradient problems are exacerbated) A closer look at the bacteriology of nitrification
- 16. In natural waters nitrifiers are associated with suspended and settled particles, rather than free, unattached flotation in the water column 70 and 95% of suspended nitrifiers will cling to a fine inert media within 30 min of its introduction If the detention time of a chemostat is not longer than the generation time of a suspended microorganism, it will rapidly be flushed out with the effluent. Even in a flow-through system that is designed for slow growing nitrifiers, the steady-state balance may be upset by a change in the condition of the medium A closer look at the bacteriology of nitrification End of Hagopian’s paper
- 17. Nitrification with high nitrite accumulation for the treatment of wastewater with high ammonia concentration. Ruiz et al., 2003 Authors studied the effects of pH and dissolved oxygen (DO) on ammonia oxidation. Aim was to determine the conditions for saving oxygen. Aeration is a costly supply in wastewater treatment plants. Assayed oxygen at intervals from 0.5 to 5.5 mg/L They identified that as low as 0.7 mg/L allows the conversion of up to 98 % ammonia, accumulating up to 65% as nitrite. Ruiz’s paper starts here
- 18. Nitrification with high nitrite accumulation for the treatment of wastewater with high ammonia Parameters that are necessary to determine the bacteria specific growth rate μ
- 19. Nitrification with high nitrite accumulation for the treatment of wastewater with high ammonia
- 20. Nitrification with high nitrite accumulation for the treatment of wastewater with high ammonia VSS: Volatile suspended solids, max ≅ 6.3 g/L NLR: Nitrogen loading rate, max ≅ 3.5 kg/m3 d Ammonia, max ≅ 780 mg N/L
- 21. Nitrification with high nitrite accumulation for the treatment of wastewater with high ammonia Tipical removal efficiency plot (Inlet/Outlet concentrations)
- 22. Nitrification with high nitrite accumulation for the treatment of wastewater with high ammonia Ammonia concentration at inlet (feed) 610 mg/L DO 5.5 mg/L pH is the dotted line
- 23. Nitrification with high nitrite accumulation for the treatment of wastewater with high ammonia Effect of dissolved oxygen (DO): the dotted line. NO3 - out NO2 - out NH4 + out End of Ruiz’s paper
- 24. Spatial distribution of heterotrophs and nitrifiers in a submerged biofilter for nitrification
- 25. Spatial distribution of heterotrophs and nitrifiers in a submerged biofilter for nitrification This paper describes the changes in biofilm density and specific activities of carbon, ammonia and nitrite oxidizers Experimental setup was a nitrifying upflow biological aerated filter (UBAF) Biochemical pathways develop as a function of the C:N ratio in the (synthetic) wastewater entering the filter. The reactor resisted the entrance of up 200 mg COD/l without losing nitrification efficiency. This limit corresponds to a COD:NH+4 -N ratio of four.
- 26. Spatial distribution of heterotrophs and nitrifiers in a submerged biofilter for nitrification Organic content measured as TOC, Total Organic Carbon and COD, Chemical oxygen demand, the amount oxygen needed to chemically oxidize organic matter (a parameter describing the organic matter content) The “entrance” zone of the filter removed 3.85 kg TOC/m3 day and 0.19 kg N/m3 day The second zone of the filter removed 0.42 kg TOC/m3 day and 0.96 kg N/m3 day.
- 27. Spatial distribution of heterotrophs and nitrifiers The spatial distribution of heterotrophic and nitrifying populations was quantified in terms of: Oxygen uptake rates (OUR) or specific activities at different filter heights and For increasing COD concentrations entering the reactor. Specific activities of three microbial groups, ammonia oxidizers, nitrite oxidizers and heterotrophs aerobes revealed a clear microbial segregation along the filter depending on the COD concentration entering the reactor.
- 28. Spatial distribution of heterotrophs and nitrifiers
- 29. Spatial distribution of heterotrophs and nitrifiers Head loss: Increasing pressure inside the reactor due to friction (“pressure drop” also used)
- 30. Spatial distribution of heterotrophs and nitrifiers
- 31. Spatial distribution of heterotrophs and nitrifiers
- 32. Spatial distribution of heterotrophs and nitrifiers At 0.5 m heigth At 2 m heigth
- 33. Spatial distribution of heterotrophs and nitrifiers in a submerged biofilter for nitrification Remarks Critical parameters to control: DO, COD, (pH, Temp). Configuration: DO gradient concentration along the reactor Competition among heterotrophs/nitrifiers Light inhibition