Real Estate Income and Capital Appreciation
•Descargar como PPTX, PDF•
2 recomendaciones•686 vistas

Compares income, capital appreciation, and total returns of commercial property investments through listed equity REITs, unlevered core property holdings, and core private equity real estate funds. Questions? Contact me at bcase@nareit.com.
Recomendados

Recomendados
Más contenido relacionado
Último
Último (20)
Destacado
Destacado (20)
Real Estate Income and Capital Appreciation
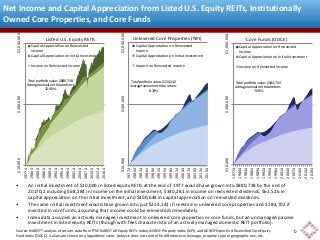
- 1. Net Income and Capital Appreciation from Listed U.S. Equity REITs, Institutionally Owned Core Properties, and Core Funds Source: NAREIT® analysis of returns data from FTSE NAREIT All Equity REITs Index, NCREIF Property Index (NPI), and NCREIF Open-End Diversified Core Equity Fund Index (ODCE). Values are shown on a logarithmic scale. Analysis does not control for differences in leverage, property type or geographic mix, etc. • An initial investment of $10,000 in listed equity REITs at the end of 1977 would have grown into $880,738 by the end of 2017Q2 including $68,284 in income on the initial investment, $340,281 in income on reinvested dividends, $61,526 in capital appreciation on the initial investment, and $400,648 in capital appreciation on reinvested dividends. • The same initial investment would have grown into just $224,142 if invested in unlevered core properties and $184,702 if invested in core funds, assuming that income could be reinvested immediately. • Index data assumes an actively managed investment in unlevered core properties or core funds, but an unmanaged passive investment in listed equity REITs (though with fees characteristic of an actively managed domestic REIT portfolio). $10,000$100,000$1,000,000 19774 19804 19834 19864 19894 19924 19954 19984 20014 20044 20074 20104 20134 20164 Core Funds (ODCE) Capital Appreciation on Reinvested Income Capital Appreciation on Initial Investment Income on Reinvested Income Total portfolio value: $184,702 Average annual net total return: 7.66% $10,000$100,000$1,000,000 19774 19804 19834 19864 19894 19924 19954 19984 20014 20044 20074 20104 20134 20164 Listed U.S. Equity REITs Capital Appreciation on Reinvested Income Capital Appreciation on Initial Investment Income on Reinvested Income Total portfolio value: $880,738 Average annual net total return: 12.00% $10,000$100,000$1,000,000 19774 19804 19834 19864 19894 19924 19954 19984 20014 20044 20074 20104 20134 20164 Unlevered Core Properties (NPI) Capital Appreciation on Reinvested Income Capital Appreciation on Initial Investment Income on Reinvested Income Total portfolio value: $224,142 Average annual net total return: 8.19% 0