SlideShare una empresa de Scribd logo
1 de 26
Descargar para leer sin conexión
CONGRESS OF THE UNITED STATES
                                                   CONGRESSIONAL BUDGET OFFICE


                                                       CBO
                                                          CBO’s 2010
                                                          Long-Term
                                                        Projections for
                                                        Social Security:
                                                          Additional
                                                         Information
    Percentage of GDP
9
                           Actual   Projected

8                                                                Outlays

7


6


5


4                                                                     Tax Revenues

3


2


1


0
 1985       1994        2003        2012        2021      2030        2039         2048   2057   2066   2075   2084

                                                         OCTOBER 2010
Pub. No. 4159
CBO
CBO’s 2010 Long-Term Projections for
Social Security: Additional Information
                            October 2010


     The Congress of the United States   O   Congressional Budget Office
Notes and Definitions
      Unless otherwise noted, all years referred to are calendar years. Numbers in the text and tables may not add up to totals because of
      rounding. Supplemental data are posted on CBO’s Web site (www.cbo.gov).

      80 percent range of uncertainty: A range of uncertainty based on a distribution of 500 simulations from CBO’s long-term model.
      Outcomes were above the range in 10 percent of the simulations, below the range in 10 percent, and within the range in 80 percent.

      Median: The middle of the distribution. When the median outcome for a group of people (defined in this document by birth cohort and
      lifetime earnings category) is shown, the value is lower for half of the people in that group and higher for half of the group.

      Present value: A single number that expresses a flow of current and future income, or payments, in terms of an equivalent lump sum
      received or paid today.

      Cost rate: The present value of outlays for a period, plus the present value of a year’s worth of benefits as a reserve at the end of the
      period, divided by the present value of the stream of gross domestic product (or taxable payroll) over the same period.

      Income rate: The present value of tax revenues for a period, plus the trust funds’ initial balance, divided by the present value of the
      stream of gross domestic product (or taxable payroll) over the same period.

      Actuarial balance: The difference between the income rate and the cost rate.

      Scheduled benefits: Full benefits as calculated under current law, regardless of the amounts available in the Social Security trust funds.

      Payable benefits: Benefits as calculated under current law, reduced as necessary to make outlays equal the Social Security system’s
      revenues. Upon exhaustion of the Social Security trust funds, the Social Security Administration would reduce all scheduled benefits
      such that outlays from the funds would equal revenues flowing into the funds.


CBO
Preface


      T      his Congressional Budget Office (CBO) publication provides additional information about long-term
      projections of the Social Security program’s finances that were included in The Long-Term Budget Outlook
      (June 2010, revised August 2010) and in Social Security Policy Options (July 2010). Those projections, which
      cover the 75-year period spanning 2010 to 2084, and the additional information presented in this document update
      projections CBO prepared last year and reported in CBO’s Long-Term Projections for Social Security: 2009 Update.

      The analysis was prepared by Noah Meyerson, Charles Pineles-Mark, Jonathan Schwabish, Michael Simpson, and
      Julie Topoleski of CBO’s Long-Term Modeling Group under the supervision of Joyce Manchester.

      Kate Kelly edited the document and Sherry Snyder proofread it. Maureen Costantino designed the cover and,
      with assistance from Jeanine Rees, prepared the document for publication. Monte Ruffin produced the initial
      printed copies, Linda Schimmel handled the print distribution, and Simone Thomas produced the electronic
      version for CBO’s Web site (www.cbo.gov).


                                                           Douglas W. Elmendorf
                                                           Director

      October 2010


CBO
List of Exhibits
      Exhibit                                                                                                                                      Page

         1.     Social Security Tax Revenues and Outlays, with Scheduled Benefits (Figure)                                                            5

         2.     Social Security Tax Revenues and Outlays, with Scheduled Benefits (Table)                                                             6

         3.     Percentage of Simulations in Which Social Security Outlays Exceed Tax Revenues by Specified Percentages, with Scheduled Benefits      7

         4.     Social Security Tax Revenues and Outlays, with Scheduled and Payable Benefits                                                         8

         5.     Summarized Financial Measures for Social Security Under the Extended-Baseline Scenario, with Scheduled Benefits                       9

         6.     Summarized Financial Measures for Social Security Under the Alternative Fiscal Scenario, with Scheduled Benefits                     10

         7.     Trust Fund Ratio, with Scheduled Benefits                                                                                            11

         8.     Percentage of Simulations That Show the Social Security Trust Funds Exhausted by a Particular Year                                   12

         9.     Median Initial Benefits for Retired Workers, with Scheduled and Payable Benefits                                                     13

        10.     Median Initial Replacement Rates for Retired Workers, with Scheduled and Payable Benefits                                            14

        11.     Median Present Value of Lifetime Benefits for Retired Workers, with Scheduled and Payable Benefits                                   15

        12.     Median Benefits and Initial Replacement Rates for Disabled Workers, with Scheduled and Payable Benefits                              16

        13.     Potential Range of Lifetime Social Security Payroll Taxes                                                                            17

        14.     Potential Range of Lifetime Social Security Benefits, with Scheduled and Payable Benefits                                            18

        15.     Potential Range of Lifetime Benefit-to-Tax Ratios, with Scheduled and Payable Benefits                                               19

        16.     Percentage of Simulations in Which Payable Benefits Exceed Specified Percentages of Scheduled Benefits                               20


CBO
CBO’s 2010 Long-Term Projections for
                                                    Social Security: Additional Information


      Social Security is the federal government’s largest               employers at 6.2 percent apiece. Self-employed          the enactment of the Social Security Amendments
      single program.1 About 54 million people currently                workers pay the entire 12.4 percent tax on earnings     of 1983. Over the next few years, the Congressional
      receive Social Security benefits. About 69 percent                themselves. The payroll tax applies only to taxable     Budget Office (CBO) projects, the program’s tax
      are retired workers, their spouses, and children and              earnings—earnings up to a maximum annual                revenues will be approximately equal to its outlays.
      another 12 percent are survivors of deceased work-                amount ($106,800 in 2010). Some Social Security         However, as more of the baby-boom generation
      ers; all of those beneficiaries receive payments                  benefits also are subject to taxation: In fiscal year   (that is, people born between 1946 and 1964)
      through Old-Age and Survivors Insurance (OASI).                   2010, about 3 percent of Social Security’s tax reve-    enters retirement, outlays will increase relative to
      The other 19 percent are disabled workers or their                nues came from the income taxes that higher-            the size of the economy, whereas tax revenues
      spouses and children; they receive Disability Insur-              income beneficiaries paid on their Social Security      will remain at an almost constant share of the econ-
      ance (DI) benefits. Social Security’s outlays in fiscal           benefits. Tax revenues credited to the program          omy. Starting in 2016, CBO projects, outlays as
      year 2010 totaled $706 billion, one-fifth of the                  totaled $670 billion in that year.                      scheduled under current law will regularly exceed
      federal budget; OASI payments accounted for                                                                               tax revenues.
      82 percent of those outlays and DI payments made                  Revenues from taxes, along with intragovern-
      up about 18 percent.                                              mental interest payments, are credited to Social        CBO projects that the DI trust fund will be
                                                                        Security’s two trust funds—one for OASI and one         exhausted in 2018 and that the OASI trust fund
      Social Security has two primary sources of tax reve-              for DI—and the program’s benefits and adminis-          will be exhausted in 2042. Once a trust fund’s bal-
      nues: payroll taxes and income taxes on benefits. In              trative costs are paid from those funds. Legally, the   ance has fallen to zero and current revenues are
      fiscal year 2010, roughly 97 percent of tax revenues              funds are separate, but they often are described        insufficient to cover the benefits that are specified
      dedicated to Social Security were collected from a                collectively as the OASDI trust funds. In a given       in law, a program will be unable to pay full benefits
      payroll tax of 12.4 percent that is levied on                     year, the sum of receipts to a fund along with the      without changes in law. The DI trust fund came
      earnings and split evenly by workers and their                    interest that is credited on previous balances, less    close to exhaustion in 1994, but that outcome was
                                                                        spending for benefits and administrative costs,         prevented by legislation that redirected revenue
                                                                        constitutes that fund’s surplus or deficit.             from the OASI trust fund to the DI trust fund. In
      1. For a description of the Social Security program, see
                                                                                                                                part because of that experience, it is a common
         Congressional Budget Office, Social Security Policy Options    In calendar year 2010, Social Security’s outlays will
         (July 2010), “An Overview of Social Security,” pp.1–4.                                                                 analytical convention to consider the DI and OASI
                                                                        exceed tax revenues (that is, the trust funds’          trust funds as combined. CBO projects that, if leg-
         Social Security’s financing and trust funds are discussed on
         pp. 3–5 of that study.                                         receipts excluding interest) for the first time since   islation to shift resources from the OASI trust fund


CBO
CBO’S 2010 LONG-TERM PROJECTIONS FOR SOCIAL SECURITY: ADDITIONAL INFORMATION        2


      to the DI trust fund was enacted, the combined          closely to current law. For example, that scenario            CBO generally focuses on scheduled benefits
      OASDI trust funds would be exhausted in 2039.           reflects the assumption that the tax cuts enacted in          because, by definition, the system would be fully
                                                              2001 and 2003 expire as scheduled at the end of               financed if only payable benefits are disbursed.
      The amount of Social Security taxes paid by vari-       2010. CBO also has developed an alternative fiscal
      ous groups of people differs, as do the benefits that   scenario, which incorporates several changes to               Quantifying Uncertainty
      different groups receive. For example, people with      current law that are widely expected to occur or              To quantify the amount of uncertainty in its Social
      higher earnings pay more in Social Security payroll     that would modify some provisions of law that                 Security projections, CBO created a distribution of
      taxes than do lower-earning participants, and they      might be difficult to sustain for a long period.              outcomes from 500 simulations using its long-term
      also receive larger benefits (although not propor-      Unless otherwise noted, the projections presented             model. In those simulations, the assumed values for
      tionately larger). Because of the progressive nature    in this analysis are based on the assumptions of the          most of the key demographic and economic factors
      of Social Security’s benefit formula, replacement       extended-baseline scenario. In that scenario,                 that underlie the analysis—for example, fertility
      rates—the amount of annual benefits as a percent-       income taxes, including the income taxes on Social            and mortality rates, interest rates, and the rate of
      age of annual lifetime earnings—are lower, on           Security benefits that are credited to the trust              growth of productivity—were varied on the basis
      average, for workers who have had higher earnings.      funds, are higher than they are in the alternative            of historical patterns of variation.3 Several of the
      As another example, the amount of taxes paid and        fiscal scenario.                                              exhibits in this publication show the simulations’
      benefits received will be greater for people in later
                                                                                                                            80 percent range of uncertainty: That is, in 80 per-
      birth cohorts because they typically will have          Scheduled and Payable Benefits                                cent of the 500 simulations, the value in question
      higher earnings over a lifetime, even after adjusting
                                                              CBO prepared two types of benefit projections.                fell within the range shown; in 10 percent of the
      for inflation, CBO projects. However, replacement
                                                              Benefits as calculated under the Social Security              simulations, the values were above that range;
      rates will be slightly lower, on average, for people
                                                              Act, regardless of the balances in the trust funds,           and in 10 percent they were below. Long-term
      in later birth groups because their full retirement
                                                              are called scheduled benefits. The Social Security            projections are necessarily uncertain, and that
      age (the age at which they can receive unreduced
                                                              Administration has no legal authority to pay sched-           uncertainty is illustrated in this publication;
      retirement benefits) will be higher.
                                                              uled benefits if their amounts exceed the balances            nevertheless, the general conclusions of this analy-
                                                              in the trust funds, however. Therefore, if the trust          sis hold true under a variety of assumptions.
                                                              funds became exhausted, payments to current and
      About This Analysis                                     new beneficiaries would need to be reduced to                 System Finances
      CBO regularly prepares long-term projections            make the outlays from the funds equal the revenues            The first part of this publication (Exhibits 1
      of revenues and outlays for the Social Security         flowing into the funds.2 Benefits thus reduced are            through 8) examines Social Security’s financial
      program. The most recent projections, for the           called payable benefits. In such a case, all receipts to      status from several vantage points. The fullest per-
      75 years from 2010 through 2084, were published         the trust funds would be used and the trust fund              spective is provided by projected streams of annual
      in Chapter 3 of The Long-Term Budget Outlook            balances would remain essentially at zero. When               revenues and outlays. A more succinct analysis is
      (June 2010, revised August 2010). This publica-         presenting projections of Social Security’s finances,
      tion presents additional information about those
      projections.                                                                                                          3. For more information, see Congressional Budget Office,
                                                              2. See Kathleen Romig, Social Security: What Would Happen        Quantifying Uncertainty in the Analysis of Long-Term Social
      The budget projections published in The Long-              If the Trust Funds Ran Out? Report for Congress RL33514       Security Projections, Background Paper (November 2005).
      Term Budget Outlook involved two scenarios: The            (Congressional Research Service, updated August 20,           The methodology used here differs slightly from the
      first, CBO’s extended-baseline scenario, adheres           2009).                                                        techniques described in that report.


CBO
CBO’S 2010 LONG-TERM PROJECTIONS FOR SOCIAL SECURITY: ADDITIONAL INFORMATION   3


      given by measures that summarize the annual                        each group: Estimates for half of the people in the              differences are attributable to changes both in
      streams in a single number. The system’s finances                  group are lower and estimates for half are higher.               projected outlays and in projected revenues. The
      are also described by projecting what is called the                                                                                 75-year cost rate—a measure of outlays—is about
      trust fund ratio, the amount in the trust funds at                 Most retired and disabled workers receive Social                 2 percent higher under both scenarios because of
      the beginning of a year in proportion to the outlays               Security benefits on the basis of their own work his-            near-term economic weakness, slightly lower
      in that year.                                                      tory. This publication first presents measures of                projections of real (inflation-adjusted) growth in
                                                                         those benefits that do not include benefits received             wages, and technical changes in modeling meth-
      The Distribution of Benefits                                       by dependents or survivors who are entitled on the               ods. The projected 75-year income rate—a
                                                                         basis of another person’s work history. Then, for a              measure of Social Security’s revenues—is slightly
      In the second part (Exhibits 9 through 16), CBO
                                                                         more comprehensive perspective on the distribution               higher than CBO estimated in 2009 under the
      examines the program’s effects on people by
                                                                         of Social Security benefits, this analysis presents              extended-baseline scenario because income taxes
      grouping Social Security participants by various
                                                                         measures of the total amount of Social Security pay-             on benefits are projected to be higher as a share
      characteristics and presenting the average taxes and
                                                                         roll taxes that each participant pays over his or her            of benefits. However, the income rate is about
      benefits for those groups. In its analysis, CBO
                                                                         lifetime as well as the total Social Security bene-              1 percent lower than in 2009 under the alternative
      divided people into groups by the decade in which
                                                                         fits—including payments received as a worker’s                   fiscal scenario because income taxes on benefits are
      they were born and by the quintile of their lifetime
                                                                         dependent or survivors—that each receives over a                 projected to equal a smaller share of benefits.
      household earnings.4 For example, one 10-year
                                                                         lifetime.
      cohort consists of people born in the 1940s, and
      the top fifth of earners constitutes the highest earn-
      ings quintile. CBO’s modeling approach produces                                                                                     Related CBO Analyses
      estimates for individuals; household status is used
                                                                         Changes in CBO’s Long-Term                                       Further information about Social Security and
      only to place people into earnings groups.                         Social Security Projections                                      CBO’s projections is available in other CBO

      In this part of the analysis, benefits are calculated
                                                                         Since 2009                                                       publications:
                                                                         The shortfalls for Social Security that CBO is                       Various approaches to changing the program
      net of income taxes paid on benefits by higher-                                                                                     B
                                                                         currently projecting are larger than the shortfalls                  are presented in Social Security Policy Options
      income recipients and credited to the Social Secu-
                                                                         projected in CBO’s Long-Term Projections for Social
      rity trust funds.5 Median values are estimated for                                                                                      (July 2010).
                                                                         Security: 2009 Update (August 2009). The 75-year
                                                                         imbalance has increased from 1.3 percent to                      B   The current long-term projections are consis-
      4. Each person who lives at least to age 45 is ranked by life-     1.6 percent of taxable payroll under the extended-                   tent with the 10-year baseline CBO published
         time household earnings. Lifetime earnings for someone          baseline scenario (see Exhibit 5) and from 1.5 per-                  in A Preliminary Analysis of the President’s
         who is single in all years equals the present value of his or   cent to 2.1 percent of taxable payroll under the                     Budgetary Proposals for Fiscal Year 2011 (March
         her real earnings over a lifetime. In any year a person is
                                                                         alternative fiscal scenario (see Exhibit 6). Those                   2010). (Data in that report and in The Long-
         married, the earnings measure is a function of his or her
         earnings plus those of his or her spouse (adjusted for                                                                               Term Budget Outlook are generally presented for
         economies of scale in household consumption). A person’s        5. Benefits are not reduced by the portion of those income           fiscal years; this analysis and Social Security
         lifetime earnings consist of the present value of those            taxes that is credited to the Medicare Hospital Insurance         Policy Options use calendar-year data.)
         annual amounts.                                                    trust fund.


CBO
CBO’S 2010 LONG-TERM PROJECTIONS FOR SOCIAL SECURITY: ADDITIONAL INFORMATION       4


      B   The current projections update those in                 B   The methodology used to develop the projec-           B   Numerous other aspects of the program are
          CBO’s Long-Term Projections for Social Security:            tions in this publication is described in CBO’s           addressed in various publications available
          2009 Update. Differences in the two sets of                 Long-Term Model: An Overview, a background                from CBO’s Web site.
          projections are the result of newly available               paper published in June 2009.
          programmatic and economic data, updated
          assumptions about future economic trends, and           B   Appendix B of The Long-Term Budget Outlook
          improvements in models. This current set of                 offers an explanation of the values used for the
          projections also incorporates the effects of the            demographic and economic variables under-
          health care legislation passed in March 2010.6              lying the projections. (As was the case for
                                                                      CBO’s 2009 projections, the projections in this
                                                                                                                            7. See Social Security Administration, The 2009 Annual
                                                                      publication are based on the demographic                 Report of the Board of Trustees of the Federal Old-Age and
      6. The Patient Protection and Affordable Care Act (Public       assumptions of the 2009 report of the Social             Survivors Insurance and Federal Disability Insurance Trust
         Law 111-148) and the Health Care and Education               Security trustees.)7                                     Funds (May 12, 2009), www.ssa.gov/OACT/TR/2009/
         Reconciliation Act of 2010 (P.L. 111-152).                                                                            tr09.pdf.)


CBO
CBO’S 2010 LONG-TERM PROJECTIONS FOR SOCIAL SECURITY: ADDITIONAL INFORMATION   5


      Exhibit 1.
                                                                                                                            In 2009, Social Security’s total outlays (bene-
      Social Security Tax Revenues and Outlays, with Scheduled Benefits                                                     fits plus administrative costs) equaled 4.8 per-
                                                                                                                            cent of the country’s gross domestic product
      (Percentage of gross domestic product)
                                                                                                                            (GDP); tax revenues equaled 4.9 percent of
      9                                                                                                                     GDP. Most of the program’s tax revenues come
                              Actual    Projected
                                                                 Outlaysb                                                   from Social Security payroll taxes, although a
      8
                                                                                                                            small portion comes from income taxes on
      7                                                                                                                     benefits paid to higher-income beneficiaries.
                  Tax Revenuesa                                                                                             In addition to those tax revenues, the trust
      6
                                                                                                                            funds are credited with interest. Over the next
      5                                                                                                                     few years, outlays will approximately equal tax
                                                                                                                            revenues, CBO projects.
      4
                                                                    Tax Revenuesa                                           By 2034, as the baby-boom generation ages
      3                                                                                                                     and the number of beneficiaries grows, sched-
                 Outlaysb
      2                                                                                                                     uled spending will climb to 6.2 percent of
                                                                                                                            GDP, CBO estimates. Over the ensuing two
      1                                                                                                                     decades, spending will decline slightly, relative
      0
                                                                                                                            to the size of the economy, as people in the
       1985     1994        2003       2012     2021   2030      2039       2048    2057   2066      2075     2084          baby-boom generation die. Demographers
                                                                                                                            generally predict that life expectancy will con-
      Source: Congressional Budget Office.                                                                                  tinue to rise and that birth rates will remain as
      Note: The lines indicate CBO’s projections of expected outcomes. The shaded areas indicate the 80 percent             they are now, so scheduled outlays are pro-
            range of uncertainty.                                                                                           jected to resume their upward trajectory after
      a. Includes payroll taxes and income taxes on benefits.                                                               2050, reaching 6.4 percent of GDP in 2084.
      b. Includes scheduled benefits and administrative costs.                                                              The amount of tax revenues credited to the
                                                                                                                            trust funds is likely to stay almost constant as a
                                                                                                                            share of GDP over the next 75 years, edging
                                                                                                                            up from 4.9 percent of GDP in 2009 to
                                                                                                                            5.0 percent in 2084. CBO projects that
                                                                                                                            although people’s total compensation will be
                                                                                                                            nearly constant as a percentage of GDP,
                                                                                                                            taxable earnings will decline relative to GDP.
                                                                                                                            Revenues from payroll taxes thus will fall
                                                                                                                            slightly as a share of GDP, from 4.8 percent in
                                                                                                                                                                     (Continued)

CBO
CBO’S 2010 LONG-TERM PROJECTIONS FOR SOCIAL SECURITY: ADDITIONAL INFORMATION   6


      Exhibit 2.                                                                                                                 (Continued)

      Social Security Tax Revenues and Outlays, with Scheduled Benefits                                                          2009 to 4.4 percent in 2084. However, that
                                                                                                                                 drop will be offset by growth in the revenues
      (Percentage of gross domestic product)
                                                                                                                                 credited to the Social Security trust funds from
                              Actual                                          Projected                                          income taxes on the program’s benefits.
                              2009                     2034                     2059                     2084
      Tax Revenues             4.92                     4.93                     4.93                     4.99                   The uncertainty in these projections is illus-
      Outlays                  4.79                     6.18                     5.99                     6.37                   trated by the range of the outcomes from a
      Difference               0.13                    -1.25                    -1.06                    -1.37                   series of 500 simulations that vary most of the
                                                                                                                                 key demographic and economic factors in
                                            80 Percent Range of Uncertainty for CBO's Projections
                                                                                                                                 the analysis according to historical patterns.
      Tax Revenues                                    4.8 to 5.0               4.8 to 5.1               4.8 to 5.2
                                                                                                                                 Although CBO projects that the program’s
      Outlays                                         5.4 to 7.3               4.9 to 7.7               5.1 to 8.8
                                                                                                                                 outlays will equal 6.2 percent of GDP in 2034,
      Differencea                                    -2.3 to -0.5             -2.7 to 0.0              -3.9 to -0.3
                                                                                                                                 in 10 percent of the simulations outlays in
                                                                                                                                 2034 are below 5.4 percent of GDP and in
      Source: Congressional Budget Office.
                                                                                                                                 10 percent they exceed 7.3 percent of GDP.
      Note: Tax revenues consist of payroll taxes and income taxes on benefits that are credited to the Social Security          In most simulations, outlays in 2034 are pro-
            trust funds in the specified year. Outlays consist of scheduled benefits and administrative costs; scheduled         jected to account for a much larger share of
            benefits are benefits as calculated under the Social Security Act, regardless of the balances in the trust
                                                                                                                                 GDP than the current 4.8 percent.
            funds.
      a. The differences displayed generally do not equal the difference between the outlays and revenues shown                  Because payroll taxes are a fixed share of tax-
         because each value is drawn from a different simulation.                                                                able earnings and because earnings generally
                                                                                                                                 grow with GDP, there is less uncertainty about
                                                                                                                                 tax revenues as a share of GDP than there is
                                                                                                                                 about outlays. However, the range of uncer-
                                                                                                                                 tainty reported here—about half that shown in
                                                                                                                                 CBO’s Long-Term Projections for Social
                                                                                                                                 Security: 2009 Update—understates the true
                                                                                                                                 uncertainty. To incorporate the effects of the
                                                                                                                                 health care legislation enacted in March 2010,
                                                                                                                                 CBO updated its projections of the share of
                                                                                                                                 compensation that will be paid in wages sub-
                                                                                                                                 ject to payroll taxes. That change has not
                                                                                                                                 been incorporated into the uncertainty model,
                                                                                                                                 so—unlike CBO’s past publications—this
                                                                                                                                 publication’s uncertainty analysis does not
                                                                                                                                 account for variation in that share.

CBO
CBO’S 2010 LONG-TERM PROJECTIONS FOR SOCIAL SECURITY: ADDITIONAL INFORMATION   7


      Exhibit 3.
                                                                                                                                 Another perspective on the uncertainty in
      Percentage of Simulations in Which Social Security Outlays Exceed                                                          projections of Social Security’s finances
                                                                                                                                 involves the percentage of CBO’s simulations
      Tax Revenues by Specified Percentages, with Scheduled Benefits                                                             in which total outlays exceed tax revenues by a
      (Percent)                                                                                                                  given amount in a particular year. In the 500
              By 0 Percent of   By 1 Percent of   By 2 Percent of    By 3 Percent of   By 4 Percent of   By 5 Percent of         simulations, most of the key demographic and
               GDP or More       GDP or More       GDP or More        GDP or More       GDP or More       GDP or More            economic factors in the analysis vary according
      2020          86                 5                  0                 0                 0                  0               to historical patterns. In 99 percent of them,
      2030          99                63                 13                 1                 0                  0               outlays equal or exceed tax revenues in 2030.
      2040          98                66                 19                 3                 0                  0               Outlays are at least 1 percentage point of GDP
      2050          93                55                 19                 4                 1                  0               greater than tax revenues in 63 percent of sim-
      2060          91                56                 23                 8                 2                  0               ulations for that year and at least 2 percentage
      2070          92                61                 30                12                 4                  1               points greater in 13 percent of those simula-
      2080          93                68                 33                13                 6                  3               tions. The percentage of simulations in which
                                                                                                                                 outlays equal or exceed tax revenues is slightly
      Source: Congressional Budget Office.                                                                                       lower after 2035, when many members of the
      Notes: Tax revenues consist of payroll taxes and income taxes on benefits that are credited to the Social Security         baby-boom generation will have died, but that
             trust funds in the specified year. Outlays consist of scheduled benefits and administrative costs; scheduled        value is still above 90 percent. As uncertainty
             benefits are benefits as calculated under the Social Security Act, regardless of the balances in the trust          about outlays increases, the percentage of
             funds. This analysis is based on 500 simulations from CBO’s long-term model.                                        simulations in which outlays exceed tax reve-
             GDP = gross domestic product.                                                                                       nues by at least 2 percentage points of GDP
                                                                                                                                 rises, reaching 33 percent by 2080.


CBO
CBO’S 2010 LONG-TERM PROJECTIONS FOR SOCIAL SECURITY: ADDITIONAL INFORMATION   8


      Exhibit 4.
                                                                                                                                    The projected gap between outlays and reve-
      Social Security Tax Revenues and Outlays, with Scheduled and                                                                  nues ultimately will eliminate the balance in
                                                                                                                                    the trust funds and make it impossible, under
      Payable Benefits                                                                                                              current law, to pay the full amount of sched-
      (Percentage of gross domestic product)                                                                                        uled benefits. Payable benefits will equal
                                                                                                                                    scheduled benefits until the trust funds are
      7
                              Actual    Projected                                                                                   exhausted; after that, they will equal the Social
                                                                           Outlays with Scheduled Benefitsb
      6                                                                                                                             Security program’s annual revenues. In 2039—
                                                                                                                                    CBO’s projected date for the exhaustion of the
      5                                                                                                                             trust funds—revenues equal 79 percent of
                                                    Tax Revenuesa                                                                   scheduled outlays in CBO’s projections. Thus,
      4                                                                    Outlays with Payable Benefitsb
                       Outlaysb                                                                                                     payable benefits will be 21 percent lower than
                                                                                                                                    scheduled benefits. The gap between sched-
      3
                                                                                                                                    uled and payable benefits will then shrink
      2
                                                                                                                                    slightly for a decade, falling to 19 percent. It
                                                                                                                                    will then begin to widen slightly in about
      1                                                                                                                             2055, and by 2084, payable benefits will be
                                                                                                                                    24 percent smaller than scheduled benefits.
      0
      1985      1994       2003        2012     2021     2030       2039       2048       2057      2066      2075     2084

      Source: Congressional Budget Office.
      a. Includes payroll taxes and income taxes on benefits. Tax revenues shown are consistent with payable benefits
         and would decline slightly if the trust funds became exhausted because revenues from taxation of benefits
         would decline.
      b. Includes benefits and administrative costs.


CBO
CBO’S 2010 LONG-TERM PROJECTIONS FOR SOCIAL SECURITY: ADDITIONAL INFORMATION   9


      Exhibit 5.
                                                                                                                                    To present the results of long-term projections
      Summarized Financial Measures for Social Security Under the                                                                   succinctly, analysts often summarize scheduled
                                                                                                                                    outlays and revenues as a single number that
      Extended-Baseline Scenario, with Scheduled Benefits                                                                           covers a given period (for example, total out-
                                          As a Percentage of GDP                  As a Percentage of Taxable Payroll                lays over 75 years). The data are summarized
                                   Income          Cost        Actuarial         Income         Cost        Actuarial               by computing the present value of outlays or
                                     Rate          Rate        Balance             Rate         Rate         Balance                tax revenues for a period and dividing that fig-
                                                                    CBO's Projections                                               ure by the present value of the stream of GDP
                                                                                                                                    (or taxable payroll) over the same period.
      25 Years (2010–2034)           5.66          5.61           0.06            15.24          15.09             0.15
                                                                                                                                    (Present value is a single number that expresses
      50 Years (2010–2059)           5.34          5.77          -0.42            14.55          15.70            -1.15
      75 Years (2010–2084)           5.25          5.84          -0.60            14.39          16.03            -1.63             a flow of current and future income, or pay-
                                                                                                                                    ments, in terms of an equivalent lump sum
                                                                                                         a
                                                 80 Percent Range of Uncertainty for CBO's Projections                              received or paid today. That computation uses
      25 Years (2010–2034)        5.6 to 5.8     5.1 to 6.1    -0.4 to 0.4      15.0 to 15.6   13.9 to 16.4    -1.0 to 1.1          the interest rate used to compute interest cred-
      50 Years (2010–2059)        5.2 to 5.5     5.3 to 6.3    -0.9 to 0.0      14.3 to 14.8   14.5 to 17.2    -2.5 to -0.1         ited to the trust funds.) The income rate is the
      75 Years (2010–2084)        5.2 to 5.4     5.4 to 6.5    -1.2 to -0.2     14.2 to 14.7   14.8 to 17.8    -3.2 to -0.5         summarized measure of revenues, and the cost
                                                                                                                                    rate is the summarized measure of outlays. The
      Source: Congressional Budget Office.                                                                                          actuarial balance is the difference between
      Note: Over the relevant periods, the income rate is the present value of annual tax revenues (plus the initial trust          the income and cost rates.
            fund balance) and the cost rate is the present value of annual outlays (plus the present value of a year’s
                                                                                                                                    This analysis focuses on CBO’s extended-
            worth of benefits as a reserve at the end of the period), each divided by the present value of taxable
            payroll or gross domestic product (GDP). The actuarial balance is the difference between the income and
                                                                                                                                    baseline scenario, which adheres closely to cur-
            cost rates.                                                                                                             rent law. In that scenario, federal income tax
                                                                                                                                    rates would increase over time, and the
      a. The balances displayed generally do not equal the difference between the outlays and revenues shown
                                                                                                                                    estimated 75-year actuarial balance would be
         because each value is drawn from a different simulation.
                                                                                                                                    -0.6 percent of GDP or -1.6 percent of taxable
                                                                                                                                    payroll. That means, for example, that if the
                                                                                                                                    Social Security payroll tax rate was increased
                                                                                                                                    immediately and permanently by 1.6 percent-
                                                                                                                                    age points—from the current rate of 12.4 per-
                                                                                                                                    cent to 14.0 percent—or if scheduled benefits
                                                                                                                                    were reduced by an equivalent amount, then
                                                                                                                                    the trust funds’ projected balance at the end of
                                                                                                                                    2084 would equal projected outlays for 2085.


CBO
CBO’S 2010 LONG-TERM PROJECTIONS FOR SOCIAL SECURITY: ADDITIONAL INFORMATION   10


      Exhibit 6.
                                                                                                                                    This publication focuses mostly on CBO’s
      Summarized Financial Measures for Social Security Under the                                                                   extended-baseline scenario, which adheres
                                                                                                                                    closely to current law. CBO also has made
      Alternative Fiscal Scenario, with Scheduled Benefits                                                                          long-term budget projections using an alterna-
                                                                                                                                    tive fiscal scenario that incorporates several
                                          As a Percentage of GDP                  As a Percentage of Taxable Payroll
                                                                                                                                    changes to current law that are widely expected
                                   Income          Cost        Actuarial         Income         Cost        Actuarial
                                                                                                                                    to occur or that would modify some provisions
                                     Rate          Rate        Balance             Rate         Rate         Balance
                                                                                                                                    of law that might be difficult to sustain for a
                                                                    CBO's Projections
                                                                                                                                    long period. (Details of the two scenarios are
      25 Years (2010–2034)           5.62          5.62           0.00            15.09          15.09             0.00
                                                                                                                                    outlined in Table 1-1 of the 2010 edition of
      50 Years (2010–2059)           5.25          5.78          -0.54            14.24          15.69            -1.46
      75 Years (2010–2084)           5.11          5.86          -0.75            13.97          16.02            -2.06
                                                                                                                                    The Long-Term Budget Outlook.)

                                                 80 Percent Range of Uncertainty for CBO's Projectionsa                             The financial outlook for Social Security is less
      25 Years (2010–2034)        5.5 to 5.7     5.2 to 6.1    -0.4 to 0.4      14.8 to 15.4   13.9 to 16.4    -1.2 to 1.0
                                                                                                                                    favorable under the alternative fiscal scenario
      50 Years (2010–2059)        5.2 to 5.4     5.3 to 6.4    -1.0 to -0.2     14.0 to 14.5   14.5 to 17.2    -2.9 to -0.4         (shown in this exhibit) than under the
      75 Years (2010–2084)        5.0 to 5.2     5.4 to 6.5    -1.3 to -0.4     13.7 to 14.3   14.8 to 17.8    -3.6 to -1.0         extended-baseline scenario (shown in
                                                                                                                                    Exhibit 5). Income tax rates are assumed to be
      Source: Congressional Budget Office.                                                                                          lower under the alternative fiscal scenario,
                                                                                                                                    resulting in lower revenues from the taxation
      Note: Over the relevant periods, the income rate is the present value of annual tax revenues (plus the initial trust
            fund balance) and the cost rate is the present value of annual outlays (plus the present value of a year’s              of Social Security benefits and therefore a
            worth of benefits as a reserve at the end of the period), each divided by the present value of taxable                  lower Social Security income rate. Under the
            payroll or gross domestic product (GDP). The actuarial balance is the difference between the income and                 alternative fiscal scenario, the 75-year income
            cost rates.                                                                                                             rate is 5.11 percent of GDP, compared with a
      a. The balances displayed generally do not equal the difference between the outlays and revenues shown                        rate of 5.25 percent under the extended-
         because each value is drawn from a different simulation.                                                                   baseline scenario. As a result, the 75-year actu-
                                                                                                                                    arial deficit is larger: 0.75 percent of GDP
                                                                                                                                    under the alternative fiscal scenario, compared
                                                                                                                                    with a deficit of 0.60 percent of GDP under
                                                                                                                                    the extended-baseline scenario.


CBO
CBO’S 2010 LONG-TERM PROJECTIONS FOR SOCIAL SECURITY: ADDITIONAL INFORMATION   11


      Exhibit 7.
                                                                                                                                The trust fund ratio—the balance in the Social
      Trust Fund Ratio, with Scheduled Benefits                                                                                 Security trust funds at the beginning of the
                                                                                                                                year divided by the system’s outlays projected
       10
                                                                                                                                for that year—indicates the proportion of a
                              Actual    Projected                                                                               year’s cost that could be paid with the funds
        5                                                                                                                       available. The trust fund ratio for 2010 is 3.6,
                                                                                                                                but CBO projects that the ratio will decline
        0                                                                                                                       beginning in 2011, reaching zero in 2039; at
                                                                                                                                that point, payments to current and new bene-
       -5                                                                                                                       ficiaries would need to be reduced to make the
                                                                                                                                outlays from the funds equal to the revenues
      -10
                                                                                                                                flowing into the funds. The year in which the
                                                                                                                                trust funds will be exhausted could differ sig-
      -15
                                                                                                                                nificantly from CBO’s projection, however. In
                                                                                                                                10 percent of CBO’s simulations, the trust
                                                                                                                                funds will be exhausted in 2031 or earlier and
      -20
                                                                                                                                in 10 percent they will be exhausted in 2057
      -25
                                                                                                                                or later; in those simulations, most of the key
         1985     1994      2003       2012     2021     2030      2039     2048      2057      2066      2075     2084
                                                                                                                                demographic and economic factors in the anal-
                                                                                                                                ysis were varied according to historical pat-
      Source: Congressional Budget Office.                                                                                      terns. (The shaded area in the figure shows the
      Note: The trust fund ratio is the ratio of the trust fund balance (the amount in the trust funds) at the beginning        80 percent range of uncertainty. The inter-
            of a year to outlays in that year. Outlays consist of benefits and administrative costs. The trust funds are        section between the shaded area and the hori-
            exhausted when the trust fund ratio reaches zero. Under current law, the trust funds cannot incur negative          zontal line at zero, spanning the years between
            balances. The negative balances shown in this exhibit indicate a projected shortfall, reflecting the trust          2031 and 2057, corresponds to the 80 percent
            funds’ inability to pay scheduled benefits out of current-law revenues. The dark line indicates CBO’s               range of uncertainty about the year in which
            projection of expected outcomes; the shaded area indicates the 80 percent range of uncertainty around
                                                                                                                                the trust funds will become exhausted.) The
            the projection.
                                                                                                                                negative balances represent CBO’s estimates
                                                                                                                                of the cumulative amount of scheduled bene-
                                                                                                                                fits that cannot be paid from the program’s
                                                                                                                                current-law revenues (expressed as a ratio to
                                                                                                                                outlays in each year).


CBO
CBO’S 2010 LONG-TERM PROJECTIONS FOR SOCIAL SECURITY: ADDITIONAL INFORMATION   12


      Exhibit 8.
                                                                                                                     An alternative way to consider uncertainty is
      Percentage of Simulations That Show the Social Security                                                        to examine the percentage of simulations in
                                                                                                                     which the trust funds are exhausted by a
      Trust Funds Exhausted by a Particular Year                                                                     specific year. In those simulations, most of the
                                                                                                                     key demographic and economic factors in
      100
                                                                                                                     the analysis vary according to historical
                                                                                                                     patterns. In 37 percent of CBO’s simulations,
       80                                                                                                            the funds are exhausted before 2035. In
                                                                                                                     84 percent of the simulations, the trust funds
                                                                                                                     are exhausted by 2050. In 97 percent of the
       60
                                                                                                                     simulations, the trust funds are exhausted
                                                                                                                     by 2084.
       40


       20


        0
         2010    2016    2022    2028        2034   2040   2046   2052    2058   2064   2070   2076    2082

      Source: Congressional Budget Office.
      Note: The data are based on 500 simulations from CBO’s long-term model.


CBO
CBO’S 2010 LONG-TERM PROJECTIONS FOR SOCIAL SECURITY: ADDITIONAL INFORMATION   13


      Exhibit 9.
                                                                                                                                Future retired workers are likely to receive
      Median Initial Benefits for Retired Workers, with Scheduled and                                                           higher initial annual Social Security benefits
                                                                                                                                than today’s beneficiaries receive, even with
      Payable Benefits                                                                                                          payable benefits and even after an adjustment
      (Thousands of 2010 dollars)                                                                                               for the effects of inflation. With scheduled
                                                                                                                                benefits, the median initial benefit for each
                                               Lowest Quintile of         Middle Quintile of      Highest Quintile of
      10-Year                                 Lifetime Household         Lifetime Household       Lifetime Household
                                                                                                                                birth cohort is projected to be higher than that
      Birth         All Retired Workers             Earnings                   Earnings                 Earnings
                                                                                                                                for the preceding cohort. CBO considered a
      Cohort       Scheduled Payable         Scheduled Payable          Scheduled Payable        Scheduled Payable              hypothetical benefit amount: the median ben-
                                                                                                                                efit a worker would receive if everyone claimed
                                                                  All
                                                                                                                                benefits at age 65, based on earnings through
      1940s            17          17             9           9            19          19            25          25             age 61.
      1960s            18          18            11          11            20          20            31          31
      1980s            22          18            13          11            24          20            38          31             By itself, growth in average earnings leads to
      2000s            29          23            18          14            32          25            50          40             higher scheduled initial benefits. However,
                                                                                                                                under current law, the growth of initial bene-
                                                                  Men
                                                                                                                                fits for retired workers in several cohorts will
      1940s            21          21            10          10            22          22            27          27             be offset somewhat by the scheduled rise in the
      1960s            22          22            12          12            23          23            32          32             full retirement age, from 65 for people born
      1980s            25          21            14          12            27          22            40          33             before 1938 to 67 for those born after 1959.
      2000s            33          26            19          15            35          28            53          42             The effect is equivalent to a reduction in bene-
                                                               Women                                                            fits for any age at which benefits are claimed.
      1940s            13          13             8           8            14          14            21          21
                                                                                                                                Once the older retirement age is in place,
      1960s            16          16            10          10            17          17            26          26             median initial benefits will grow at approxi-
      1980s            19          15            13          10            21          17            33          27             mately the same rate as average earnings.
      2000s            25          20            16          13            28          22            45          36             When the trust funds are exhausted, payable
                                                                                                                                benefits will fall, CBO projects, but then they
      Source: Congressional Budget Office.                                                                                      will rise again as earnings (and therefore tax
      Note: Initial annual benefits are computed for all individuals who are eligible to claim retirement benefits at           revenues) grow. Initial payable benefits are
            age 62 and who have not yet claimed any other benefit. All workers are assumed to claim benefits at                 lower than scheduled benefits for people born
            age 65. All values are net of income taxes paid on benefits and credited to the Social Security trust funds.        in 1974 and later. Projected benefits are lower
                                                                                                                                for women than for men in all cohorts because
                                                                                                                                women have lower average earnings; the gap
                                                                                                                                narrows (as a share of average benefits) for later
                                                                                                                                cohorts because men’s and women’s earnings
                                                                                                                                are becoming more equal. For the 1940s
                                                                                                                                cohort, projected initial benefits for women
                                                                                                                                are about 40 percent below those for men, but
                                                                                                                                in the 1980s group they are about 25 percent
CBO                                                                                                                             below those for men.
CBO’S 2010 LONG-TERM PROJECTIONS FOR SOCIAL SECURITY: ADDITIONAL INFORMATION   14


      Exhibit 10.
                                                                                                                              Initial replacement rates—initial annual bene-
      Median Initial Replacement Rates for Retired Workers, with                                                              fits as a percentage of average annual lifetime
                                                                                                                              earnings—provide a perspective on retired
      Scheduled and Payable Benefits                                                                                          workers’ benefits that is different from that
      (Percent)                                                                                                               provided by looking simply at dollar amounts.
                                              Lowest Quintile of         Middle Quintile of     Highest Quintile of           The progressive nature of Social Security’s ben-
      10-Year                                 Lifetime Household        Lifetime Household      Lifetime Household
                                                                                                                              efit formula results in replacement rates that
      Birth         All Retired Workers             Earnings                  Earnings                Earnings
                                                                                                                              are higher for workers within a birth cohort
      Cohort       Scheduled Payable         Scheduled Payable         Scheduled Payable       Scheduled Payable
                                                                                                                              who have had lower earnings. With payable
                                                                 All
                                                                                                                              benefits, the replacement rate will drop notice-
      1940s            45         45            71          71            43          43           31          31             ably at all earnings amounts for people in the
      1960s            43         43            63          63            41          41           28          28             cohorts that first receive benefits after the trust
      1980s            44         36            63          53            42          34           28          23
                                                                                                                              funds are exhausted.
      2000s            42         33            62          50            41          33           26          21

                                                                 Men
                                                                                                                              The scheduled increase in the full retirement
                                                                                                                              age will lower the replacement rate for future
      1940s            40         40            64          64            39          39           25          25
                                                                                                                              beneficiaries (for any chosen age for claiming
      1960s            39         39            59          59            39          39           22          22
      1980s            40         33            59          50            40          33           23          19
                                                                                                                              benefits) compared with the rate for people
      2000s            39         31            57          47            39          31           22          17             who are claiming benefits now. In particular, if
                                                                                                                              Social Security benefits are paid as scheduled,
                                                              Women                                                           the median replacement rate for beneficiaries
      1940s            51         51            76          76            49          49           40          40             born in the 2000s (about 42 percent) will be
      1960s            47         47            67          67            45          45           37          37             slightly lower than the rate for beneficiaries
      1980s            48         39            68          56            45          37           36          30             born in the 1940s (about 45 percent), CBO
      2000s            46         36            66          53            44          35           34          27             estimates. People in later cohorts, however, are
                                                                                                                              expected to collect benefits for a longer time as
      Source: Congressional Budget Office.                                                                                    life expectancy increases.
      Note: The average initial replacement rate is a worker’s initial benefit as a percentage of a worker’s average
            annual lifetime earnings. (To compute lifetime earnings, past earnings are adjusted for average growth in         Because women tend to have lower lifetime
            economywide earnings.) Replacement rates are computed for all individuals who are eligible to claim               earnings, their average replacement rates are
            retirement benefits at age 62 and who have not yet claimed any other benefit. All workers are assumed to          higher than men’s are, especially for earlier
            claim benefits at age 65. All values are net of income taxes paid on benefits and credited to the Social          birth cohorts. The difference between women
            Security trust funds.                                                                                             and men in the highest quintile is large, in part
                                                                                                                              because that group includes many women who
                                                                                                                              spend time out of the labor force or who work
                                                                                                                              part time. In contrast, most men in households
                                                                                                                              with high earnings are employed full time.

CBO
CBO’S 2010 LONG-TERM PROJECTIONS FOR SOCIAL SECURITY: ADDITIONAL INFORMATION   15


      Exhibit 11.
                                                                                                                                Lifetime retirement benefits are the present
      Median Present Value of Lifetime Benefits for Retired Workers, with                                                       value, discounted to the year in which the ben-
                                                                                                                                eficiary turns 62, of all retired-worker benefits
      Scheduled and Payable Benefits                                                                                            that a worker receives from the program. CBO
      (Thousands of 2010 dollars)                                                                                               estimates that real median lifetime benefits for
                                              Lowest Quintile of          Middle Quintile of      Highest Quintile of           each birth cohort will be greater than those for
      10-Year                                 Lifetime Household         Lifetime Household       Lifetime Household            the preceding cohort, even with payable bene-
      Birth         All Retired Workers             Earnings                   Earnings                 Earnings                fits, because benefits grow with earnings. For
      Cohort       Scheduled Payable         Scheduled Payable          Scheduled Payable        Scheduled Payable              example, CBO estimates that median sched-
                                                                  All                                                           uled lifetime benefits for people born in the
      1940s           163         163            75          75           186         186           310         310             2000s will be almost double those for people
      1960s           194         180           100          95           215         200           390         356             born in the 1940s in real terms; median pay-
      1980s           232         188           124         104           266         215           481         395             able lifetime benefits for the 2000s cohort will
      2000s           322         247           166         133           366         281           660         515             be about 50 percent greater.
                                                                  Men                                                           The projected trends in median lifetime retire-
      1940s           197         197            77          77           219         219           352         352             ment benefits differ from the trends in median
      1960s           220         205           103          98           244         227           436         397             initial benefits for two reasons. First, as life
      1980s           261         212           132         108           295         240           542         445             expectancy increases, people will collect bene-
      2000s           363         277           175         137           405         311           730         570             fits for longer periods, so scheduled lifetime
                                                               Women                                                            benefits will grow faster than scheduled initial
      1940s           142         141            72          72           155         155           249         248             benefits. Second, although cohorts that begin
      1960s           175         162            96          91           192         177           320         291             to receive benefits before the trust funds are
      1980s           210         170           117          98           240         195           397         324             exhausted will collect their scheduled benefits,
      2000s           290         223           158         130           328         254           550         430             some members of those cohorts will still be
                                                                                                                                receiving benefits when the trust funds are
      Source: Congressional Budget Office.                                                                                      exhausted. At that point, payable benefits
      Note: Benefits are the present value of all retired-worker benefits received. To calculate their present value,           will decline, and the payable lifetime benefits
            benefits are adjusted for inflation (to produce constant dollars) and discounted to age 62. All values are          for those recipients will be less than their
            net of income taxes paid on benefits and credited to the Social Security trust funds.                               scheduled lifetime benefits.
                                                                                                                                Lifetime benefits are lower for women than for
                                                                                                                                men. However, the gap is smaller than it is
                                                                                                                                for initial benefits because women live longer,
                                                                                                                                on average, and thus tend to collect benefits
                                                                                                                                for a longer time.


CBO
CBO’S 2010 LONG-TERM PROJECTIONS FOR SOCIAL SECURITY: ADDITIONAL INFORMATION   16


      Exhibit 12.
                                                                                                                                          The projected trends for initial benefits for dis-
      Median Benefits and Initial Replacement Rates for                                                                                   abled workers and retired workers are similar
                                                                                                                                          (see also Exhibit 9): Future beneficiaries are
      Disabled Workers, with Scheduled and Payable Benefits                                                                               likely to receive higher initial annual benefits
                                                                                                        Present Value of
                                                                                                                                          than today’s beneficiaries receive. However, the
      10-Year                  Initial Benefits                   Initial Replacement                  Lifetime Benefitsb                 scheduled increase in the full retirement age—
      Birth              (Thousands of 2010 dollars)                Ratea (Percent)               (Thousands of 2010 dollars)             which will effectively reduce annual benefits
      Cohort              Scheduled        Payable             Scheduled         Payable           Scheduled        Payable               for retired workers—will have no direct effect
                                                               All Disabled Workers                                                       on people who receive disability benefits
                                                                                                                                          because they can receive those benefits in any
      1940s                    13               13                 47               47                 228              228
      1960s                    16               16                 52               52                 216              212               year before they reach the full retirement age.
      1980s                    19               17                 54               49                 288              247               Thus, CBO projects that real initial disability
      2000s                    24               20                 53               44                 428              335               benefits (scheduled and payable) will increase
                                                                                                                                          more rapidly than retirement benefits will.
                                                Workers Whose Disability Begins Before Age 40
      1940s                     *                *                  *                *                   *                *               Initial replacement rates tend to be higher for
      1960s                    10               10                 58               58                 250              250               disabled workers than for retired workers
      1980s                    12               12                 60               60                 447              437               (shown in Exhibit 10) because their earnings
      2000s                    16               15                 58               53                 640              538               tend to be lower. For the same reason, workers
                                          Workers Whose Disability Begins Between Ages 40 and 54                                          who become disabled at earlier ages tend to
                                                                                                                                          have lower benefits, but higher replacement
      1940s                     *                *                  *                *                   *                *
      1960s                    14               14                 53               53                 237              236               rates, than do those who become disabled
      1980s                    17               17                 55               54                 285              254               when they are older.
      2000s                    22               18                 55               45                 427              340
                                                                                                                                          The median present value of lifetime benefits
                               Workers Whose Disability Begins Between Age 55 and the Full Retirement Age                                 paid to disabled beneficiaries—including the
      1940s                    16               16                 48               48                 202              202               retirement benefits they receive after reaching
      1960s                    18               18                 50               50                 198              193               the full retirement age—is much greater than
      1980s                    22               18                 52               43                 266              215               the present value of lifetime benefits paid to
      2000s                    29               23                 51               41                 388              299               retired workers (shown in Exhibit 11), for two
                                                                                                                                          reasons. First, disabled beneficiaries are
      Source: Congressional Budget Office.                                                                                                younger when they begin to collect benefits, so
      Notes: Initial annual benefits and replacement rates are computed for all individuals who are projected to receive                  they receive them for a longer period, on aver-
             Disability Insurance worker benefits. All values are net of income taxes paid on benefits and credited to the                age, than retired workers do. Second, because
             Social Security trust funds.                                                                                                 benefits are received at younger ages, their
              * = no data are available for people who died before 1984.                                                                  present value is greater. As with retirement
      a. Initial annual benefits as a percentage of average annual lifetime earnings.                                                     benefits, projected lifetime disability benefits
      b. The present value of all disability benefits received plus retired-worker benefits received after the full retirement age.       are generally greater for each birth cohort than
         To calculate present value, benefits are adjusted for inflation (to produce constant dollars) and discounted to age 62.          for the preceding one.
CBO
Social Security Tax Revenues and Outlays Projected to Exceed Revenues Starting in 2016

Más contenido relacionado

La actualidad más candente

Analysis of Approaches to Reduce Federal Spending on Military Compensation
Analysis of Approaches to Reduce Federal Spending on Military CompensationAnalysis of Approaches to Reduce Federal Spending on Military Compensation
Analysis of Approaches to Reduce Federal Spending on Military CompensationCongressional Budget Office
 
The Financial Condition of the Pension Benefit Guaranty Corporation’s Multiem...
The Financial Condition of the Pension Benefit Guaranty Corporation’s Multiem...The Financial Condition of the Pension Benefit Guaranty Corporation’s Multiem...
The Financial Condition of the Pension Benefit Guaranty Corporation’s Multiem...Congressional Budget Office
 
Charts from CBO's August 2012 Budget and Economic Outlook
Charts from CBO's August 2012 Budget and Economic OutlookCharts from CBO's August 2012 Budget and Economic Outlook
Charts from CBO's August 2012 Budget and Economic OutlookCongressional Budget Office
 
The Status of the Highway Trust Fund and the Budgetary Treatment of Federal F...
The Status of the Highway Trust Fund and the Budgetary Treatment of Federal F...The Status of the Highway Trust Fund and the Budgetary Treatment of Federal F...
The Status of the Highway Trust Fund and the Budgetary Treatment of Federal F...Congressional Budget Office
 
Transportation Finance Proposals in the 113th Congress and Their Budgetary Im...
Transportation Finance Proposals in the 113th Congress and Their Budgetary Im...Transportation Finance Proposals in the 113th Congress and Their Budgetary Im...
Transportation Finance Proposals in the 113th Congress and Their Budgetary Im...Congressional Budget Office
 
The Status of Federal Housing Assistance for Low-Income Households
The Status of Federal Housing Assistance for Low-Income HouseholdsThe Status of Federal Housing Assistance for Low-Income Households
The Status of Federal Housing Assistance for Low-Income HouseholdsCongressional Budget Office
 
Modeling the budgetary cost of fha's single family mortgage insurance
Modeling the budgetary cost of fha's single family mortgage insuranceModeling the budgetary cost of fha's single family mortgage insurance
Modeling the budgetary cost of fha's single family mortgage insuranceCongressional Budget Office
 
The FAST Act and the Budgetary Treatment of Federal Financing Instruments
The FAST Act and the Budgetary Treatment of Federal Financing InstrumentsThe FAST Act and the Budgetary Treatment of Federal Financing Instruments
The FAST Act and the Budgetary Treatment of Federal Financing InstrumentsCongressional Budget Office
 
Approaches to Reducing Federal Spending on Military Pay and Benefits
Approaches to Reducing Federal Spending on Military Pay and BenefitsApproaches to Reducing Federal Spending on Military Pay and Benefits
Approaches to Reducing Federal Spending on Military Pay and BenefitsCongressional Budget Office
 
Trends in Operation and Maintenance Spending by the Department of Defense
Trends in Operation and Maintenance Spending by the Department of DefenseTrends in Operation and Maintenance Spending by the Department of Defense
Trends in Operation and Maintenance Spending by the Department of DefenseCongressional Budget Office
 
How CBO Uses Data for Budget Projections and Cost Estimates
How CBO Uses Data for Budget Projections and Cost EstimatesHow CBO Uses Data for Budget Projections and Cost Estimates
How CBO Uses Data for Budget Projections and Cost EstimatesCongressional Budget Office
 
Approaches to Reducing Federal Spending on National Defense
Approaches to Reducing Federal Spending on National DefenseApproaches to Reducing Federal Spending on National Defense
Approaches to Reducing Federal Spending on National DefenseCongressional Budget Office
 

La actualidad más candente (20)

Analysis of Approaches to Reduce Federal Spending on Military Compensation
Analysis of Approaches to Reduce Federal Spending on Military CompensationAnalysis of Approaches to Reduce Federal Spending on Military Compensation
Analysis of Approaches to Reduce Federal Spending on Military Compensation
 
The Financial Condition of the Pension Benefit Guaranty Corporation’s Multiem...
The Financial Condition of the Pension Benefit Guaranty Corporation’s Multiem...The Financial Condition of the Pension Benefit Guaranty Corporation’s Multiem...
The Financial Condition of the Pension Benefit Guaranty Corporation’s Multiem...
 
Charts from CBO's August 2012 Budget and Economic Outlook
Charts from CBO's August 2012 Budget and Economic OutlookCharts from CBO's August 2012 Budget and Economic Outlook
Charts from CBO's August 2012 Budget and Economic Outlook
 
Health Care and the Federal Budget
Health Care and the Federal BudgetHealth Care and the Federal Budget
Health Care and the Federal Budget
 
The Status of the Highway Trust Fund and the Budgetary Treatment of Federal F...
The Status of the Highway Trust Fund and the Budgetary Treatment of Federal F...The Status of the Highway Trust Fund and the Budgetary Treatment of Federal F...
The Status of the Highway Trust Fund and the Budgetary Treatment of Federal F...
 
Transportation Finance Proposals in the 113th Congress and Their Budgetary Im...
Transportation Finance Proposals in the 113th Congress and Their Budgetary Im...Transportation Finance Proposals in the 113th Congress and Their Budgetary Im...
Transportation Finance Proposals in the 113th Congress and Their Budgetary Im...
 
The Status of Federal Housing Assistance for Low-Income Households
The Status of Federal Housing Assistance for Low-Income HouseholdsThe Status of Federal Housing Assistance for Low-Income Households
The Status of Federal Housing Assistance for Low-Income Households
 
The Uncertainty of Long-Term Budget Projections
The Uncertainty of Long-Term Budget ProjectionsThe Uncertainty of Long-Term Budget Projections
The Uncertainty of Long-Term Budget Projections
 
Modeling the budgetary cost of fha's single family mortgage insurance
Modeling the budgetary cost of fha's single family mortgage insuranceModeling the budgetary cost of fha's single family mortgage insurance
Modeling the budgetary cost of fha's single family mortgage insurance
 
Overview of the Federal Budget
Overview of the Federal BudgetOverview of the Federal Budget
Overview of the Federal Budget
 
How CBO Promotes Integrity in Its Analyses
How CBO Promotes Integrity in Its AnalysesHow CBO Promotes Integrity in Its Analyses
How CBO Promotes Integrity in Its Analyses
 
The FAST Act and the Budgetary Treatment of Federal Financing Instruments
The FAST Act and the Budgetary Treatment of Federal Financing InstrumentsThe FAST Act and the Budgetary Treatment of Federal Financing Instruments
The FAST Act and the Budgetary Treatment of Federal Financing Instruments
 
Approaches to Reducing Federal Spending on Military Pay and Benefits
Approaches to Reducing Federal Spending on Military Pay and BenefitsApproaches to Reducing Federal Spending on Military Pay and Benefits
Approaches to Reducing Federal Spending on Military Pay and Benefits
 
CBO’s Analysis of Health Care Policy
CBO’s Analysis of Health Care PolicyCBO’s Analysis of Health Care Policy
CBO’s Analysis of Health Care Policy
 
Trends in Operation and Maintenance Spending by the Department of Defense
Trends in Operation and Maintenance Spending by the Department of DefenseTrends in Operation and Maintenance Spending by the Department of Defense
Trends in Operation and Maintenance Spending by the Department of Defense
 
CBO's Outlook for the Economy
CBO's Outlook for the EconomyCBO's Outlook for the Economy
CBO's Outlook for the Economy
 
CBO's Cost Estimates
CBO's Cost EstimatesCBO's Cost Estimates
CBO's Cost Estimates
 
How CBO Uses Data for Budget Projections and Cost Estimates
How CBO Uses Data for Budget Projections and Cost EstimatesHow CBO Uses Data for Budget Projections and Cost Estimates
How CBO Uses Data for Budget Projections and Cost Estimates
 
CBO’s Updated Budget Outlook
CBO’s Updated Budget OutlookCBO’s Updated Budget Outlook
CBO’s Updated Budget Outlook
 
Approaches to Reducing Federal Spending on National Defense
Approaches to Reducing Federal Spending on National DefenseApproaches to Reducing Federal Spending on National Defense
Approaches to Reducing Federal Spending on National Defense
 

Destacado

Responsive Navigation Patterns, UX and Guidelines
Responsive Navigation Patterns, UX and GuidelinesResponsive Navigation Patterns, UX and Guidelines
Responsive Navigation Patterns, UX and GuidelinesPeter Rozek
 
PhRMA STEM Education Factsheet 2014
PhRMA STEM Education Factsheet 2014PhRMA STEM Education Factsheet 2014
PhRMA STEM Education Factsheet 2014PhRMA
 
The value shift: Why CFOs should lead the charge in the digital age - Infogra...
The value shift: Why CFOs should lead the charge in the digital age - Infogra...The value shift: Why CFOs should lead the charge in the digital age - Infogra...
The value shift: Why CFOs should lead the charge in the digital age - Infogra...Deloitte United States
 
World Goodwill Conference- Diplomats Planet Global Initiative
World Goodwill Conference- Diplomats Planet Global Initiative World Goodwill Conference- Diplomats Planet Global Initiative
World Goodwill Conference- Diplomats Planet Global Initiative Diplomatrix
 
Customer-centric IT - Enterprise IT trends and investment 2013
Customer-centric IT - Enterprise IT trends and investment 2013Customer-centric IT - Enterprise IT trends and investment 2013
Customer-centric IT - Enterprise IT trends and investment 2013EY
 
Mayo Clinic Social Media Webcast
Mayo Clinic Social Media WebcastMayo Clinic Social Media Webcast
Mayo Clinic Social Media WebcastLee Aase
 
Social Media in Air Medical Transport
Social Media in Air Medical TransportSocial Media in Air Medical Transport
Social Media in Air Medical TransportLee Aase
 
Tweetcamp III
Tweetcamp IIITweetcamp III
Tweetcamp IIILee Aase
 
John Cain SXSW 2016 Sense and Respond
John Cain SXSW 2016 Sense and RespondJohn Cain SXSW 2016 Sense and Respond
John Cain SXSW 2016 Sense and RespondJohn Cain
 
SXSW 2012: We made this, and it's not an ad
SXSW 2012: We made this, and it's not an adSXSW 2012: We made this, and it's not an ad
SXSW 2012: We made this, and it's not an adDuncan/Channon
 
Your Voice, New Vision
Your Voice, New VisionYour Voice, New Vision
Your Voice, New VisionLee Aase
 
Medical Center Employee Relations Association
Medical Center Employee Relations AssociationMedical Center Employee Relations Association
Medical Center Employee Relations AssociationLee Aase
 
Beyond Asia - developed-markets perspectives – meeting the challenge of chang...
Beyond Asia - developed-markets perspectives – meeting the challenge of chang...Beyond Asia - developed-markets perspectives – meeting the challenge of chang...
Beyond Asia - developed-markets perspectives – meeting the challenge of chang...EY
 
A Heartbleed By Any Other Name - Data Driven Vulnerability Management
A Heartbleed By Any Other Name - Data Driven Vulnerability ManagementA Heartbleed By Any Other Name - Data Driven Vulnerability Management
A Heartbleed By Any Other Name - Data Driven Vulnerability ManagementMichael Roytman
 
E-Mental Health and Word of Mouth
E-Mental Health and Word of MouthE-Mental Health and Word of Mouth
E-Mental Health and Word of MouthLee Aase
 

Destacado (17)

Responsive Navigation Patterns, UX and Guidelines
Responsive Navigation Patterns, UX and GuidelinesResponsive Navigation Patterns, UX and Guidelines
Responsive Navigation Patterns, UX and Guidelines
 
Shifting Priorities in the Federal Budget
Shifting Priorities in the Federal BudgetShifting Priorities in the Federal Budget
Shifting Priorities in the Federal Budget
 
PhRMA STEM Education Factsheet 2014
PhRMA STEM Education Factsheet 2014PhRMA STEM Education Factsheet 2014
PhRMA STEM Education Factsheet 2014
 
The value shift: Why CFOs should lead the charge in the digital age - Infogra...
The value shift: Why CFOs should lead the charge in the digital age - Infogra...The value shift: Why CFOs should lead the charge in the digital age - Infogra...
The value shift: Why CFOs should lead the charge in the digital age - Infogra...
 
World Goodwill Conference- Diplomats Planet Global Initiative
World Goodwill Conference- Diplomats Planet Global Initiative World Goodwill Conference- Diplomats Planet Global Initiative
World Goodwill Conference- Diplomats Planet Global Initiative
 
Customer-centric IT - Enterprise IT trends and investment 2013
Customer-centric IT - Enterprise IT trends and investment 2013Customer-centric IT - Enterprise IT trends and investment 2013
Customer-centric IT - Enterprise IT trends and investment 2013
 
Mayo Clinic Social Media Webcast
Mayo Clinic Social Media WebcastMayo Clinic Social Media Webcast
Mayo Clinic Social Media Webcast
 
Social Media in Air Medical Transport
Social Media in Air Medical TransportSocial Media in Air Medical Transport
Social Media in Air Medical Transport
 
Tweetcamp III
Tweetcamp IIITweetcamp III
Tweetcamp III
 
John Cain SXSW 2016 Sense and Respond
John Cain SXSW 2016 Sense and RespondJohn Cain SXSW 2016 Sense and Respond
John Cain SXSW 2016 Sense and Respond
 
SXSW 2012: We made this, and it's not an ad
SXSW 2012: We made this, and it's not an adSXSW 2012: We made this, and it's not an ad
SXSW 2012: We made this, and it's not an ad
 
Market Pricing Basics
Market Pricing BasicsMarket Pricing Basics
Market Pricing Basics
 
Your Voice, New Vision
Your Voice, New VisionYour Voice, New Vision
Your Voice, New Vision
 
Medical Center Employee Relations Association
Medical Center Employee Relations AssociationMedical Center Employee Relations Association
Medical Center Employee Relations Association
 
Beyond Asia - developed-markets perspectives – meeting the challenge of chang...
Beyond Asia - developed-markets perspectives – meeting the challenge of chang...Beyond Asia - developed-markets perspectives – meeting the challenge of chang...
Beyond Asia - developed-markets perspectives – meeting the challenge of chang...
 
A Heartbleed By Any Other Name - Data Driven Vulnerability Management
A Heartbleed By Any Other Name - Data Driven Vulnerability ManagementA Heartbleed By Any Other Name - Data Driven Vulnerability Management
A Heartbleed By Any Other Name - Data Driven Vulnerability Management
 
E-Mental Health and Word of Mouth
E-Mental Health and Word of MouthE-Mental Health and Word of Mouth
E-Mental Health and Word of Mouth
 

Similar a Social Security Tax Revenues and Outlays Projected to Exceed Revenues Starting in 2016

The 2013 Long-Term Projections for Social Security: Additional Information
The 2013 Long-Term Projections for Social Security: Additional InformationThe 2013 Long-Term Projections for Social Security: Additional Information
The 2013 Long-Term Projections for Social Security: Additional InformationCongressional Budget Office
 
CONGRESS OF THE UNITED STATESCONGRESSIONAL BUDGET OFFICE
CONGRESS OF THE UNITED STATESCONGRESSIONAL BUDGET OFFICECONGRESS OF THE UNITED STATESCONGRESSIONAL BUDGET OFFICE
CONGRESS OF THE UNITED STATESCONGRESSIONAL BUDGET OFFICEAlleneMcclendon878
 
CBO: Its Role, Long-Term Projections, and Use of Research
CBO: Its Role, Long-Term Projections, and Use of ResearchCBO: Its Role, Long-Term Projections, and Use of Research
CBO: Its Role, Long-Term Projections, and Use of ResearchCongressional Budget Office
 
Pension & OPEB Funding Strategies for Illinois Public Plans
Pension & OPEB Funding Strategies for Illinois Public PlansPension & OPEB Funding Strategies for Illinois Public Plans
Pension & OPEB Funding Strategies for Illinois Public PlansJim van Iwaarden
 
The Alphabet Forest: OPEB, GASB and Pensions
The Alphabet Forest: OPEB, GASB and PensionsThe Alphabet Forest: OPEB, GASB and Pensions
The Alphabet Forest: OPEB, GASB and PensionsJim van Iwaarden
 
Comparing CBO’s Long-Term Projections With Those of the Social Security Trustees
Comparing CBO’s Long-Term Projections With Those of the Social Security TrusteesComparing CBO’s Long-Term Projections With Those of the Social Security Trustees
Comparing CBO’s Long-Term Projections With Those of the Social Security TrusteesCongressional Budget Office
 
A Brief Note On Pension And Pension Liability
A Brief Note On Pension And Pension LiabilityA Brief Note On Pension And Pension Liability
A Brief Note On Pension And Pension LiabilityMary Stevenson
 
Choices for Federal Spending and Taxes: CBO Director Doug Elmendorf's Goldman...
Choices for Federal Spending and Taxes: CBO Director Doug Elmendorf's Goldman...Choices for Federal Spending and Taxes: CBO Director Doug Elmendorf's Goldman...
Choices for Federal Spending and Taxes: CBO Director Doug Elmendorf's Goldman...Congressional Budget Office
 
Choices for Federal Spending and Taxes: CBO Director Doug Elmendorf's Present...
Choices for Federal Spending and Taxes: CBO Director Doug Elmendorf's Present...Choices for Federal Spending and Taxes: CBO Director Doug Elmendorf's Present...
Choices for Federal Spending and Taxes: CBO Director Doug Elmendorf's Present...Congressional Budget Office
 
HISIM2: The Health Insurance Simulation Model Used in Preparing CBO’s July 20...
HISIM2: The Health Insurance Simulation Model Used in Preparing CBO’s July 20...HISIM2: The Health Insurance Simulation Model Used in Preparing CBO’s July 20...
HISIM2: The Health Insurance Simulation Model Used in Preparing CBO’s July 20...Congressional Budget Office
 
Social Security Reform and the Joint Budget Committee Process
Social Security Reform and the Joint Budget Committee ProcessSocial Security Reform and the Joint Budget Committee Process
Social Security Reform and the Joint Budget Committee ProcessMercatus Center
 
CBO’s Role and Most Recent Long-Term Budget Projections
CBO’s Role and Most Recent Long-Term Budget ProjectionsCBO’s Role and Most Recent Long-Term Budget Projections
CBO’s Role and Most Recent Long-Term Budget ProjectionsCongressional Budget Office
 
Ss policystream
Ss policystreamSs policystream
Ss policystreamssok1990
 
2012 01-bis-the sustainability of pension schemes
2012 01-bis-the sustainability of pension schemes2012 01-bis-the sustainability of pension schemes
2012 01-bis-the sustainability of pension schemesJean-Baptiste Pethe
 

Similar a Social Security Tax Revenues and Outlays Projected to Exceed Revenues Starting in 2016 (20)

The 2013 Long-Term Projections for Social Security: Additional Information
The 2013 Long-Term Projections for Social Security: Additional InformationThe 2013 Long-Term Projections for Social Security: Additional Information
The 2013 Long-Term Projections for Social Security: Additional Information
 
CONGRESS OF THE UNITED STATESCONGRESSIONAL BUDGET OFFICE
CONGRESS OF THE UNITED STATESCONGRESSIONAL BUDGET OFFICECONGRESS OF THE UNITED STATESCONGRESSIONAL BUDGET OFFICE
CONGRESS OF THE UNITED STATESCONGRESSIONAL BUDGET OFFICE
 
CBO: Its Role, Long-Term Projections, and Use of Research
CBO: Its Role, Long-Term Projections, and Use of ResearchCBO: Its Role, Long-Term Projections, and Use of Research
CBO: Its Role, Long-Term Projections, and Use of Research
 
October 2009
October 2009October 2009
October 2009
 
Long-Term Budget Outlook
Long-Term Budget OutlookLong-Term Budget Outlook
Long-Term Budget Outlook
 
Pension & OPEB Funding Strategies for Illinois Public Plans
Pension & OPEB Funding Strategies for Illinois Public PlansPension & OPEB Funding Strategies for Illinois Public Plans
Pension & OPEB Funding Strategies for Illinois Public Plans
 
The Alphabet Forest: OPEB, GASB and Pensions
The Alphabet Forest: OPEB, GASB and PensionsThe Alphabet Forest: OPEB, GASB and Pensions
The Alphabet Forest: OPEB, GASB and Pensions
 
Comparing CBO’s Long-Term Projections With Those of the Social Security Trustees
Comparing CBO’s Long-Term Projections With Those of the Social Security TrusteesComparing CBO’s Long-Term Projections With Those of the Social Security Trustees
Comparing CBO’s Long-Term Projections With Those of the Social Security Trustees
 
A Brief Note On Pension And Pension Liability
A Brief Note On Pension And Pension LiabilityA Brief Note On Pension And Pension Liability
A Brief Note On Pension And Pension Liability
 
Choices for Federal Spending and Taxes: CBO Director Doug Elmendorf's Goldman...
Choices for Federal Spending and Taxes: CBO Director Doug Elmendorf's Goldman...Choices for Federal Spending and Taxes: CBO Director Doug Elmendorf's Goldman...
Choices for Federal Spending and Taxes: CBO Director Doug Elmendorf's Goldman...
 
Choices for Federal Spending and Taxes: CBO Director Doug Elmendorf's Present...
Choices for Federal Spending and Taxes: CBO Director Doug Elmendorf's Present...Choices for Federal Spending and Taxes: CBO Director Doug Elmendorf's Present...
Choices for Federal Spending and Taxes: CBO Director Doug Elmendorf's Present...
 
Perspective on the Employment Insurance System
Perspective on the Employment Insurance SystemPerspective on the Employment Insurance System
Perspective on the Employment Insurance System
 
HISIM2: The Health Insurance Simulation Model Used in Preparing CBO’s July 20...
HISIM2: The Health Insurance Simulation Model Used in Preparing CBO’s July 20...HISIM2: The Health Insurance Simulation Model Used in Preparing CBO’s July 20...
HISIM2: The Health Insurance Simulation Model Used in Preparing CBO’s July 20...
 
Social Security Reform and the Joint Budget Committee Process
Social Security Reform and the Joint Budget Committee ProcessSocial Security Reform and the Joint Budget Committee Process
Social Security Reform and the Joint Budget Committee Process
 
CBO’s Role and Most Recent Long-Term Budget Projections
CBO’s Role and Most Recent Long-Term Budget ProjectionsCBO’s Role and Most Recent Long-Term Budget Projections
CBO’s Role and Most Recent Long-Term Budget Projections
 
Ss policystream
Ss policystreamSs policystream
Ss policystream
 
2012 01-bis-the sustainability of pension schemes
2012 01-bis-the sustainability of pension schemes2012 01-bis-the sustainability of pension schemes
2012 01-bis-the sustainability of pension schemes
 
U.S. Macroeconomic & Fiscal Outlook
U.S. Macroeconomic & Fiscal OutlookU.S. Macroeconomic & Fiscal Outlook
U.S. Macroeconomic & Fiscal Outlook
 
Debunking 8 Social Security Myths on its 80th Birthday
Debunking 8 Social Security Myths on its 80th BirthdayDebunking 8 Social Security Myths on its 80th Birthday
Debunking 8 Social Security Myths on its 80th Birthday
 
CBO’s 10-Year Budget and Economic Projections
CBO’s 10-Year Budget and Economic ProjectionsCBO’s 10-Year Budget and Economic Projections
CBO’s 10-Year Budget and Economic Projections
 

Más de Congressional Budget Office

The U.S. Budget and Economic Outlook (Presentation)
The U.S. Budget and Economic Outlook (Presentation)The U.S. Budget and Economic Outlook (Presentation)
The U.S. Budget and Economic Outlook (Presentation)Congressional Budget Office
 
CBO’s Recent Appeals for New Research on Health-Related Topics
CBO’s Recent Appeals for New Research on Health-Related TopicsCBO’s Recent Appeals for New Research on Health-Related Topics
CBO’s Recent Appeals for New Research on Health-Related TopicsCongressional Budget Office
 
How the Congressional Budget Office Assists Lawmakers
How the Congressional Budget Office Assists LawmakersHow the Congressional Budget Office Assists Lawmakers
How the Congressional Budget Office Assists LawmakersCongressional Budget Office
 
Introduction to the Role of the Congressional Budget Office
Introduction to the Role of the Congressional Budget OfficeIntroduction to the Role of the Congressional Budget Office
Introduction to the Role of the Congressional Budget OfficeCongressional Budget Office
 
CBO’s Work on Health Care and a Call for New Research
CBO’s Work on Health Care and a Call for New ResearchCBO’s Work on Health Care and a Call for New Research
CBO’s Work on Health Care and a Call for New ResearchCongressional Budget Office
 
The Federal Perspective on Coverage of Medications to Treat Obesity: Consider...
The Federal Perspective on Coverage of Medications to Treat Obesity: Consider...The Federal Perspective on Coverage of Medications to Treat Obesity: Consider...
The Federal Perspective on Coverage of Medications to Treat Obesity: Consider...Congressional Budget Office
 
CBO’s Approach to Estimating the Budgetary Effects of the No Surprises Act of...
CBO’s Approach to Estimating the Budgetary Effects of the No Surprises Act of...CBO’s Approach to Estimating the Budgetary Effects of the No Surprises Act of...
CBO’s Approach to Estimating the Budgetary Effects of the No Surprises Act of...Congressional Budget Office
 
The Budget and Economic Outlook for 2024 to 2034: Press Briefing Slides
The Budget and Economic Outlook for 2024 to 2034: Press Briefing SlidesThe Budget and Economic Outlook for 2024 to 2034: Press Briefing Slides
The Budget and Economic Outlook for 2024 to 2034: Press Briefing SlidesCongressional Budget Office
 
The Economic Outlook for 2024 to 2034 in 19 Slides
The Economic Outlook for 2024 to 2034 in 19 SlidesThe Economic Outlook for 2024 to 2034 in 19 Slides
The Economic Outlook for 2024 to 2034 in 19 SlidesCongressional Budget Office
 
Using Multiple Data Sources to Learn About the Race and Ethnicity of Taxpayers
Using Multiple Data Sources to Learn About the Race and Ethnicity of TaxpayersUsing Multiple Data Sources to Learn About the Race and Ethnicity of Taxpayers
Using Multiple Data Sources to Learn About the Race and Ethnicity of TaxpayersCongressional Budget Office
 
Perspectives on the Navy’s 2024 Shipbuilding Plan
Perspectives on the Navy’s 2024 Shipbuilding PlanPerspectives on the Navy’s 2024 Shipbuilding Plan
Perspectives on the Navy’s 2024 Shipbuilding PlanCongressional Budget Office
 
The 2024 Outlook for Navy Shipbuilding: Familiar Plans and Higher Costs
The 2024 Outlook for Navy Shipbuilding: Familiar Plans and Higher CostsThe 2024 Outlook for Navy Shipbuilding: Familiar Plans and Higher Costs
The 2024 Outlook for Navy Shipbuilding: Familiar Plans and Higher CostsCongressional Budget Office
 
Exploring the Effects of Medicaid During Childhood on the Economy and the Budget
Exploring the Effects of Medicaid During Childhood on the Economy and the BudgetExploring the Effects of Medicaid During Childhood on the Economy and the Budget
Exploring the Effects of Medicaid During Childhood on the Economy and the BudgetCongressional Budget Office
 
Approaches to Estimating the Noncyclical Rate of Unemployment
 Approaches to Estimating the Noncyclical Rate of Unemployment Approaches to Estimating the Noncyclical Rate of Unemployment
Approaches to Estimating the Noncyclical Rate of UnemploymentCongressional Budget Office
 
CBO’s Analysis of the Long-Term Budgetary Outlook
CBO’s Analysis of the Long-Term Budgetary OutlookCBO’s Analysis of the Long-Term Budgetary Outlook
CBO’s Analysis of the Long-Term Budgetary OutlookCongressional Budget Office
 
Projecting the Effects of U.S. Federal Policies on Electric Vehicle Demand an...
Projecting the Effects of U.S. Federal Policies on Electric Vehicle Demand an...Projecting the Effects of U.S. Federal Policies on Electric Vehicle Demand an...
Projecting the Effects of U.S. Federal Policies on Electric Vehicle Demand an...Congressional Budget Office
 
CBO’s Recent Appeals for New Research to Enhance Its Work for the Congress
CBO’s Recent Appeals for New Research to Enhance Its Work for the CongressCBO’s Recent Appeals for New Research to Enhance Its Work for the Congress
CBO’s Recent Appeals for New Research to Enhance Its Work for the CongressCongressional Budget Office
 

Más de Congressional Budget Office (20)

The U.S. Budget and Economic Outlook (Presentation)
The U.S. Budget and Economic Outlook (Presentation)The U.S. Budget and Economic Outlook (Presentation)
The U.S. Budget and Economic Outlook (Presentation)
 
CBO’s Recent Appeals for New Research on Health-Related Topics
CBO’s Recent Appeals for New Research on Health-Related TopicsCBO’s Recent Appeals for New Research on Health-Related Topics
CBO’s Recent Appeals for New Research on Health-Related Topics
 
The Federal Budget and Health Care Policy
The Federal Budget and Health Care PolicyThe Federal Budget and Health Care Policy
The Federal Budget and Health Care Policy
 
How the Congressional Budget Office Assists Lawmakers
How the Congressional Budget Office Assists LawmakersHow the Congressional Budget Office Assists Lawmakers
How the Congressional Budget Office Assists Lawmakers
 
Introduction to the Role of the Congressional Budget Office
Introduction to the Role of the Congressional Budget OfficeIntroduction to the Role of the Congressional Budget Office
Introduction to the Role of the Congressional Budget Office
 
CBO’s Work on Health Care and a Call for New Research
CBO’s Work on Health Care and a Call for New ResearchCBO’s Work on Health Care and a Call for New Research
CBO’s Work on Health Care and a Call for New Research
 
The Federal Perspective on Coverage of Medications to Treat Obesity: Consider...
The Federal Perspective on Coverage of Medications to Treat Obesity: Consider...The Federal Perspective on Coverage of Medications to Treat Obesity: Consider...
The Federal Perspective on Coverage of Medications to Treat Obesity: Consider...
 
CBO’s Approach to Estimating the Budgetary Effects of the No Surprises Act of...
CBO’s Approach to Estimating the Budgetary Effects of the No Surprises Act of...CBO’s Approach to Estimating the Budgetary Effects of the No Surprises Act of...
CBO’s Approach to Estimating the Budgetary Effects of the No Surprises Act of...
 
The Budget and Economic Outlook for 2024 to 2034: Press Briefing Slides
The Budget and Economic Outlook for 2024 to 2034: Press Briefing SlidesThe Budget and Economic Outlook for 2024 to 2034: Press Briefing Slides
The Budget and Economic Outlook for 2024 to 2034: Press Briefing Slides
 
The Economic Outlook for 2024 to 2034 in 19 Slides
The Economic Outlook for 2024 to 2034 in 19 SlidesThe Economic Outlook for 2024 to 2034 in 19 Slides
The Economic Outlook for 2024 to 2034 in 19 Slides
 
Using Multiple Data Sources to Learn About the Race and Ethnicity of Taxpayers
Using Multiple Data Sources to Learn About the Race and Ethnicity of TaxpayersUsing Multiple Data Sources to Learn About the Race and Ethnicity of Taxpayers
Using Multiple Data Sources to Learn About the Race and Ethnicity of Taxpayers
 
Perspectives on the Navy’s 2024 Shipbuilding Plan
Perspectives on the Navy’s 2024 Shipbuilding PlanPerspectives on the Navy’s 2024 Shipbuilding Plan
Perspectives on the Navy’s 2024 Shipbuilding Plan
 
The 2024 Outlook for Navy Shipbuilding: Familiar Plans and Higher Costs
The 2024 Outlook for Navy Shipbuilding: Familiar Plans and Higher CostsThe 2024 Outlook for Navy Shipbuilding: Familiar Plans and Higher Costs
The 2024 Outlook for Navy Shipbuilding: Familiar Plans and Higher Costs
 
CBO’s Use of GitHub
CBO’s Use of GitHubCBO’s Use of GitHub
CBO’s Use of GitHub
 
Exploring the Effects of Medicaid During Childhood on the Economy and the Budget
Exploring the Effects of Medicaid During Childhood on the Economy and the BudgetExploring the Effects of Medicaid During Childhood on the Economy and the Budget
Exploring the Effects of Medicaid During Childhood on the Economy and the Budget
 
Atlas of Military Compensation
Atlas of Military CompensationAtlas of Military Compensation
Atlas of Military Compensation
 
Approaches to Estimating the Noncyclical Rate of Unemployment
 Approaches to Estimating the Noncyclical Rate of Unemployment Approaches to Estimating the Noncyclical Rate of Unemployment
Approaches to Estimating the Noncyclical Rate of Unemployment
 
CBO’s Analysis of the Long-Term Budgetary Outlook
CBO’s Analysis of the Long-Term Budgetary OutlookCBO’s Analysis of the Long-Term Budgetary Outlook
CBO’s Analysis of the Long-Term Budgetary Outlook
 
Projecting the Effects of U.S. Federal Policies on Electric Vehicle Demand an...
Projecting the Effects of U.S. Federal Policies on Electric Vehicle Demand an...Projecting the Effects of U.S. Federal Policies on Electric Vehicle Demand an...
Projecting the Effects of U.S. Federal Policies on Electric Vehicle Demand an...
 
CBO’s Recent Appeals for New Research to Enhance Its Work for the Congress
CBO’s Recent Appeals for New Research to Enhance Its Work for the CongressCBO’s Recent Appeals for New Research to Enhance Its Work for the Congress
CBO’s Recent Appeals for New Research to Enhance Its Work for the Congress
 

Último

Value Proposition canvas- Customer needs and pains
Value Proposition canvas- Customer needs and painsValue Proposition canvas- Customer needs and pains
Value Proposition canvas- Customer needs and painsP&CO
 
M.C Lodges -- Guest House in Jhang.
M.C Lodges --  Guest House in Jhang.M.C Lodges --  Guest House in Jhang.
M.C Lodges -- Guest House in Jhang.Aaiza Hassan
 
Russian Faridabad Call Girls(Badarpur) : ☎ 8168257667, @4999
Russian Faridabad Call Girls(Badarpur) : ☎ 8168257667, @4999Russian Faridabad Call Girls(Badarpur) : ☎ 8168257667, @4999
Russian Faridabad Call Girls(Badarpur) : ☎ 8168257667, @4999Tina Ji
 
Insurers' journeys to build a mastery in the IoT usage
Insurers' journeys to build a mastery in the IoT usageInsurers' journeys to build a mastery in the IoT usage
Insurers' journeys to build a mastery in the IoT usageMatteo Carbone
 
Understanding the Pakistan Budgeting Process: Basics and Key Insights
Understanding the Pakistan Budgeting Process: Basics and Key InsightsUnderstanding the Pakistan Budgeting Process: Basics and Key Insights
Understanding the Pakistan Budgeting Process: Basics and Key Insightsseri bangash
 
BEST ✨ Call Girls In Indirapuram Ghaziabad ✔️ 9871031762 ✔️ Escorts Service...
BEST ✨ Call Girls In  Indirapuram Ghaziabad  ✔️ 9871031762 ✔️ Escorts Service...BEST ✨ Call Girls In  Indirapuram Ghaziabad  ✔️ 9871031762 ✔️ Escorts Service...
BEST ✨ Call Girls In Indirapuram Ghaziabad ✔️ 9871031762 ✔️ Escorts Service...noida100girls
 
The Coffee Bean & Tea Leaf(CBTL), Business strategy case study
The Coffee Bean & Tea Leaf(CBTL), Business strategy case studyThe Coffee Bean & Tea Leaf(CBTL), Business strategy case study
The Coffee Bean & Tea Leaf(CBTL), Business strategy case studyEthan lee
 
MONA 98765-12871 CALL GIRLS IN LUDHIANA LUDHIANA CALL GIRL
MONA 98765-12871 CALL GIRLS IN LUDHIANA LUDHIANA CALL GIRLMONA 98765-12871 CALL GIRLS IN LUDHIANA LUDHIANA CALL GIRL
MONA 98765-12871 CALL GIRLS IN LUDHIANA LUDHIANA CALL GIRLSeo
 
Call Girls Pune Just Call 9907093804 Top Class Call Girl Service Available
Call Girls Pune Just Call 9907093804 Top Class Call Girl Service AvailableCall Girls Pune Just Call 9907093804 Top Class Call Girl Service Available
Call Girls Pune Just Call 9907093804 Top Class Call Girl Service AvailableDipal Arora
 
Progress Report - Oracle Database Analyst Summit
Progress  Report - Oracle Database Analyst SummitProgress  Report - Oracle Database Analyst Summit
Progress Report - Oracle Database Analyst SummitHolger Mueller
 
Regression analysis: Simple Linear Regression Multiple Linear Regression
Regression analysis:  Simple Linear Regression Multiple Linear RegressionRegression analysis:  Simple Linear Regression Multiple Linear Regression
Regression analysis: Simple Linear Regression Multiple Linear RegressionRavindra Nath Shukla
 
Ensure the security of your HCL environment by applying the Zero Trust princi...
Ensure the security of your HCL environment by applying the Zero Trust princi...Ensure the security of your HCL environment by applying the Zero Trust princi...
Ensure the security of your HCL environment by applying the Zero Trust princi...Roland Driesen
 
Cash Payment 9602870969 Escort Service in Udaipur Call Girls
Cash Payment 9602870969 Escort Service in Udaipur Call GirlsCash Payment 9602870969 Escort Service in Udaipur Call Girls
Cash Payment 9602870969 Escort Service in Udaipur Call GirlsApsara Of India
 
Keppel Ltd. 1Q 2024 Business Update Presentation Slides
Keppel Ltd. 1Q 2024 Business Update  Presentation SlidesKeppel Ltd. 1Q 2024 Business Update  Presentation Slides
Keppel Ltd. 1Q 2024 Business Update Presentation SlidesKeppelCorporation
 
It will be International Nurses' Day on 12 May
It will be International Nurses' Day on 12 MayIt will be International Nurses' Day on 12 May
It will be International Nurses' Day on 12 MayNZSG
 
VIP Call Girl Jamshedpur Aashi 8250192130 Independent Escort Service Jamshedpur
VIP Call Girl Jamshedpur Aashi 8250192130 Independent Escort Service JamshedpurVIP Call Girl Jamshedpur Aashi 8250192130 Independent Escort Service Jamshedpur
VIP Call Girl Jamshedpur Aashi 8250192130 Independent Escort Service JamshedpurSuhani Kapoor
 
HONOR Veterans Event Keynote by Michael Hawkins
HONOR Veterans Event Keynote by Michael HawkinsHONOR Veterans Event Keynote by Michael Hawkins
HONOR Veterans Event Keynote by Michael HawkinsMichael W. Hawkins
 

Último (20)

Value Proposition canvas- Customer needs and pains
Value Proposition canvas- Customer needs and painsValue Proposition canvas- Customer needs and pains
Value Proposition canvas- Customer needs and pains
 
M.C Lodges -- Guest House in Jhang.
M.C Lodges --  Guest House in Jhang.M.C Lodges --  Guest House in Jhang.
M.C Lodges -- Guest House in Jhang.
 
Russian Faridabad Call Girls(Badarpur) : ☎ 8168257667, @4999
Russian Faridabad Call Girls(Badarpur) : ☎ 8168257667, @4999Russian Faridabad Call Girls(Badarpur) : ☎ 8168257667, @4999
Russian Faridabad Call Girls(Badarpur) : ☎ 8168257667, @4999
 
Insurers' journeys to build a mastery in the IoT usage
Insurers' journeys to build a mastery in the IoT usageInsurers' journeys to build a mastery in the IoT usage
Insurers' journeys to build a mastery in the IoT usage
 
Understanding the Pakistan Budgeting Process: Basics and Key Insights
Understanding the Pakistan Budgeting Process: Basics and Key InsightsUnderstanding the Pakistan Budgeting Process: Basics and Key Insights
Understanding the Pakistan Budgeting Process: Basics and Key Insights
 
BEST ✨ Call Girls In Indirapuram Ghaziabad ✔️ 9871031762 ✔️ Escorts Service...
BEST ✨ Call Girls In  Indirapuram Ghaziabad  ✔️ 9871031762 ✔️ Escorts Service...BEST ✨ Call Girls In  Indirapuram Ghaziabad  ✔️ 9871031762 ✔️ Escorts Service...
BEST ✨ Call Girls In Indirapuram Ghaziabad ✔️ 9871031762 ✔️ Escorts Service...
 
The Coffee Bean & Tea Leaf(CBTL), Business strategy case study
The Coffee Bean & Tea Leaf(CBTL), Business strategy case studyThe Coffee Bean & Tea Leaf(CBTL), Business strategy case study
The Coffee Bean & Tea Leaf(CBTL), Business strategy case study
 
MONA 98765-12871 CALL GIRLS IN LUDHIANA LUDHIANA CALL GIRL
MONA 98765-12871 CALL GIRLS IN LUDHIANA LUDHIANA CALL GIRLMONA 98765-12871 CALL GIRLS IN LUDHIANA LUDHIANA CALL GIRL
MONA 98765-12871 CALL GIRLS IN LUDHIANA LUDHIANA CALL GIRL
 
Call Girls Pune Just Call 9907093804 Top Class Call Girl Service Available
Call Girls Pune Just Call 9907093804 Top Class Call Girl Service AvailableCall Girls Pune Just Call 9907093804 Top Class Call Girl Service Available
Call Girls Pune Just Call 9907093804 Top Class Call Girl Service Available
 
Progress Report - Oracle Database Analyst Summit
Progress  Report - Oracle Database Analyst SummitProgress  Report - Oracle Database Analyst Summit
Progress Report - Oracle Database Analyst Summit
 
Regression analysis: Simple Linear Regression Multiple Linear Regression
Regression analysis:  Simple Linear Regression Multiple Linear RegressionRegression analysis:  Simple Linear Regression Multiple Linear Regression
Regression analysis: Simple Linear Regression Multiple Linear Regression
 
Ensure the security of your HCL environment by applying the Zero Trust princi...
Ensure the security of your HCL environment by applying the Zero Trust princi...Ensure the security of your HCL environment by applying the Zero Trust princi...
Ensure the security of your HCL environment by applying the Zero Trust princi...
 
Cash Payment 9602870969 Escort Service in Udaipur Call Girls
Cash Payment 9602870969 Escort Service in Udaipur Call GirlsCash Payment 9602870969 Escort Service in Udaipur Call Girls
Cash Payment 9602870969 Escort Service in Udaipur Call Girls
 
Keppel Ltd. 1Q 2024 Business Update Presentation Slides
Keppel Ltd. 1Q 2024 Business Update  Presentation SlidesKeppel Ltd. 1Q 2024 Business Update  Presentation Slides
Keppel Ltd. 1Q 2024 Business Update Presentation Slides
 
It will be International Nurses' Day on 12 May
It will be International Nurses' Day on 12 MayIt will be International Nurses' Day on 12 May
It will be International Nurses' Day on 12 May
 
VIP Call Girl Jamshedpur Aashi 8250192130 Independent Escort Service Jamshedpur
VIP Call Girl Jamshedpur Aashi 8250192130 Independent Escort Service JamshedpurVIP Call Girl Jamshedpur Aashi 8250192130 Independent Escort Service Jamshedpur
VIP Call Girl Jamshedpur Aashi 8250192130 Independent Escort Service Jamshedpur
 
HONOR Veterans Event Keynote by Michael Hawkins
HONOR Veterans Event Keynote by Michael HawkinsHONOR Veterans Event Keynote by Michael Hawkins
HONOR Veterans Event Keynote by Michael Hawkins
 
Forklift Operations: Safety through Cartoons
Forklift Operations: Safety through CartoonsForklift Operations: Safety through Cartoons
Forklift Operations: Safety through Cartoons
 
VVVIP Call Girls In Greater Kailash ➡️ Delhi ➡️ 9999965857 🚀 No Advance 24HRS...
VVVIP Call Girls In Greater Kailash ➡️ Delhi ➡️ 9999965857 🚀 No Advance 24HRS...VVVIP Call Girls In Greater Kailash ➡️ Delhi ➡️ 9999965857 🚀 No Advance 24HRS...
VVVIP Call Girls In Greater Kailash ➡️ Delhi ➡️ 9999965857 🚀 No Advance 24HRS...
 
Nepali Escort Girl Kakori \ 9548273370 Indian Call Girls Service Lucknow ₹,9517
Nepali Escort Girl Kakori \ 9548273370 Indian Call Girls Service Lucknow ₹,9517Nepali Escort Girl Kakori \ 9548273370 Indian Call Girls Service Lucknow ₹,9517
Nepali Escort Girl Kakori \ 9548273370 Indian Call Girls Service Lucknow ₹,9517
 

Social Security Tax Revenues and Outlays Projected to Exceed Revenues Starting in 2016

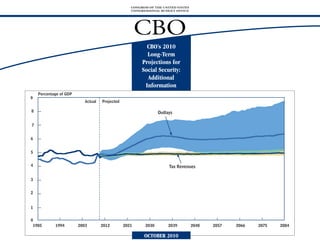
  • 1. CONGRESS OF THE UNITED STATES CONGRESSIONAL BUDGET OFFICE CBO CBO’s 2010 Long-Term Projections for Social Security: Additional Information Percentage of GDP 9 Actual Projected 8 Outlays 7 6 5 4 Tax Revenues 3 2 1 0 1985 1994 2003 2012 2021 2030 2039 2048 2057 2066 2075 2084 OCTOBER 2010
  • 3. CBO CBO’s 2010 Long-Term Projections for Social Security: Additional Information October 2010 The Congress of the United States O Congressional Budget Office
  • 4. Notes and Definitions Unless otherwise noted, all years referred to are calendar years. Numbers in the text and tables may not add up to totals because of rounding. Supplemental data are posted on CBO’s Web site (www.cbo.gov). 80 percent range of uncertainty: A range of uncertainty based on a distribution of 500 simulations from CBO’s long-term model. Outcomes were above the range in 10 percent of the simulations, below the range in 10 percent, and within the range in 80 percent. Median: The middle of the distribution. When the median outcome for a group of people (defined in this document by birth cohort and lifetime earnings category) is shown, the value is lower for half of the people in that group and higher for half of the group. Present value: A single number that expresses a flow of current and future income, or payments, in terms of an equivalent lump sum received or paid today. Cost rate: The present value of outlays for a period, plus the present value of a year’s worth of benefits as a reserve at the end of the period, divided by the present value of the stream of gross domestic product (or taxable payroll) over the same period. Income rate: The present value of tax revenues for a period, plus the trust funds’ initial balance, divided by the present value of the stream of gross domestic product (or taxable payroll) over the same period. Actuarial balance: The difference between the income rate and the cost rate. Scheduled benefits: Full benefits as calculated under current law, regardless of the amounts available in the Social Security trust funds. Payable benefits: Benefits as calculated under current law, reduced as necessary to make outlays equal the Social Security system’s revenues. Upon exhaustion of the Social Security trust funds, the Social Security Administration would reduce all scheduled benefits such that outlays from the funds would equal revenues flowing into the funds. CBO
  • 5. Preface T his Congressional Budget Office (CBO) publication provides additional information about long-term projections of the Social Security program’s finances that were included in The Long-Term Budget Outlook (June 2010, revised August 2010) and in Social Security Policy Options (July 2010). Those projections, which cover the 75-year period spanning 2010 to 2084, and the additional information presented in this document update projections CBO prepared last year and reported in CBO’s Long-Term Projections for Social Security: 2009 Update. The analysis was prepared by Noah Meyerson, Charles Pineles-Mark, Jonathan Schwabish, Michael Simpson, and Julie Topoleski of CBO’s Long-Term Modeling Group under the supervision of Joyce Manchester. Kate Kelly edited the document and Sherry Snyder proofread it. Maureen Costantino designed the cover and, with assistance from Jeanine Rees, prepared the document for publication. Monte Ruffin produced the initial printed copies, Linda Schimmel handled the print distribution, and Simone Thomas produced the electronic version for CBO’s Web site (www.cbo.gov). Douglas W. Elmendorf Director October 2010 CBO
  • 6. List of Exhibits Exhibit Page 1. Social Security Tax Revenues and Outlays, with Scheduled Benefits (Figure) 5 2. Social Security Tax Revenues and Outlays, with Scheduled Benefits (Table) 6 3. Percentage of Simulations in Which Social Security Outlays Exceed Tax Revenues by Specified Percentages, with Scheduled Benefits 7 4. Social Security Tax Revenues and Outlays, with Scheduled and Payable Benefits 8 5. Summarized Financial Measures for Social Security Under the Extended-Baseline Scenario, with Scheduled Benefits 9 6. Summarized Financial Measures for Social Security Under the Alternative Fiscal Scenario, with Scheduled Benefits 10 7. Trust Fund Ratio, with Scheduled Benefits 11 8. Percentage of Simulations That Show the Social Security Trust Funds Exhausted by a Particular Year 12 9. Median Initial Benefits for Retired Workers, with Scheduled and Payable Benefits 13 10. Median Initial Replacement Rates for Retired Workers, with Scheduled and Payable Benefits 14 11. Median Present Value of Lifetime Benefits for Retired Workers, with Scheduled and Payable Benefits 15 12. Median Benefits and Initial Replacement Rates for Disabled Workers, with Scheduled and Payable Benefits 16 13. Potential Range of Lifetime Social Security Payroll Taxes 17 14. Potential Range of Lifetime Social Security Benefits, with Scheduled and Payable Benefits 18 15. Potential Range of Lifetime Benefit-to-Tax Ratios, with Scheduled and Payable Benefits 19 16. Percentage of Simulations in Which Payable Benefits Exceed Specified Percentages of Scheduled Benefits 20 CBO
  • 7. CBO’s 2010 Long-Term Projections for Social Security: Additional Information Social Security is the federal government’s largest employers at 6.2 percent apiece. Self-employed the enactment of the Social Security Amendments single program.1 About 54 million people currently workers pay the entire 12.4 percent tax on earnings of 1983. Over the next few years, the Congressional receive Social Security benefits. About 69 percent themselves. The payroll tax applies only to taxable Budget Office (CBO) projects, the program’s tax are retired workers, their spouses, and children and earnings—earnings up to a maximum annual revenues will be approximately equal to its outlays. another 12 percent are survivors of deceased work- amount ($106,800 in 2010). Some Social Security However, as more of the baby-boom generation ers; all of those beneficiaries receive payments benefits also are subject to taxation: In fiscal year (that is, people born between 1946 and 1964) through Old-Age and Survivors Insurance (OASI). 2010, about 3 percent of Social Security’s tax reve- enters retirement, outlays will increase relative to The other 19 percent are disabled workers or their nues came from the income taxes that higher- the size of the economy, whereas tax revenues spouses and children; they receive Disability Insur- income beneficiaries paid on their Social Security will remain at an almost constant share of the econ- ance (DI) benefits. Social Security’s outlays in fiscal benefits. Tax revenues credited to the program omy. Starting in 2016, CBO projects, outlays as year 2010 totaled $706 billion, one-fifth of the totaled $670 billion in that year. scheduled under current law will regularly exceed federal budget; OASI payments accounted for tax revenues. 82 percent of those outlays and DI payments made Revenues from taxes, along with intragovern- up about 18 percent. mental interest payments, are credited to Social CBO projects that the DI trust fund will be Security’s two trust funds—one for OASI and one exhausted in 2018 and that the OASI trust fund Social Security has two primary sources of tax reve- for DI—and the program’s benefits and adminis- will be exhausted in 2042. Once a trust fund’s bal- nues: payroll taxes and income taxes on benefits. In trative costs are paid from those funds. Legally, the ance has fallen to zero and current revenues are fiscal year 2010, roughly 97 percent of tax revenues funds are separate, but they often are described insufficient to cover the benefits that are specified dedicated to Social Security were collected from a collectively as the OASDI trust funds. In a given in law, a program will be unable to pay full benefits payroll tax of 12.4 percent that is levied on year, the sum of receipts to a fund along with the without changes in law. The DI trust fund came earnings and split evenly by workers and their interest that is credited on previous balances, less close to exhaustion in 1994, but that outcome was spending for benefits and administrative costs, prevented by legislation that redirected revenue constitutes that fund’s surplus or deficit. from the OASI trust fund to the DI trust fund. In 1. For a description of the Social Security program, see part because of that experience, it is a common Congressional Budget Office, Social Security Policy Options In calendar year 2010, Social Security’s outlays will (July 2010), “An Overview of Social Security,” pp.1–4. analytical convention to consider the DI and OASI exceed tax revenues (that is, the trust funds’ trust funds as combined. CBO projects that, if leg- Social Security’s financing and trust funds are discussed on pp. 3–5 of that study. receipts excluding interest) for the first time since islation to shift resources from the OASI trust fund CBO
  • 8. CBO’S 2010 LONG-TERM PROJECTIONS FOR SOCIAL SECURITY: ADDITIONAL INFORMATION 2 to the DI trust fund was enacted, the combined closely to current law. For example, that scenario CBO generally focuses on scheduled benefits OASDI trust funds would be exhausted in 2039. reflects the assumption that the tax cuts enacted in because, by definition, the system would be fully 2001 and 2003 expire as scheduled at the end of financed if only payable benefits are disbursed. The amount of Social Security taxes paid by vari- 2010. CBO also has developed an alternative fiscal ous groups of people differs, as do the benefits that scenario, which incorporates several changes to Quantifying Uncertainty different groups receive. For example, people with current law that are widely expected to occur or To quantify the amount of uncertainty in its Social higher earnings pay more in Social Security payroll that would modify some provisions of law that Security projections, CBO created a distribution of taxes than do lower-earning participants, and they might be difficult to sustain for a long period. outcomes from 500 simulations using its long-term also receive larger benefits (although not propor- Unless otherwise noted, the projections presented model. In those simulations, the assumed values for tionately larger). Because of the progressive nature in this analysis are based on the assumptions of the most of the key demographic and economic factors of Social Security’s benefit formula, replacement extended-baseline scenario. In that scenario, that underlie the analysis—for example, fertility rates—the amount of annual benefits as a percent- income taxes, including the income taxes on Social and mortality rates, interest rates, and the rate of age of annual lifetime earnings—are lower, on Security benefits that are credited to the trust growth of productivity—were varied on the basis average, for workers who have had higher earnings. funds, are higher than they are in the alternative of historical patterns of variation.3 Several of the As another example, the amount of taxes paid and fiscal scenario. exhibits in this publication show the simulations’ benefits received will be greater for people in later 80 percent range of uncertainty: That is, in 80 per- birth cohorts because they typically will have Scheduled and Payable Benefits cent of the 500 simulations, the value in question higher earnings over a lifetime, even after adjusting CBO prepared two types of benefit projections. fell within the range shown; in 10 percent of the for inflation, CBO projects. However, replacement Benefits as calculated under the Social Security simulations, the values were above that range; rates will be slightly lower, on average, for people Act, regardless of the balances in the trust funds, and in 10 percent they were below. Long-term in later birth groups because their full retirement are called scheduled benefits. The Social Security projections are necessarily uncertain, and that age (the age at which they can receive unreduced Administration has no legal authority to pay sched- uncertainty is illustrated in this publication; retirement benefits) will be higher. uled benefits if their amounts exceed the balances nevertheless, the general conclusions of this analy- in the trust funds, however. Therefore, if the trust sis hold true under a variety of assumptions. funds became exhausted, payments to current and About This Analysis new beneficiaries would need to be reduced to System Finances CBO regularly prepares long-term projections make the outlays from the funds equal the revenues The first part of this publication (Exhibits 1 of revenues and outlays for the Social Security flowing into the funds.2 Benefits thus reduced are through 8) examines Social Security’s financial program. The most recent projections, for the called payable benefits. In such a case, all receipts to status from several vantage points. The fullest per- 75 years from 2010 through 2084, were published the trust funds would be used and the trust fund spective is provided by projected streams of annual in Chapter 3 of The Long-Term Budget Outlook balances would remain essentially at zero. When revenues and outlays. A more succinct analysis is (June 2010, revised August 2010). This publica- presenting projections of Social Security’s finances, tion presents additional information about those projections. 3. For more information, see Congressional Budget Office, 2. See Kathleen Romig, Social Security: What Would Happen Quantifying Uncertainty in the Analysis of Long-Term Social The budget projections published in The Long- If the Trust Funds Ran Out? Report for Congress RL33514 Security Projections, Background Paper (November 2005). Term Budget Outlook involved two scenarios: The (Congressional Research Service, updated August 20, The methodology used here differs slightly from the first, CBO’s extended-baseline scenario, adheres 2009). techniques described in that report. CBO
  • 9. CBO’S 2010 LONG-TERM PROJECTIONS FOR SOCIAL SECURITY: ADDITIONAL INFORMATION 3 given by measures that summarize the annual each group: Estimates for half of the people in the differences are attributable to changes both in streams in a single number. The system’s finances group are lower and estimates for half are higher. projected outlays and in projected revenues. The are also described by projecting what is called the 75-year cost rate—a measure of outlays—is about trust fund ratio, the amount in the trust funds at Most retired and disabled workers receive Social 2 percent higher under both scenarios because of the beginning of a year in proportion to the outlays Security benefits on the basis of their own work his- near-term economic weakness, slightly lower in that year. tory. This publication first presents measures of projections of real (inflation-adjusted) growth in those benefits that do not include benefits received wages, and technical changes in modeling meth- The Distribution of Benefits by dependents or survivors who are entitled on the ods. The projected 75-year income rate—a basis of another person’s work history. Then, for a measure of Social Security’s revenues—is slightly In the second part (Exhibits 9 through 16), CBO more comprehensive perspective on the distribution higher than CBO estimated in 2009 under the examines the program’s effects on people by of Social Security benefits, this analysis presents extended-baseline scenario because income taxes grouping Social Security participants by various measures of the total amount of Social Security pay- on benefits are projected to be higher as a share characteristics and presenting the average taxes and roll taxes that each participant pays over his or her of benefits. However, the income rate is about benefits for those groups. In its analysis, CBO lifetime as well as the total Social Security bene- 1 percent lower than in 2009 under the alternative divided people into groups by the decade in which fits—including payments received as a worker’s fiscal scenario because income taxes on benefits are they were born and by the quintile of their lifetime dependent or survivors—that each receives over a projected to equal a smaller share of benefits. household earnings.4 For example, one 10-year lifetime. cohort consists of people born in the 1940s, and the top fifth of earners constitutes the highest earn- ings quintile. CBO’s modeling approach produces Related CBO Analyses estimates for individuals; household status is used Changes in CBO’s Long-Term Further information about Social Security and only to place people into earnings groups. Social Security Projections CBO’s projections is available in other CBO In this part of the analysis, benefits are calculated Since 2009 publications: The shortfalls for Social Security that CBO is Various approaches to changing the program net of income taxes paid on benefits by higher- B currently projecting are larger than the shortfalls are presented in Social Security Policy Options income recipients and credited to the Social Secu- projected in CBO’s Long-Term Projections for Social rity trust funds.5 Median values are estimated for (July 2010). Security: 2009 Update (August 2009). The 75-year imbalance has increased from 1.3 percent to B The current long-term projections are consis- 4. Each person who lives at least to age 45 is ranked by life- 1.6 percent of taxable payroll under the extended- tent with the 10-year baseline CBO published time household earnings. Lifetime earnings for someone baseline scenario (see Exhibit 5) and from 1.5 per- in A Preliminary Analysis of the President’s who is single in all years equals the present value of his or cent to 2.1 percent of taxable payroll under the Budgetary Proposals for Fiscal Year 2011 (March her real earnings over a lifetime. In any year a person is alternative fiscal scenario (see Exhibit 6). Those 2010). (Data in that report and in The Long- married, the earnings measure is a function of his or her earnings plus those of his or her spouse (adjusted for Term Budget Outlook are generally presented for economies of scale in household consumption). A person’s 5. Benefits are not reduced by the portion of those income fiscal years; this analysis and Social Security lifetime earnings consist of the present value of those taxes that is credited to the Medicare Hospital Insurance Policy Options use calendar-year data.) annual amounts. trust fund. CBO
  • 10. CBO’S 2010 LONG-TERM PROJECTIONS FOR SOCIAL SECURITY: ADDITIONAL INFORMATION 4 B The current projections update those in B The methodology used to develop the projec- B Numerous other aspects of the program are CBO’s Long-Term Projections for Social Security: tions in this publication is described in CBO’s addressed in various publications available 2009 Update. Differences in the two sets of Long-Term Model: An Overview, a background from CBO’s Web site. projections are the result of newly available paper published in June 2009. programmatic and economic data, updated assumptions about future economic trends, and B Appendix B of The Long-Term Budget Outlook improvements in models. This current set of offers an explanation of the values used for the projections also incorporates the effects of the demographic and economic variables under- health care legislation passed in March 2010.6 lying the projections. (As was the case for CBO’s 2009 projections, the projections in this 7. See Social Security Administration, The 2009 Annual publication are based on the demographic Report of the Board of Trustees of the Federal Old-Age and 6. The Patient Protection and Affordable Care Act (Public assumptions of the 2009 report of the Social Survivors Insurance and Federal Disability Insurance Trust Law 111-148) and the Health Care and Education Security trustees.)7 Funds (May 12, 2009), www.ssa.gov/OACT/TR/2009/ Reconciliation Act of 2010 (P.L. 111-152). tr09.pdf.) CBO
  • 11. CBO’S 2010 LONG-TERM PROJECTIONS FOR SOCIAL SECURITY: ADDITIONAL INFORMATION 5 Exhibit 1. In 2009, Social Security’s total outlays (bene- Social Security Tax Revenues and Outlays, with Scheduled Benefits fits plus administrative costs) equaled 4.8 per- cent of the country’s gross domestic product (Percentage of gross domestic product) (GDP); tax revenues equaled 4.9 percent of 9 GDP. Most of the program’s tax revenues come Actual Projected Outlaysb from Social Security payroll taxes, although a 8 small portion comes from income taxes on 7 benefits paid to higher-income beneficiaries. Tax Revenuesa In addition to those tax revenues, the trust 6 funds are credited with interest. Over the next 5 few years, outlays will approximately equal tax revenues, CBO projects. 4 Tax Revenuesa By 2034, as the baby-boom generation ages 3 and the number of beneficiaries grows, sched- Outlaysb 2 uled spending will climb to 6.2 percent of GDP, CBO estimates. Over the ensuing two 1 decades, spending will decline slightly, relative 0 to the size of the economy, as people in the 1985 1994 2003 2012 2021 2030 2039 2048 2057 2066 2075 2084 baby-boom generation die. Demographers generally predict that life expectancy will con- Source: Congressional Budget Office. tinue to rise and that birth rates will remain as Note: The lines indicate CBO’s projections of expected outcomes. The shaded areas indicate the 80 percent they are now, so scheduled outlays are pro- range of uncertainty. jected to resume their upward trajectory after a. Includes payroll taxes and income taxes on benefits. 2050, reaching 6.4 percent of GDP in 2084. b. Includes scheduled benefits and administrative costs. The amount of tax revenues credited to the trust funds is likely to stay almost constant as a share of GDP over the next 75 years, edging up from 4.9 percent of GDP in 2009 to 5.0 percent in 2084. CBO projects that although people’s total compensation will be nearly constant as a percentage of GDP, taxable earnings will decline relative to GDP. Revenues from payroll taxes thus will fall slightly as a share of GDP, from 4.8 percent in (Continued) CBO
  • 12. CBO’S 2010 LONG-TERM PROJECTIONS FOR SOCIAL SECURITY: ADDITIONAL INFORMATION 6 Exhibit 2. (Continued) Social Security Tax Revenues and Outlays, with Scheduled Benefits 2009 to 4.4 percent in 2084. However, that drop will be offset by growth in the revenues (Percentage of gross domestic product) credited to the Social Security trust funds from Actual Projected income taxes on the program’s benefits. 2009 2034 2059 2084 Tax Revenues 4.92 4.93 4.93 4.99 The uncertainty in these projections is illus- Outlays 4.79 6.18 5.99 6.37 trated by the range of the outcomes from a Difference 0.13 -1.25 -1.06 -1.37 series of 500 simulations that vary most of the key demographic and economic factors in 80 Percent Range of Uncertainty for CBO's Projections the analysis according to historical patterns. Tax Revenues 4.8 to 5.0 4.8 to 5.1 4.8 to 5.2 Although CBO projects that the program’s Outlays 5.4 to 7.3 4.9 to 7.7 5.1 to 8.8 outlays will equal 6.2 percent of GDP in 2034, Differencea -2.3 to -0.5 -2.7 to 0.0 -3.9 to -0.3 in 10 percent of the simulations outlays in 2034 are below 5.4 percent of GDP and in Source: Congressional Budget Office. 10 percent they exceed 7.3 percent of GDP. Note: Tax revenues consist of payroll taxes and income taxes on benefits that are credited to the Social Security In most simulations, outlays in 2034 are pro- trust funds in the specified year. Outlays consist of scheduled benefits and administrative costs; scheduled jected to account for a much larger share of benefits are benefits as calculated under the Social Security Act, regardless of the balances in the trust GDP than the current 4.8 percent. funds. a. The differences displayed generally do not equal the difference between the outlays and revenues shown Because payroll taxes are a fixed share of tax- because each value is drawn from a different simulation. able earnings and because earnings generally grow with GDP, there is less uncertainty about tax revenues as a share of GDP than there is about outlays. However, the range of uncer- tainty reported here—about half that shown in CBO’s Long-Term Projections for Social Security: 2009 Update—understates the true uncertainty. To incorporate the effects of the health care legislation enacted in March 2010, CBO updated its projections of the share of compensation that will be paid in wages sub- ject to payroll taxes. That change has not been incorporated into the uncertainty model, so—unlike CBO’s past publications—this publication’s uncertainty analysis does not account for variation in that share. CBO
  • 13. CBO’S 2010 LONG-TERM PROJECTIONS FOR SOCIAL SECURITY: ADDITIONAL INFORMATION 7 Exhibit 3. Another perspective on the uncertainty in Percentage of Simulations in Which Social Security Outlays Exceed projections of Social Security’s finances involves the percentage of CBO’s simulations Tax Revenues by Specified Percentages, with Scheduled Benefits in which total outlays exceed tax revenues by a (Percent) given amount in a particular year. In the 500 By 0 Percent of By 1 Percent of By 2 Percent of By 3 Percent of By 4 Percent of By 5 Percent of simulations, most of the key demographic and GDP or More GDP or More GDP or More GDP or More GDP or More GDP or More economic factors in the analysis vary according 2020 86 5 0 0 0 0 to historical patterns. In 99 percent of them, 2030 99 63 13 1 0 0 outlays equal or exceed tax revenues in 2030. 2040 98 66 19 3 0 0 Outlays are at least 1 percentage point of GDP 2050 93 55 19 4 1 0 greater than tax revenues in 63 percent of sim- 2060 91 56 23 8 2 0 ulations for that year and at least 2 percentage 2070 92 61 30 12 4 1 points greater in 13 percent of those simula- 2080 93 68 33 13 6 3 tions. The percentage of simulations in which outlays equal or exceed tax revenues is slightly Source: Congressional Budget Office. lower after 2035, when many members of the Notes: Tax revenues consist of payroll taxes and income taxes on benefits that are credited to the Social Security baby-boom generation will have died, but that trust funds in the specified year. Outlays consist of scheduled benefits and administrative costs; scheduled value is still above 90 percent. As uncertainty benefits are benefits as calculated under the Social Security Act, regardless of the balances in the trust about outlays increases, the percentage of funds. This analysis is based on 500 simulations from CBO’s long-term model. simulations in which outlays exceed tax reve- GDP = gross domestic product. nues by at least 2 percentage points of GDP rises, reaching 33 percent by 2080. CBO
  • 14. CBO’S 2010 LONG-TERM PROJECTIONS FOR SOCIAL SECURITY: ADDITIONAL INFORMATION 8 Exhibit 4. The projected gap between outlays and reve- Social Security Tax Revenues and Outlays, with Scheduled and nues ultimately will eliminate the balance in the trust funds and make it impossible, under Payable Benefits current law, to pay the full amount of sched- (Percentage of gross domestic product) uled benefits. Payable benefits will equal scheduled benefits until the trust funds are 7 Actual Projected exhausted; after that, they will equal the Social Outlays with Scheduled Benefitsb 6 Security program’s annual revenues. In 2039— CBO’s projected date for the exhaustion of the 5 trust funds—revenues equal 79 percent of Tax Revenuesa scheduled outlays in CBO’s projections. Thus, 4 Outlays with Payable Benefitsb Outlaysb payable benefits will be 21 percent lower than scheduled benefits. The gap between sched- 3 uled and payable benefits will then shrink 2 slightly for a decade, falling to 19 percent. It will then begin to widen slightly in about 1 2055, and by 2084, payable benefits will be 24 percent smaller than scheduled benefits. 0 1985 1994 2003 2012 2021 2030 2039 2048 2057 2066 2075 2084 Source: Congressional Budget Office. a. Includes payroll taxes and income taxes on benefits. Tax revenues shown are consistent with payable benefits and would decline slightly if the trust funds became exhausted because revenues from taxation of benefits would decline. b. Includes benefits and administrative costs. CBO
  • 15. CBO’S 2010 LONG-TERM PROJECTIONS FOR SOCIAL SECURITY: ADDITIONAL INFORMATION 9 Exhibit 5. To present the results of long-term projections Summarized Financial Measures for Social Security Under the succinctly, analysts often summarize scheduled outlays and revenues as a single number that Extended-Baseline Scenario, with Scheduled Benefits covers a given period (for example, total out- As a Percentage of GDP As a Percentage of Taxable Payroll lays over 75 years). The data are summarized Income Cost Actuarial Income Cost Actuarial by computing the present value of outlays or Rate Rate Balance Rate Rate Balance tax revenues for a period and dividing that fig- CBO's Projections ure by the present value of the stream of GDP (or taxable payroll) over the same period. 25 Years (2010–2034) 5.66 5.61 0.06 15.24 15.09 0.15 (Present value is a single number that expresses 50 Years (2010–2059) 5.34 5.77 -0.42 14.55 15.70 -1.15 75 Years (2010–2084) 5.25 5.84 -0.60 14.39 16.03 -1.63 a flow of current and future income, or pay- ments, in terms of an equivalent lump sum a 80 Percent Range of Uncertainty for CBO's Projections received or paid today. That computation uses 25 Years (2010–2034) 5.6 to 5.8 5.1 to 6.1 -0.4 to 0.4 15.0 to 15.6 13.9 to 16.4 -1.0 to 1.1 the interest rate used to compute interest cred- 50 Years (2010–2059) 5.2 to 5.5 5.3 to 6.3 -0.9 to 0.0 14.3 to 14.8 14.5 to 17.2 -2.5 to -0.1 ited to the trust funds.) The income rate is the 75 Years (2010–2084) 5.2 to 5.4 5.4 to 6.5 -1.2 to -0.2 14.2 to 14.7 14.8 to 17.8 -3.2 to -0.5 summarized measure of revenues, and the cost rate is the summarized measure of outlays. The Source: Congressional Budget Office. actuarial balance is the difference between Note: Over the relevant periods, the income rate is the present value of annual tax revenues (plus the initial trust the income and cost rates. fund balance) and the cost rate is the present value of annual outlays (plus the present value of a year’s This analysis focuses on CBO’s extended- worth of benefits as a reserve at the end of the period), each divided by the present value of taxable payroll or gross domestic product (GDP). The actuarial balance is the difference between the income and baseline scenario, which adheres closely to cur- cost rates. rent law. In that scenario, federal income tax rates would increase over time, and the a. The balances displayed generally do not equal the difference between the outlays and revenues shown estimated 75-year actuarial balance would be because each value is drawn from a different simulation. -0.6 percent of GDP or -1.6 percent of taxable payroll. That means, for example, that if the Social Security payroll tax rate was increased immediately and permanently by 1.6 percent- age points—from the current rate of 12.4 per- cent to 14.0 percent—or if scheduled benefits were reduced by an equivalent amount, then the trust funds’ projected balance at the end of 2084 would equal projected outlays for 2085. CBO
  • 16. CBO’S 2010 LONG-TERM PROJECTIONS FOR SOCIAL SECURITY: ADDITIONAL INFORMATION 10 Exhibit 6. This publication focuses mostly on CBO’s Summarized Financial Measures for Social Security Under the extended-baseline scenario, which adheres closely to current law. CBO also has made Alternative Fiscal Scenario, with Scheduled Benefits long-term budget projections using an alterna- tive fiscal scenario that incorporates several As a Percentage of GDP As a Percentage of Taxable Payroll changes to current law that are widely expected Income Cost Actuarial Income Cost Actuarial to occur or that would modify some provisions Rate Rate Balance Rate Rate Balance of law that might be difficult to sustain for a CBO's Projections long period. (Details of the two scenarios are 25 Years (2010–2034) 5.62 5.62 0.00 15.09 15.09 0.00 outlined in Table 1-1 of the 2010 edition of 50 Years (2010–2059) 5.25 5.78 -0.54 14.24 15.69 -1.46 75 Years (2010–2084) 5.11 5.86 -0.75 13.97 16.02 -2.06 The Long-Term Budget Outlook.) 80 Percent Range of Uncertainty for CBO's Projectionsa The financial outlook for Social Security is less 25 Years (2010–2034) 5.5 to 5.7 5.2 to 6.1 -0.4 to 0.4 14.8 to 15.4 13.9 to 16.4 -1.2 to 1.0 favorable under the alternative fiscal scenario 50 Years (2010–2059) 5.2 to 5.4 5.3 to 6.4 -1.0 to -0.2 14.0 to 14.5 14.5 to 17.2 -2.9 to -0.4 (shown in this exhibit) than under the 75 Years (2010–2084) 5.0 to 5.2 5.4 to 6.5 -1.3 to -0.4 13.7 to 14.3 14.8 to 17.8 -3.6 to -1.0 extended-baseline scenario (shown in Exhibit 5). Income tax rates are assumed to be Source: Congressional Budget Office. lower under the alternative fiscal scenario, resulting in lower revenues from the taxation Note: Over the relevant periods, the income rate is the present value of annual tax revenues (plus the initial trust fund balance) and the cost rate is the present value of annual outlays (plus the present value of a year’s of Social Security benefits and therefore a worth of benefits as a reserve at the end of the period), each divided by the present value of taxable lower Social Security income rate. Under the payroll or gross domestic product (GDP). The actuarial balance is the difference between the income and alternative fiscal scenario, the 75-year income cost rates. rate is 5.11 percent of GDP, compared with a a. The balances displayed generally do not equal the difference between the outlays and revenues shown rate of 5.25 percent under the extended- because each value is drawn from a different simulation. baseline scenario. As a result, the 75-year actu- arial deficit is larger: 0.75 percent of GDP under the alternative fiscal scenario, compared with a deficit of 0.60 percent of GDP under the extended-baseline scenario. CBO
  • 17. CBO’S 2010 LONG-TERM PROJECTIONS FOR SOCIAL SECURITY: ADDITIONAL INFORMATION 11 Exhibit 7. The trust fund ratio—the balance in the Social Trust Fund Ratio, with Scheduled Benefits Security trust funds at the beginning of the year divided by the system’s outlays projected 10 for that year—indicates the proportion of a Actual Projected year’s cost that could be paid with the funds 5 available. The trust fund ratio for 2010 is 3.6, but CBO projects that the ratio will decline 0 beginning in 2011, reaching zero in 2039; at that point, payments to current and new bene- -5 ficiaries would need to be reduced to make the outlays from the funds equal to the revenues -10 flowing into the funds. The year in which the trust funds will be exhausted could differ sig- -15 nificantly from CBO’s projection, however. In 10 percent of CBO’s simulations, the trust funds will be exhausted in 2031 or earlier and -20 in 10 percent they will be exhausted in 2057 -25 or later; in those simulations, most of the key 1985 1994 2003 2012 2021 2030 2039 2048 2057 2066 2075 2084 demographic and economic factors in the anal- ysis were varied according to historical pat- Source: Congressional Budget Office. terns. (The shaded area in the figure shows the Note: The trust fund ratio is the ratio of the trust fund balance (the amount in the trust funds) at the beginning 80 percent range of uncertainty. The inter- of a year to outlays in that year. Outlays consist of benefits and administrative costs. The trust funds are section between the shaded area and the hori- exhausted when the trust fund ratio reaches zero. Under current law, the trust funds cannot incur negative zontal line at zero, spanning the years between balances. The negative balances shown in this exhibit indicate a projected shortfall, reflecting the trust 2031 and 2057, corresponds to the 80 percent funds’ inability to pay scheduled benefits out of current-law revenues. The dark line indicates CBO’s range of uncertainty about the year in which projection of expected outcomes; the shaded area indicates the 80 percent range of uncertainty around the trust funds will become exhausted.) The the projection. negative balances represent CBO’s estimates of the cumulative amount of scheduled bene- fits that cannot be paid from the program’s current-law revenues (expressed as a ratio to outlays in each year). CBO
  • 18. CBO’S 2010 LONG-TERM PROJECTIONS FOR SOCIAL SECURITY: ADDITIONAL INFORMATION 12 Exhibit 8. An alternative way to consider uncertainty is Percentage of Simulations That Show the Social Security to examine the percentage of simulations in which the trust funds are exhausted by a Trust Funds Exhausted by a Particular Year specific year. In those simulations, most of the key demographic and economic factors in 100 the analysis vary according to historical patterns. In 37 percent of CBO’s simulations, 80 the funds are exhausted before 2035. In 84 percent of the simulations, the trust funds are exhausted by 2050. In 97 percent of the 60 simulations, the trust funds are exhausted by 2084. 40 20 0 2010 2016 2022 2028 2034 2040 2046 2052 2058 2064 2070 2076 2082 Source: Congressional Budget Office. Note: The data are based on 500 simulations from CBO’s long-term model. CBO
  • 19. CBO’S 2010 LONG-TERM PROJECTIONS FOR SOCIAL SECURITY: ADDITIONAL INFORMATION 13 Exhibit 9. Future retired workers are likely to receive Median Initial Benefits for Retired Workers, with Scheduled and higher initial annual Social Security benefits than today’s beneficiaries receive, even with Payable Benefits payable benefits and even after an adjustment (Thousands of 2010 dollars) for the effects of inflation. With scheduled benefits, the median initial benefit for each Lowest Quintile of Middle Quintile of Highest Quintile of 10-Year Lifetime Household Lifetime Household Lifetime Household birth cohort is projected to be higher than that Birth All Retired Workers Earnings Earnings Earnings for the preceding cohort. CBO considered a Cohort Scheduled Payable Scheduled Payable Scheduled Payable Scheduled Payable hypothetical benefit amount: the median ben- efit a worker would receive if everyone claimed All benefits at age 65, based on earnings through 1940s 17 17 9 9 19 19 25 25 age 61. 1960s 18 18 11 11 20 20 31 31 1980s 22 18 13 11 24 20 38 31 By itself, growth in average earnings leads to 2000s 29 23 18 14 32 25 50 40 higher scheduled initial benefits. However, under current law, the growth of initial bene- Men fits for retired workers in several cohorts will 1940s 21 21 10 10 22 22 27 27 be offset somewhat by the scheduled rise in the 1960s 22 22 12 12 23 23 32 32 full retirement age, from 65 for people born 1980s 25 21 14 12 27 22 40 33 before 1938 to 67 for those born after 1959. 2000s 33 26 19 15 35 28 53 42 The effect is equivalent to a reduction in bene- Women fits for any age at which benefits are claimed. 1940s 13 13 8 8 14 14 21 21 Once the older retirement age is in place, 1960s 16 16 10 10 17 17 26 26 median initial benefits will grow at approxi- 1980s 19 15 13 10 21 17 33 27 mately the same rate as average earnings. 2000s 25 20 16 13 28 22 45 36 When the trust funds are exhausted, payable benefits will fall, CBO projects, but then they Source: Congressional Budget Office. will rise again as earnings (and therefore tax Note: Initial annual benefits are computed for all individuals who are eligible to claim retirement benefits at revenues) grow. Initial payable benefits are age 62 and who have not yet claimed any other benefit. All workers are assumed to claim benefits at lower than scheduled benefits for people born age 65. All values are net of income taxes paid on benefits and credited to the Social Security trust funds. in 1974 and later. Projected benefits are lower for women than for men in all cohorts because women have lower average earnings; the gap narrows (as a share of average benefits) for later cohorts because men’s and women’s earnings are becoming more equal. For the 1940s cohort, projected initial benefits for women are about 40 percent below those for men, but in the 1980s group they are about 25 percent CBO below those for men.
  • 20. CBO’S 2010 LONG-TERM PROJECTIONS FOR SOCIAL SECURITY: ADDITIONAL INFORMATION 14 Exhibit 10. Initial replacement rates—initial annual bene- Median Initial Replacement Rates for Retired Workers, with fits as a percentage of average annual lifetime earnings—provide a perspective on retired Scheduled and Payable Benefits workers’ benefits that is different from that (Percent) provided by looking simply at dollar amounts. Lowest Quintile of Middle Quintile of Highest Quintile of The progressive nature of Social Security’s ben- 10-Year Lifetime Household Lifetime Household Lifetime Household efit formula results in replacement rates that Birth All Retired Workers Earnings Earnings Earnings are higher for workers within a birth cohort Cohort Scheduled Payable Scheduled Payable Scheduled Payable Scheduled Payable who have had lower earnings. With payable All benefits, the replacement rate will drop notice- 1940s 45 45 71 71 43 43 31 31 ably at all earnings amounts for people in the 1960s 43 43 63 63 41 41 28 28 cohorts that first receive benefits after the trust 1980s 44 36 63 53 42 34 28 23 funds are exhausted. 2000s 42 33 62 50 41 33 26 21 Men The scheduled increase in the full retirement age will lower the replacement rate for future 1940s 40 40 64 64 39 39 25 25 beneficiaries (for any chosen age for claiming 1960s 39 39 59 59 39 39 22 22 1980s 40 33 59 50 40 33 23 19 benefits) compared with the rate for people 2000s 39 31 57 47 39 31 22 17 who are claiming benefits now. In particular, if Social Security benefits are paid as scheduled, Women the median replacement rate for beneficiaries 1940s 51 51 76 76 49 49 40 40 born in the 2000s (about 42 percent) will be 1960s 47 47 67 67 45 45 37 37 slightly lower than the rate for beneficiaries 1980s 48 39 68 56 45 37 36 30 born in the 1940s (about 45 percent), CBO 2000s 46 36 66 53 44 35 34 27 estimates. People in later cohorts, however, are expected to collect benefits for a longer time as Source: Congressional Budget Office. life expectancy increases. Note: The average initial replacement rate is a worker’s initial benefit as a percentage of a worker’s average annual lifetime earnings. (To compute lifetime earnings, past earnings are adjusted for average growth in Because women tend to have lower lifetime economywide earnings.) Replacement rates are computed for all individuals who are eligible to claim earnings, their average replacement rates are retirement benefits at age 62 and who have not yet claimed any other benefit. All workers are assumed to higher than men’s are, especially for earlier claim benefits at age 65. All values are net of income taxes paid on benefits and credited to the Social birth cohorts. The difference between women Security trust funds. and men in the highest quintile is large, in part because that group includes many women who spend time out of the labor force or who work part time. In contrast, most men in households with high earnings are employed full time. CBO
  • 21. CBO’S 2010 LONG-TERM PROJECTIONS FOR SOCIAL SECURITY: ADDITIONAL INFORMATION 15 Exhibit 11. Lifetime retirement benefits are the present Median Present Value of Lifetime Benefits for Retired Workers, with value, discounted to the year in which the ben- eficiary turns 62, of all retired-worker benefits Scheduled and Payable Benefits that a worker receives from the program. CBO (Thousands of 2010 dollars) estimates that real median lifetime benefits for Lowest Quintile of Middle Quintile of Highest Quintile of each birth cohort will be greater than those for 10-Year Lifetime Household Lifetime Household Lifetime Household the preceding cohort, even with payable bene- Birth All Retired Workers Earnings Earnings Earnings fits, because benefits grow with earnings. For Cohort Scheduled Payable Scheduled Payable Scheduled Payable Scheduled Payable example, CBO estimates that median sched- All uled lifetime benefits for people born in the 1940s 163 163 75 75 186 186 310 310 2000s will be almost double those for people 1960s 194 180 100 95 215 200 390 356 born in the 1940s in real terms; median pay- 1980s 232 188 124 104 266 215 481 395 able lifetime benefits for the 2000s cohort will 2000s 322 247 166 133 366 281 660 515 be about 50 percent greater. Men The projected trends in median lifetime retire- 1940s 197 197 77 77 219 219 352 352 ment benefits differ from the trends in median 1960s 220 205 103 98 244 227 436 397 initial benefits for two reasons. First, as life 1980s 261 212 132 108 295 240 542 445 expectancy increases, people will collect bene- 2000s 363 277 175 137 405 311 730 570 fits for longer periods, so scheduled lifetime Women benefits will grow faster than scheduled initial 1940s 142 141 72 72 155 155 249 248 benefits. Second, although cohorts that begin 1960s 175 162 96 91 192 177 320 291 to receive benefits before the trust funds are 1980s 210 170 117 98 240 195 397 324 exhausted will collect their scheduled benefits, 2000s 290 223 158 130 328 254 550 430 some members of those cohorts will still be receiving benefits when the trust funds are Source: Congressional Budget Office. exhausted. At that point, payable benefits Note: Benefits are the present value of all retired-worker benefits received. To calculate their present value, will decline, and the payable lifetime benefits benefits are adjusted for inflation (to produce constant dollars) and discounted to age 62. All values are for those recipients will be less than their net of income taxes paid on benefits and credited to the Social Security trust funds. scheduled lifetime benefits. Lifetime benefits are lower for women than for men. However, the gap is smaller than it is for initial benefits because women live longer, on average, and thus tend to collect benefits for a longer time. CBO
  • 22. CBO’S 2010 LONG-TERM PROJECTIONS FOR SOCIAL SECURITY: ADDITIONAL INFORMATION 16 Exhibit 12. The projected trends for initial benefits for dis- Median Benefits and Initial Replacement Rates for abled workers and retired workers are similar (see also Exhibit 9): Future beneficiaries are Disabled Workers, with Scheduled and Payable Benefits likely to receive higher initial annual benefits Present Value of than today’s beneficiaries receive. However, the 10-Year Initial Benefits Initial Replacement Lifetime Benefitsb scheduled increase in the full retirement age— Birth (Thousands of 2010 dollars) Ratea (Percent) (Thousands of 2010 dollars) which will effectively reduce annual benefits Cohort Scheduled Payable Scheduled Payable Scheduled Payable for retired workers—will have no direct effect All Disabled Workers on people who receive disability benefits because they can receive those benefits in any 1940s 13 13 47 47 228 228 1960s 16 16 52 52 216 212 year before they reach the full retirement age. 1980s 19 17 54 49 288 247 Thus, CBO projects that real initial disability 2000s 24 20 53 44 428 335 benefits (scheduled and payable) will increase more rapidly than retirement benefits will. Workers Whose Disability Begins Before Age 40 1940s * * * * * * Initial replacement rates tend to be higher for 1960s 10 10 58 58 250 250 disabled workers than for retired workers 1980s 12 12 60 60 447 437 (shown in Exhibit 10) because their earnings 2000s 16 15 58 53 640 538 tend to be lower. For the same reason, workers Workers Whose Disability Begins Between Ages 40 and 54 who become disabled at earlier ages tend to have lower benefits, but higher replacement 1940s * * * * * * 1960s 14 14 53 53 237 236 rates, than do those who become disabled 1980s 17 17 55 54 285 254 when they are older. 2000s 22 18 55 45 427 340 The median present value of lifetime benefits Workers Whose Disability Begins Between Age 55 and the Full Retirement Age paid to disabled beneficiaries—including the 1940s 16 16 48 48 202 202 retirement benefits they receive after reaching 1960s 18 18 50 50 198 193 the full retirement age—is much greater than 1980s 22 18 52 43 266 215 the present value of lifetime benefits paid to 2000s 29 23 51 41 388 299 retired workers (shown in Exhibit 11), for two reasons. First, disabled beneficiaries are Source: Congressional Budget Office. younger when they begin to collect benefits, so Notes: Initial annual benefits and replacement rates are computed for all individuals who are projected to receive they receive them for a longer period, on aver- Disability Insurance worker benefits. All values are net of income taxes paid on benefits and credited to the age, than retired workers do. Second, because Social Security trust funds. benefits are received at younger ages, their * = no data are available for people who died before 1984. present value is greater. As with retirement a. Initial annual benefits as a percentage of average annual lifetime earnings. benefits, projected lifetime disability benefits b. The present value of all disability benefits received plus retired-worker benefits received after the full retirement age. are generally greater for each birth cohort than To calculate present value, benefits are adjusted for inflation (to produce constant dollars) and discounted to age 62. for the preceding one. CBO