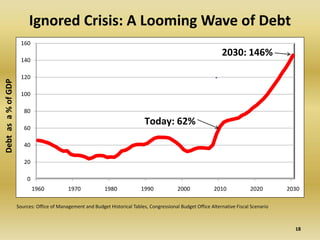
1. Ignored Crisis: A Looming Wave of Debt
160
2030: 146%
140
120
Debt as a % of GDP
100
80
Today: 62%
60
40
20
0
1960 1970 1980 1990 2000 2010 2020 2030
Sources: Office of Management and Budget Historical Tables, Congressional Budget Office Alternative Fiscal Scenario
18
2. Widening Gap Between Spending and Revenue
28.0
26.0
24.0
2020
Gap:
22.0
$1.25
% of GDP
20.0 Trillion
18.0
16.0
14.0
Revenue
12.0 Spending
1960 1970 1980 1990 2000 2010 2020
Sources: OMB Historical Tables (1940‐2009), Congressional Budget Office's Long‐Term Budget Outlook Alternative Fiscal Scenario
17
6. 2035 Spending
Interest Mandatory Spending
Payments: (Medicare, Medicaid,
$2.27 Trillion Social Security):
$4.46 Trillion
25%
49%
26%
Discretionary Spending
(Defense, Highways,
Education): $2.43 Trillion In Current Dollars
Source: Congressional Budget Office, Alternative Fiscal Scenario
13
7. Debt Isn’t Free:
Putting 2009 Costs Into Perspective
200
187
180
160
Billions of $
140
120
100
80 69
60 49 45 44
40 30
20 12
0
Net Interest Dept of Dept of Dept of Dept of TN State Dept of Labor
Transportation Homeland Education Housing Budget
Security
Sources: President’s FY’11 Budget, CBO, TN 2010‐11 Budget 12
8. Debt Isn’t Free:
Putting 2020 Costs Into Perspective
1000
916
900
800
Billions of $
700
600
500
400
300
200
83 59 54 52
100 35 14
0
Net Interest Dept of Dept of Dept of Dept of Housing TN State Budget Dept of Labor
Transportation Homeland Education
Sources: President’s FY’11 Budget, CBO, TN 2010‐11 Budget
Security
Sources: President’s FY’11 Budget, CBO, TN 2010‐11 Budget 11
9. Who Owned America’s Debt in 1960?
Total Publicly Held Debt: $236.8 Billion
Foreign
Holders:
$13 Billion
(5%)
Domestic
Holders:
$223.8 billion
(95%)
Source: OMB and Department of the Treasury
10
13. What is Right Amount of
Spending?
21% of GDP: Erskine Bowles
20.3% of GDP: 50-year Average
18% of GDP: Balanced Budget
6
14. Getting Spending Back to a Balanced Budget:
$6.7 Trillion Reduction in Spending Over Ten Years
28.0
26.0
24.0
Tough
% of GDP
22.0
Medicine:
20.0 $6.7
18.0 Trillion
16.0
Revenues as % of GDP
14.0
Outlays as % of GDP
12.0
1960 1970 1980 1990 2000 2010 2020
Getting to 21% of GDP would be $3.4 Trillion
Getting to 20.3% of GDP would be $4.5 Trillion
5