
Recomendados
Más contenido relacionado
Destacado
Destacado (12)
Similar a Elections
Similar a Elections (20)
Más de Carolyn Thompson
Más de Carolyn Thompson (20)
Último
Último (17)
Elections
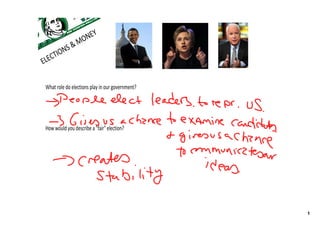
- 1. NEY & MO O NS LE CTI E What role do elections play in our government? How would you describe a quot;fairquot; election? 1
- 2. 2
- 3. 2 Main Sources of Funding Private Funding Public Funding Either Or Individual Donors Department of the Treasury The Candidate Political Action Commimttess 3
- 4. Estimated Spending Voter Turnout Spending/Voter Year 1960 $175 million 68.8 million $2.25/voter 1964 $200 million 70.6 million $2.83/voter 1968 $300 million 73.2 million $4.10/voter 1972 $425 million 77.7 million $5.47/voter 1976 $540 million 81.6 million $6.62/voter 1980 $1.2 billion 86.6 million $13.87/voter 1984 $1.8 billion 92.7 million $19.42/voter 1988 $2.7 billion 91.6 million $29.48/voter 1992 $3.2 billion 104.4 million $30.65/voter 1996 $4.0 billion 96.5 million $41.45/voter 2000 $5.1 billion 105.4 million $48.39/voter 2004 $6.0 billion 120.2 million $49.92/voter 4
- 7. Challenge to the FECA Buckley v. Valeo (1976) : The Supreme Court ruled that limiting campaign contributions limited protected speech and was therefore unconstitutional. The Court DID allow limitations on direct contributions to candidates. ( HARD MONEY ) The Court did NOT allow limitations on how much candidates could spend on their own campaigns or how much they could contribute to themselves. The Court did NOT allow limitations on money spent on behalf of a candidates. ( s SOFT MONEY ) The LOOPHOLE that was created: SOFT MONEY Soft money was unregulated so PACs began to raise and spend soft money in record breaking amounts: issues ads, direct mailings, get out the vote drives. 1980: $19 million in soft money | 1996: $260 million | $500 million in 2000 7
- 8. $5000/candidate Wealthy donors give to a PACS give to candidates PAC (must be at least (must be at least 5). 500). 8
- 9. Reform Effort #2: The Bipartisan Campaign Reform Act (BCRA) (2002) ‐‐‐Bans large, unlimited contributions to national political parties: SOFT MONEY ‐‐‐Curbs the use campaign ads by outside organizations (30 days before a primary and 60 days before a general election). ‐‐‐Increased the amount individuals can give to an individual candidate to $2,000 and raised the amount an individual can give to all candidates over a two year period to $95,000. ‐‐‐Allowed soft money contributions to state and local parties. Challenges to the BCRA McConnell v. F.E.C. (2003) : The Supreme Court upheld the BCRA. The LOOPHOLES that were created: 527s like Moveon.org and Swift Boat Veterans for Truth 9