Call Girls Electronic City Just Call 👗 7737669865 👗 Top Class Call Girl Servi...
Asnt houston
1. The Electromagnetic (EM) Inspection of Offshore Wire Ropes
Herbert R. Weischedel
NDT Technologies, Inc.
P.O.Box 637, South Windsor, CT 06074, Tel. (860) 644-5655
Introduction
Because the reliable and safe use of wire rope is crucial for offshore applications, concern with their integrity
is a constant preoccupation of wire rope operators and safety authorities. In spite of these concerns, a reluctance
to apply appropriate inspection methods and discard criteria compromises the safety of many offshore operations.
A recent multi-hundred-million-dollar accident, caused by a wire rope failure, underscores the importance of
reliable wire rope inspection methods.
Because many offshore ropes deteriorate internally without externally visible signs, their inspection solely by
visual methods is unsafe. In other cases, visual inspection is possible but not practical. For example, mooring
ropes are often covered with mud and marine growth. This makes their visual inspection difficult, if not
impossible.
When visual inspections are impossible, rope operators usually resort to a statutory life policy as an
alternative. (The statutory life method requires rope retirement at prescribed, fixed intervals.) By definition, this
approach must be extremely conservative and, therefore, wasteful. For example, presently, countless perfectly
good crane ropes - worth many millions of dollars - are discarded at regular annual intervals. And yet, in spite of
this very uneconomical practice, occasional rope failures still occur.
More dependable inspection methods, combined with a better understanding of degradation mechanisms and
discard criteria, can notably increase wire rope safety. For example,
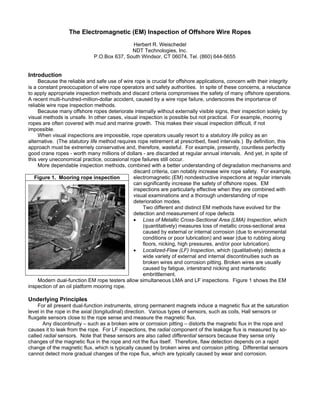
Figure 1. Mooring rope inspection electromagnetic (EM) nondestructive inspections at regular intervals
can significantly increase the safety of offshore ropes. EM
inspections are particularly effective when they are combined with
visual examinations and a thorough understanding of rope
deterioration modes.
Two different and distinct EM methods have evolved for the
detection and measurement of rope defects
• Loss of Metallic Cross-Sectional Area (LMA) Inspection, which
(quantitatively) measures loss of metallic cross-sectional area
caused by external or internal corrosion (due to environmental
conditions or poor lubrication) and wear (due to rubbing along
floors, nicking, high pressures, and/or poor lubrication).
• Localized-Flaw (LF) Inspection, which (qualitatively) detects a
wide variety of external and internal discontinuities such as
broken wires and corrosion pitting. Broken wires are usually
caused by fatigue, interstrand nicking and martensitic
embrittlement.
Modern dual-function EM rope testers allow simultaneous LMA and LF inspections. Figure 1 shows the EM
inspection of an oil platform mooring rope.
Underlying Principles
For all present dual-function instruments, strong permanent magnets induce a magnetic flux at the saturation
level in the rope in the axial (longitudinal) direction. Various types of sensors, such as coils, Hall sensors or
fluxgate sensors close to the rope sense and measure the magnetic flux.
Any discontinuity – such as a broken wire or corrosion pitting – distorts the magnetic flux in the rope and
causes it to leak from the rope. For LF inspections, the radial component of the leakage flux is measured by so-
called radial sensors. Note that these sensors are also called differential sensors because they sense only
changes of the magnetic flux in the rope and not the flux itself. Therefore, flaw detection depends on a rapid
change of the magnetic flux, which is typically caused by broken wires and corrosion pitting. Differential sensors
cannot detect more gradual changes of the rope flux, which are typically caused by wear and corrosion.
2. Methods for the (quantitative) measurement of the LMA of a rope are discussed in the following. When a
rope is magnetically saturated, the axial magnetic flux in the rope is proportional to its cross-sectional area.
Therefore, any LMA can be determined by measuring this magnetic flux. Two types of sensors can be used to
measure magnetic flux: Hall sensors (or, alternatively, fluxgate sensors) and coils in combination with electronic
integrator circuits.
To measure flux density, Hall sensors (and fluxgate sensors) must be physically inserted directly into the
magnetic flux path. Thus, the flux to be measured must intersect the sensors. This is not possible when
measuring the magnetic flux inside the rope. Therefore, instruments that use Hall sensors or fluxgate sensors
must always resort to an indirect method for determining the axial rope flux. They measure some flux density
outside the rope and determine or estimate the longitudinal rope flux from the external flux measurement.
Alternatively coils-cum-integrators can be used. Because coils must encircle the magnetic flux to be measured,
they can directly measure the magnetic flux inside the rope. Currently, two generic methods are used for the
determination of LMA. They are illustrated in Figure 2.
The Main-Flux Method uses an annular coil together with an electronic integrator circuit to determine the
local magnetic flux inside the rope (Figure 2a). Note that the coil must encircle the rope. Originally patented1 in
Britain in the 1960s, this approach has been discussed in the literature.2, 3, 4 Since it measures the magnetic flux
inside the rope locally, the annular coil approach offers uncommon resolving power, signal fidelity and, therefore,
inspection accuracy. The performance of this arrangement is unsurpassed and must be considered the Gold
Standard by which all other methods are measured.
FIGURE 2. Cross-sectional area measurement methods
Return Flux
Path Annular Coil
(cum Integrator) Sense Coils
(cum Integrator)
Yoke
Permanent
Magnet
External
Rope
Stray
Flux Path
External Stray
Flux Path
Main Flux
Path Integrator
Integrator
a. Main-Flux Method b. Modified Main-Flux Method
Flux Gate
Sensors
Hall
Sensors
c. Return-Flux Method d. Return-Flux Method
Unfortunately, it is topologically impossible to implement a hinged annular coil with a large number of turns
that can be opened and conveniently attached to the rope. This means, the practical implementation of the main-
flux method for in-service wire rope inspections is seriously hampered by an inherent and insurmountable
problem: An annular coil – encircling the rope – must be wound onto the rope in the field for each inspection. This
3. cumbersome procedure allows only very few turns (say, one hundred) and, hence, only very small induced coil
voltages. The coil voltages are of the same order of magnitude as the always-present offset voltages at the input
of operational amplifiers that are used for the design of electronic integrator circuits. These inherent offset
voltages make the long-term low-drift integration of the coil voltages impossible. Hence, the annular coil approach
is not feasible for in-service inspections where LMA measurements over longer time periods – say, over more
than a few minutes – are required.
The Modified Main-Flux Method, shown in Figure 2b, tries to retain the superior performance of the Main-
Flux Method while allowing the implementation of hinged sense heads of the clamshell design.3, 4
The test signals of this Modified Main-Flux Method are a combination of the Main-Flux signal and a signal
component that is caused by the (parasitic) outside stray flux, i.e., that portion of the flux that leaves and enters
the sense head to and from the outside, respectively, and flows along some external stray flux path (see
Figure 2). Unfortunately, this outside signal component is significant. It compromises the quality of the test results
and must be considered parasitic. Although this parasitic effect can be minimized,5 a true signal of the main flux
type cannot be completely restored. Nevertheless, the Modified Main-Flux Method retains at least some of the
desirable features of the annular coil approach.
The Return Flux Method uses Hall sensors6, 7 (or, more complex, fluxgate sensors8) to measure the
magnetic flux in the magnetic return path of the instrument. Illustrated by Figures 2c and d, the return flux is
equal to the average value of the axial rope flux inside the sense head plus the outside stray flux. Therefore, the
return flux provides an estimate of the average cross sectional area of that section of the rope that is inside the
sense head. Flux sensors can either be inserted into the air gap between the permanent magnet poles and the
rope or into the yoke of the magnetizer assembly. The return-flux method allows the design of hinged sensor
heads of the clamshell type. This feature makes it possible to attach the sensor head to the rope even under
adverse field conditions.
Signal Generation and Evaluation5
For the interpretation of test results and for a correlation of test data with the actual rope condition, the rope
inspector must understand the capabilities and limitations of his EM rope inspection equipment. A proper
appreciation of the signal generation process, together with an understanding of rope degradation mechanisms
and discard criteria, is essential for making rational rope retirement decisions.
For the following discussion, step changes of metallic cross-sectional area – caused by missing or added
wires, for example – have particular significance. Because of its simple geometry, a step change can be called a
fundamental defect. Accordingly, the corresponding LMA and LF signals, caused by a fundamental defect, can
be called fundamental LMA or LF
FIGURE 3. Input and output signals of an idealized rope test instrument
signals, respectively. The
Distance on Rope fundamental signals can also be
called an instrument’s step
Decreasing Gap Widths
response.
It is easy to see that any
defect can be represented as the
Rope Cross-Section sum of appropriately scaled and
spaced fundamental defects.
0
Moreover, the process of signal
generation is, at least
LMA Trace (ideal) approximately, linear. Hence
linear superposition applies.
0 This means that, if a defect can
be represented as the sum of
several fundamental defects,
LF Trace
then the corresponding defect
0
(LMA and LF) signals are the
sum of the corresponding
Alternative LF Trace fundamental LMA and LF
signals. The concepts of
fundamental defects and signals,
step response, and linear
4. superposition are discussed further in the literature.9 Determining and evaluating its step response is an excellent
method for characterizing the performance of an EM wire rope tester.
In the present context, the concept of filtering can be used very loosely. For example, the sensor head of an
EM rope tester, together with the signal electronics, may be viewed as a – linear or nonlinear – data filter. This is
illustrated further by Figure 3. The figure depicts the rope cross-section as the input signal and the idealized
corresponding LMA and LF output signals. Note that, for many rope testers, the LF signal approximates the first
derivative of the rope cross-section signal. For other instruments, the LF signal is the second derivative of the
rope cross-section, as shown as Alternative LF Signal in Figure 3. Note that the signals generated with the Main
Flux Method, shown in Figure 2a, closely resemble the idealized results of Figure 3.
Recognizing differentiation as the quintessential high-pass filter operation, the LF signal can be considered
as the rope cross-section input signal that has been high-pass filtered. High-pass filtering accentuates fast
changes of signals, and, typically, broken wires and corrosion pitting cause rapid variations of the rope cross-
section. Therefore, the high-pass filtering feature makes the LF Signal useful for the detection of broken wires
and corrosion pitting.
Any inspection equipment should present data in a form that facilitates their interpretation by the human
operator. Figure 3 shows that a perfect LMA signal could serve as such an accurate and conceptually simple
map of a rope’s LMA that is easy to interpret by the inspector.
Resolution and Averaging Length
The dictionary defines resolution as “the level of detail that can be distinguished in an image (or a
recording).” For electromagnetic wire rope inspections, resolution is always the premier performance measure.
In nondestructive testing, the terms resolution and inspection accuracy are often used synonymously.
In the discipline of electromagnetic wire rope inspection, quantitative resolution3 or averaging length (sometimes
also called scanning length) is defined as the minimum length of a uniform anomaly for which the sensor provides
an accurate measurement of a rope’s LMA.
To visualize the concept of averaging length, assume that, instead of measuring metallic cross-sectional
area directly, the rope tester continuously measures the metallic volume of consecutive rope sections with lengths
that are equal to its averaging length. Figure 4 illustrates this concept.
Figure 4a shows a
FIGURE 4. LMA length and averaging length (hypothetical) rope with a
LMA Length
uniform 10% LMA extending
300 mm LMA Length
300 mm
over a length of 300 mm. An
instrument with a 50 mm
averaging length will correctly
10% LMA 10% LMA measure this LMA. As
illustrated by Figure 4b, a
rope tester with an averaging
Averaging
Length Averaging Length
length of 300 mm will also
50 mm 300 mm give a true indication of this
a. b.
anomaly.
Now consider a
LMA LMA (hypothetical) rope with a 10%
Length
50 mm
Length
50 mm
uniform LMA extending over a
length of 50 mm. Figure 4c
shows that an instrument with
10% LMA 10% LMA an averaging length of 50 mm
can determine the exact LMA
caused by this anomaly.
Averaging Averaging Length However, as can be seen
Length
50 mm
300 mm
from Figure 4d, an instrument
c. d.
with a an averaging length of
300 mm would indicate the
same anomaly as a 1.7% LMA extending over a length of 300 mm – a very inaccurate indication of the true rope
condition. These examples show the importance of a short averaging length.
5. Note that signal
FIGURE 5. LMA signals as a function of averaging length
averaging is a
Decreasing Gap Width quintessential type of low-
pass filtering, and that
Rope Cross-Section
signals lose a significant
amount of information
(details) by low-pass
Increasing Averaging Length
filtering. Figure 5
0 illustrates this situation. It
shows how the quality of
LMA signals deteriorates
LMA Signals
LMA Signals
0
as the averaging length
increases.
An analogy can
illustrate the problems
0
associated with long LMA
averaging lengths: A chain
LMA Signals is only as strong as its
0
weakest link. Obviously,
the strength of a chain is
not determined by the
average strength of some
of its links. Similarly, the
strength of a rope, which has lost metallic cross-section by corrosion and/or wear, is determined by the minimum
local metallic cross-sectional area along the rope’s length, and not by some average value of the rope cross-
sectional area.
Experience has shown that serious rope deterioration can occur over very short distances along the length
of a rope. Hence, in order to determine and evaluate a rope’s actual metal loss with acceptable accuracy, a short
averaging length – of no more than a few centimeters – is important.
Because all wire rope testers have a quantitative resolution or averaging length that is greater than zero, an
accurate measurement of LMA always requires minimum lengths of anomalies. As the above discussion shows
and as illustrated by Figure 5, the concept of quantitative resolution or averaging length is important for specifying
and comparing the performance of rope testers.
Wire Rope Inspection and Retirement
Two different philosophies have been used to effect rope retirement:
1. A Statutory Life Policy mandates rope retirement at certain prescribed intervals.
2. Retirement for Cause is based on retirement conditions that are evaluated periodically by nondestructive
inspections.
Because a Statutory Life Policy is inherently wasteful, regulators have tended to adopt the Retirement-for-
Cause approach wherever appropriate.
Wire rope deteriorates gradually throughout its entire service life. To keep abreast of deterioration, wire rope
must be periodically inspected. Because moderate deterioration is normally present, the mere detection of rope
deterioration does not usually justify rope retirement. There are two major nondestructive inspection methods for
the detection and evaluation of rope degradation: Visual inspections and EM inspections.
Visual Inspection
Visual inspections are a simple yet useful method for detecting a wide variety of external rope deteriorations.
Using this approach, the rope is moved two or three feet at a time and visually examined for broken wires and
other rope deterioration at each stop. This method is tedious and, because the rope is often covered with grease,
many external and internal defects elude detection.
Another visual inspection tool is measurement of the rope diameter. Rope diameter measurements compare
the original diameter – when new and subjected to a known load – with the current reading under like
circumstances. A change in rope diameter indicates external and/or internal rope damage. Inevitably, many sorts
of damage do not cause a change of rope diameter.
6. Visual inspections are inherently not well suited for the detection of internal rope deterioration. Therefore, they
have limited value as a sole means of wire rope inspection. However, visual inspections are simple and do not
require special instrumentation. When combined with the knowledge of an experienced rope examiner, visual
inspection can provide a valuable supplementary tool for evaluating many forms of rope degradation.
Electromagnetic Inspections "
As discussed, EM wire rope inspection gives detailed insight into the condition of a rope. Its reliability has
"
made EM testing a universally accepted method for the inspection of wire ropes in mining, for ski lifts, and many
other applications.
Combined Inspections
Electromagnetic and visual wire rope inspections complement each other. Both are essential for safe rope
operation, and both methods should therefore be used for maximum safety.
A thorough inspection must consider all aspects of a rope's condition, including:
1. The findings of a visual inspection,
2. the results of an EM rope inspection,
3. the rope's operating conditions and related damage mechanisms,
4. the history of the rope under test and that of its predecessors.
Dependable inspection procedures, using combined visual and EM methods, can detect rope deterioration at
its earliest stages. Therefore, wire rope users can employ them as an effective preventive maintenance tool. To
illustrate, here are some practical examples.
1. The early detection of corrosion allows immediate corrective action through improved lubrication.
2. Accelerating wear and interstrand nicking can indicate a need to reline sheaves to stop further degradation
3. Careful inspections can monitor the development of local damage at the crossover points of the rope on a
winch drum. This way, the operator can determine the optimum time for repositioning the rope on the drum.
A program of periodic inspections is especially effective. To establish baseline data for subsequent
inspections, such a program should commence with an initial inspection of the installed rope after a certain break-
in period. Subsequent inspections should then be performed at scheduled intervals. In particular, periodic EM
inspections allow the documentation of a rope's deterioration over its entire service life.
Offshore Ropes10, 11
Many offshore crane and diving bell ropes are of the torque-balanced multistrand type comprising two or
more layers of strands. Figure 6 shows a cutaway section of such a multistrand rope. Torque balance is achieved
by laying outer and inner strands in opposite directions. This type of rope construction limits axial rotation of the
freely suspended rope under load. In addition, multistrand ropes offer flexibility and a wear resistant surface
profile.
FIGURE 6. Multistrand FIGURE 7. FIGURE 8. Broken wires in
Rope construction Interstrand nicking second layer of strands
Wire in Second
Layer of Strands
Interstrand Nicking
and Wear at Wire
Crossovers
Wire in First
Layer of Strands
However, the wires and strands in different layers of these ropes touch locally and at an angle. Therefore,
when multistrand ropes bend over sheaves or on a drum, they are subject to the combined effect of radial loading,
7. relative motion between wires and bending stresses. This causes fretting wear or fatigue and interwire nicking
across the interface between layers as illustrated by Figure 7.
Therefore, multistrand ropes are prone to develop internal broken wires. This breakup occurs primarily on the
interface between the outer and second layer of strands, usually with no externally visible signs (see Figure 8).
The wires in the second layer of strands typically show interstrand nicking and breaks caused by a combination of
fluctuating axial wire stresses, inter-wire motions and fluctuating radial loads. The broken wires usually show
squared-off and z-shaped ends that are typical for fatigue breaks.
Many multistrand ropes are subject to corrosive
FIGURE 9. Two sections of crane rope
environmental conditions. For example, offshore ropes are
with severe internal corrosion
either immersed in the sea or continually wetted by salt
water spray. In addition, heavy use in a marine
environment can displace and degrade the rope lubricant.
The combined effects of fatigue, corrosion and lubricant
degradation can cause rapid internal deterioration where
there is no effective form of protection. The combined
effects of fatigue, corrosion, and lubricant degradation can
cause fairly rapid internal degradation with no externally
visible indications. Figure 9 illustrates this situation. The
upper part of the figure shows the external appearance of
an offshore crane rope; the lower part is another section of
same rope with the outer strands stripped away. While it
would be straightforward to detect this type of rope deterioration with an EM inspection, this situation is by no
means unique and has caused several in-service rope failures.
Example 1. Diving bell rope inspection.
FIGURE 10. Chart of diving bell hoist rope
60 65 70 Distance (m)
LMA Trace
LF Trace
Figure 10 shows an EM inspection chart recording of a 30 mm die-formed multistrand diving bell hoist rope.
The rope shows periodic groups of broken wires, probably at cross-over points on the winch drum. The maximum
LMA is 1%. The external broken wires could be identified visually. This rope section is subjected to the full in-air
weight as the bell is lowered and raised. On the basis of the EM inspection, a decision was made to cut and
reterminate the rope behind the first defect about 58 m from the diving bell.
Example 2. Experimental multistrand rope inspection
This case study illustrates the use of EM wire rope inspections for the detection and quantitative
characterization of internal broken wires and clusters of broken wires in multistrand ropes. The present
experiment deals with the inspection of a torque balanced multistrand rope with no corrosion and many internal
broken wires. This rope has been used on a trial basis and was known to contain numerous internal broken wires
along its entire length.
The task at hand was to determine the number of broken wires in 100 mm segments along the length of the
rope. The difficulty of this quantitative defect characterization problem was compounded by the fact that an
undamaged rope section was not available for comparison. Further, at the time, the correlation of the typical
deterioration modes of this and similar ropes with their EM inspection results was generally not well understood.
A cross-sectional diagram of this multistrand rope is shown in Figure 11. As indicated in the figure, it is known
that broken wires in multistrand ropes usually develop in the second layer at the interface between the first and
8. the second layer of strands. In addition, from this and similar ropes’ service histories, it can be assumed that the
rope under inspection has developed significant interstrand nicking together with numerous fatigue breaks of
wires in the second layer of strands.
FIGURE 11. Typical position of The detailed detection and quantitative characterization of internal
broken wires in a multistrand rope broken wires in ropes with many breaks and clusters of breaks – such as
the present rope – pose problems. Difficulties are caused by the fact
Typical Positions that, for electromagnetic wire rope inspections, the indication of a broken
of Broken Wires
wire is influenced by a number of parameters like
a) broken wire cross-sectional area,
b) broken wire gap width, and
c) by the position of the broken wire within the cross-section of the rope.
d) For clusters of broken wires, an additional problem is caused by the
fact that the relative position of broken wires with respect to each
other along the length of the rope is not known. For example, the
gaps of broken wires could be aligned or staggered.
e) Finally and most importantly, broken wires with zero or tight gap
widths are not detectable by electromagnetic inspections because
they do not produce a sufficient magnetic leakage flux.
Considering the above, only an estimate of the number of broken wires is
possible.
Conventionally, the LF trace is used
FIGURE 12. LMA and LF traces and
for the detection of broken wires.
relative number of broken wires
However, the LF signal is not quantitative
Distance (meter from marker) and can not be used for estimating the
-5 -4 -3 -2 -1 0 1 2
1 5 number of broken wires. On the other
Relative Number of Broken Wires
(N/Nmax)
hand, the LMA trace of the inspection
N/Nm ax
4
chart in Figure 12 shows rapid relatively
small variations of cross-section. These
0 3
variations are significant and can be used
to estimate the number of broken wires
Change of Cross-Section(%)
per unit of rope length. Note, however,
High-Pass Filtered
2
that the averaging length or quantitative
resolution of the instrumentation used
-1 1
must be sufficient to allow this quantitative
defect characterization.
0
The estimated number of broken
LF
wires per 100 mm of rope length, N,
-2 -1 derived from the LMA trace, is shown on
the top of Chart 12. Here, Nmax denotes
the maximum number of broken wires per
100 mm of rope length. Based on the operating history of this and similar ropes, a value of Nmax = 20 can be
estimated.
The rope was subsequently disassembled12 to determine the actual number of broken wires per unit of rope
length. Broken wire estimates together with the actual number of broken wires along the length of the rope are
shown in Figure 13. Considering the fact that the LMA trace not only indicates broken wires but also interstrand
nicking, internal wear and other disturbances of the rope structure, there is a good correlation between the actual
and estimated number of internal broken wires. The correlation between actual and estimated number of broken
wires up to a rope distance of about 4500 mm is very good. Beyond this distance, there is an offset, which is
probably due to a distance measurement error during disassembly of the rope.
A destructive break test of the rope showed a 30.2% loss of breaking strength. On the other hand, the
second layer of strands of the rope (see Figure 11) represents about 30% of the total rope cross-sectional area.
This leads to the hypothesis that, for this rope, the second layer of strands has lost all load-bearing capability.
The lack of sufficient information on the rope’s operating history – and that of its predecessors – made this
rope evaluation difficult. Under normal circumstances, these details are known and must be considered when
assessing the rope condition. Altogether, this evaluation shows that a quantitative defect characterization for
9. ropes with internal broken wires and clusters of broken wires is possible. The example illustrates the capabilities
and limitations of EM wire rope inspection methods for this particular defect characterization problem.
FIGURE 13. Broken wires at 100 mm intervals
(smoothed data, 3 sample average) FIGURE 14. Typical
Broken Wires at 100 mm Intervals 6 strand independent
(Smoothed Data, 3 Sample Average)
14
wire rope core (IWRC) rope
12
Number of Broken Wires
per 100 mm Interval
10
8
6
4
2
Actual Estimate IWRC
0
0
00
00
00
00
00
00
00
00
00
00
00
00
00
00
00
0
50
10
15
20
25
30
35
40
45
50
55
60
65
70
75
80
Distance on Rope (mm)
Example 3. Mooring rope inspection
This example deals with the inspection of an IWRC (Independent Wire Rope Core) mooring rope with a
diameter of 89 mm whose inspection is depicted in Figure 1.
Figure 14 shows a typical cross-sectional diagram of such a rope. For IWRC ropes, the outer wires of the
outer strands have a larger diameter than the outer core strand wires. To minimize interstrand nicking between
the outer strands and the IWRC, these ropes are designed such that the wires of the outer strands and the IWRC
are approximately parallel. (This is usually achieved by choosing a lang lay construction for the IWRC and an
ordinary lay construction for the outer strands.13) Typically, the wires of the outer strands are well supported by
their neighbors while the outer wires of the IWRC are relatively unsupported.
The result of these geometrical features is that, under fluctuating tensile loads, the outer IWRC wires are
continuously forced into the valleys between the outer strand wires and then released. This mechanism results in
secondary bending stresses in the core wires leading to large numbers of fatigue breaks. These breaks can be
very close together and can form groups of breaks. Eventually, the IWRC can completely disintegrate into short
pieces of wire about half a lay length long.
FIGURE 15. Inspection chart of 89 mm IWRC mooring rope
18.
with corrosion and severe core damage
LMA Trace
LF Trace
Figure 15 shows the results of the present mooring rope inspection. The chart recording indicates a severe
breakup of the independent wire rope core, which is strong evidence of heavy fluctuating tensile fatigue loading.
Note that the LMA and LF traces show the typical patterns of broken and missing wires (see Figure 3). The
missing wire patterns indicate that short pieces of broken IWRC wires might have fallen out of the rope. In
addition, together with the findings of a visual inspection, the chart indicates severe corrosion, including corrosion
pitting. Note that corrosion products are clearly visible in Figure 1.
10. Summary and Conclusions
For most offshore ropes, inspection solely by visual methods is either unsafe or not practical. On the other
hand, electromagnetic (EM) inspections at regular intervals can significantly increase confidence in the integrity of
offshore ropes. Similar to other industries, the offshore oil and gas industry could derive considerable benefits
from EM inspections.
EM inspections are particularly effective when they are combined with visual examinations as part of a
comprehensive inspection program. For a thorough inspection, all aspects of a rope’s condition must be
considered, including
1. the findings of a visual inspection,
2. the results of an EM rope inspection,
3. the rope’s operating conditions and damage mechanisms,
4. the history of the rope under test and that of its predecessors.
A program of periodic inspections is especially effective. In particular, periodic EM inspections allow the
documentation of a rope’s deterioration over its entire service life.
Acknowledgment. The author wants to thank Professor Richard Chaplin from The University of Reading,
England for many interesting discussions and suggestions.
References
1. Whitehead, E.A.N. “Method of Obtaining an Electrical Signal Proportional to the Cross-Sectional Area of a
Magnetic Tube or Rod,” UK Patent 913,780 (December 1962).
2. Rieger, W. “Ein Beitrag zur magnetinductiven Querschnittsmessung von Drahtseilen” (“A Contribution to the
Magnet-Inductive Cross-Sectional Area Measurement of Wire Ropes”), Doctoral Dissertation, Universität
Stuttgart, Germany (1983).
3. Weischedel, H.R. “The Inspection of Wire Ropes in Service, A Critical Review.” Materials Evaluation. Vol. 43,
No.13. American Society for Nondestructive Testing, pp. 1592-1605.
4. Weischedel, H.R. “Method and Apparatus for Magnetically Inspecting Elongated Objects for Structural
Defects.” US Patent 4,659,991 (April 1987).
5. Weischedel, H.R. “Electromagnetic Wire Rope Inspection: Signal Generation, Filtering, and Computer-Aided
Rope Evaluation.” Presented at The Nondestructive Testing of Rope. Krakow, Poland: (O.I.P.E.E.C.)
International Organization for the Study of the Endurance of Wire Rope. (September 1999)
6. Kitzinger, F. and G.A. Wint. “Magnetic Testing Device for Detecting Loss of Metallic Area and Internal and
External Defects in Elongated Objects.” US Patent 4,096,437 (June 1978).
7. Marchent, B.G. “Apparatus for Nondestructive Testing of Elongate Objects.” UK Patent Application GB 2 012
966 (December 1978).
8. Tomaiuolo, F.G. and J.G. Lang. “Method and Apparatus for Nondestructive Testing of Magnetically
Permeable Bodies Using a First Flux to Saturate the Body and a Second Flux Opposing the First Flux to
Produce a Measurable Flux.” US Patent 4,495,465 (January 1985)
9. Weischedel, H.R. “Quantitative In-Service Inspection of Wire Ropes, Applications and Theory.” International
Advances in Nondestructive Testing, Vol. 15, New York: Gordon and Breach Science Publishers (1990):
p. 83 – 118.
10. Weischedel, H.R. and C.R. Chaplin. “Inspection of Wire Ropes for Offshore Applications.” Materials
Evaluation. Vol. 49, No. 3. The American Society for Nondestructive Testing (1991): p. 362-367.
11. Weischedel, H.R. and C.R. Chaplin. “The Inspection of Offshore Wire Ropes: The State of the Art.” Paper
OTC 6969. Presented at Offshore Technology Conference. Houston, TX: (May 1992).
12. Dohm. M. An evaluation of international and local magnetic rope testing instrument defect detection
capabilities and resolution, particularly in respect to low rotation, multilayer rope constructions. Project
Number GAP 503 and GAP 353. Johannesburg, South Africa: Safety in Mines Research Advisory Committee
(1999).
13. Wire Rope Users Manual, Third Edition. Woodstock, MD: Wire Rope Technical Board (1993).