Research Report for V as of 7/8/11 - Chaikin Power Tools
•
1 recomendación•125 vistas

To order a free Chaikin Power Gauge stock research report for V go to http://www.chaikinpowertools.com/reports

Recomendados
Más contenido relacionado
Destacado
Más de Dan Oconnor
Más de Dan Oconnor (10)
Último
Último (20)
Research Report for V as of 7/8/11 - Chaikin Power Tools
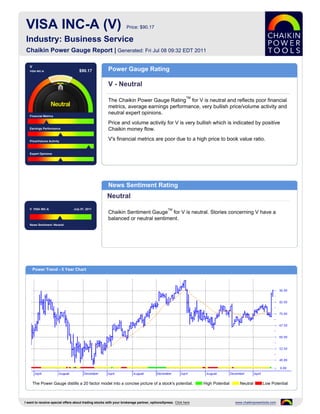
- 1. VISA INC-A (V) Price: $90.17 Industry: Business Service Chaikin Power Gauge Report | Generated: Fri Jul 08 09:32 EDT 2011 V VISA INC-A $90.17 Power Gauge Rating V - Neutral TM The Chaikin Power Gauge Rating for V is neutral and reflects poor financial metrics, average earnings performance, very bullish price/volume activity and neutral expert opinions. Financial Metrics Price and volume activity for V is very bullish which is indicated by positive Earnings Performance Chaikin money flow. Price/Volume Activity V's financial metrics are poor due to a high price to book value ratio. Expert Opinions News Sentiment Rating Neutral V VISA INC-A July 07, 2011 TM Chaikin Sentiment Gauge for V is neutral. Stories concerning V have a balanced or neutral sentiment. News Sentiment :Neutral Power Trend - 5 Year Chart The Power Gauge distills a 20 factor model into a concise picture of a stock's potential. High Potential Neutral Low Potential I want to receive special offers about trading stocks with your brokerage partner, optionsXpress. Click here www.chaikinpowertools.com
- 2. Financials & Earnings Financial Metrics Financial Metrics Rating LT Debt/Equity Ratio Bearish Price to Book Value V's financial metrics are poor. The company may be overvalued and has relatively low revenue per share. Return on Equity The rank is based on a low long term debt to equity ratio, high price to book value ratio, high return on equity and high price to sales ratio. Price to Sales Ratio Business Value Assets and Liabilities Valuation Returns Ratio TTM Ratio TTM Ratio TTM Current Ratio 2.77 Price/Book 2.87 Return on Invest 12.5% LT Debt/Equity 0.00 Price/Sales 9.28 Return on Equity 12.5% Earnings Performance Earnings Performance Rating Earnings Growth Neutral Earnings Surprise V's earnings performance has been neutral. The company has a stable 5 year earnings trend and is priced relatively high compared to next year's projected EPS. Earnings Trend The rank is based on a relatively high projected P/E ratio and consistent earnings Projected P/E Ratio over the past 5 years. Earnings Consistency 5 Year Revenue and Earnings Growth EPS Estimates 09/06 09/07 09/08 09/09 09/10 Factor Actual EPS Prev EST EPS Current Change Revenue(M) - 3,590.00 6,263.00 6,911.00 8,065.00 Quarterly EPS $1.06 $1.23 +0.17 Rev % Growth - - 74.46% 10.35% 16.70% Yearly EPS $4.01 $4.92 +0.91 EPS - - $0.96 $3.11 $4.01 Factor Actual EPS Growth Est EPS Growth Change EPS % Growth - - - 223.96% 28.94% 3-5 year EPS 33.83% 16.91% -16.92 EPS Surprise EPS Quarterly Results Estimate Actual Difference % Difference FY Qtr 1 Qtr 2 Qtr 3 Qtr 4 Total Latest Qtr $1.20 $1.23 $0.03 2.50 09/09 $0.74 $0.71 $0.97 $0.69 $3.11 1 Qtr Ago $1.21 $1.23 $0.02 1.65 09/10 $1.03 $0.96 $0.97 $1.06 $4.02 2 Qtr Ago $0.94 $0.95 $0.01 1.06 09/11 $1.23 $1.24 - - - 3 Qtr Ago $0.93 $0.97 $0.04 4.30 Fiscal Year End Month is September. I want to receive special offers about trading stocks with your brokerage partner, optionsXpress. Click here www.chaikinpowertools.com
- 3. Price Trend & Expert Opinions Price/Volume Activity Price/Volume Activity Rating Relative Strength vs Market Very Bullish Chaikin Money Flow Price and volume activity for V is very bullish. V is experiencing sustained buying and has a rising price trend. Price Trend The rank for V is based on its price strength versus the market, positive Chaikin Price Trend ROC money flow, a positive Chaikin price trend, a negative Chaikin price trend ROC and an increasing volume trend. Volume Trend Relative Strength vs S&P500 Index Chaikin Money Flow Chart shows whether V is performing better or worse than the market. Chaikin Money Flow analyzes supply and demand for a company's stock. Price Activity Price Activity Volume Activity Factor Value Factor Value Factor Value 52 Week High 90.15 % Change Price - 4 Weeks 17.95% Average Volume 20 Days 9,352,675 52 Week Low 65.48 % Change Price - 24 Weeks 27.53% Average Volume 90 Days 6,078,249 % Change YTD Rel S&P 500 17.34% % Change Price - 4 Wks Rel to S&P 12.35% Chaikin Money Flow Persistency 70% % Change Price - 24 Wks Rel to S&P 20.65% Expert Opinions Expert Opinions Earnings Estimate Revisions Neutral Short Interest Expert opinions about V are neutral. Shorting of V is low and analysts's opinions on V have been more negative recently. Insider Activity The rank for V is based on analysts revising earnings estimates upward, a low short interest ratio, pessimistic analyst opinions and price strength of the stock Analyst Opinions versus the Business Service industry group. Relative Strength vs Industry Earnings Estimate Revisions Analyst Recommendations EPS Estimates Revision Summary Current 7 Days Ago % Change Factor Value Last Week Last 4 Weeks Current Qtr 1.22 1.22 0.00% Mean this Week Strong Buy Up Down Up Down Next Qtr 1.23 1.23 0.00% Mean Last Week Strong Buy Curr Qtr 6 1 6 1 Curr Yr 8 1 9 1 Current 30 Days Ago % Change Change 0.00 Next Qtr 8 3 8 4 Current FY 4.92 4.92 0.00 Mean 5 Weeks Ago Strong Buy Next Yr 8 5 7 6 I want to receive special offers about trading stocks with your brokerage partner, optionsXpress. Click here www.chaikinpowertools.com
- 4. The Company & Its Competitors V's Competitors in Business Service News Headlines for V Company Power Historic EPS Projected EPS Profit Margin PEG PE Revenue(M) Visa Launches Travel-Themed Marketing Gauge growth growth Campaign with New Facebook Application and V 33.83% 16.91% 37.72% 1.08 20.58 8,065 National Promotion - May 23, 2011 MA 14.46% 17.18% 34.07% 1.09 21.44 5,539 NV Economic Forum chairman files for bankruptcy - May 21, 2011 ADS 14.17% 15.00% 8.14% 0.98 16.50 2,791 Summary Box: Visa 2Q profit jumps 24 percent - FIS 61.33% 13.20% 7.43% 1.03 15.13 5,270 May 5, 2011 Visa deposits $400M in escrow account - Mar FISV 1.30% 12.50% 11.67% 1.16 15.83 4,133 28, 2011 HPY 17.72% 16.33% 1.46% 1.28 25.49 1,864 Visa PlaySpan Merger 03 01 - Mar 1, 2011 LPS 3.62% 9.33% 11.81% 0.80 5.68 2,456 EFX 5.50% 10.00% 14.15% 1.43 14.98 1,860 Company Details Company Profile VISA INC-A VISA operates the world's largest retail electronic payments network and is one of the P.O. BOX 8999 most recognized global financial services brands. Visa facilitates global commerce SAN FRANCISCO, CA 94128-8999 through the transfer of value and information among financial institutions, merchants, USA consumers, businesses and government entities. Phone: (415) 932-2100 Website: http://http://www.corporate.visa.com Full Time Employees: 6,800 Sector: Business Services Power Gauge Ratings are created using a relative ranking system that assigns a rank of 0 to 100 (100 being the highest) to each stock in the universe. Rank is calculated by evaluating each of the stocks factors and combining them into a single number using a weighting formula. A stock's rank ranges from 100-0, where 100 is the strongest, and a rank of 95 indicates the stock is better than 95% of the stocks in the universe. Chaikin Stock Research(CSR) is not registered as a securities broker dealer or investment advisor with either the U.S. Securities and Exchange Commission or with any state securities regulatory authority. CSR is not responsible for trades executed by users of this research report, our web site or mobile app based on the information included herein. The information presented in this report does not represent a recommendation to buy or sell stocks or any financial instrument nor is it intended as an endorsement of any security or investment. The information in this report is generic by nature and is not personalized to the specific financial situation of any individual. The user bears complete responsibility for their own investment research and should seek the advice of a qualified investment professional before making any investment decisions. Copyright (c) 1978-(Present) by ZACKS Investment Research, Inc ("ZACKS"). The information, data, analyses and opinions contained herein (1) includes the confidential and proprietary information of ZACKS, (2) may not be copied or redistributed, for any purpose, (3) does not constitute investment advice offered by ZACKS, (4) are provided solely for informational purposes, and (5) are not warranted or represented to be correct, complete, accurate or timely. ZACKS shall not be responsible for investment decisions, damages or other losses resulting from, or related to, use of this information, data, analyses or opinions. Past performance is no guarantee of future performance. ZACKS is not affiliated with Chaikin Power Tools. This report from Chaikin Power Tools is for informational purposes only and is not a recommendation to buy or sell securities. LM 2.3 DS 3.0 LS 2.1 Data Provided by ZACKS Investment Research, Inc., www.zacks.com Special offers to trade stocks from optionsXpress: www.chaikinpowertools.com