Stock Research Report for GOOG as of 6/23/11 - Chaikin Power Tools
•
1 recomendación•153 vistas

To order a free Chaikin Power Gauge stock research report for GOOG go to http://www.chaikinpowertools.com/reports

Recomendados
Recomendados
Más contenido relacionado
Último
Último (20)
Destacado
Destacado (20)
Stock Research Report for GOOG as of 6/23/11 - Chaikin Power Tools
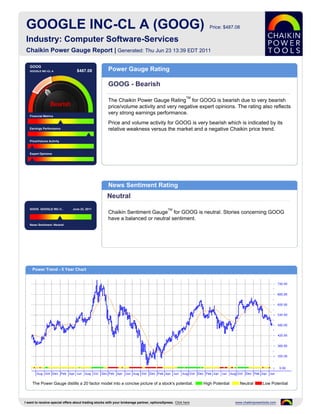
- 1. GOOGLE INC-CL A (GOOG) Price: $487.08 Industry: Computer Software-Services Chaikin Power Gauge Report | Generated: Thu Jun 23 13:39 EDT 2011 GOOG GOOGLE INC-CL A $487.08 Power Gauge Rating GOOG - Bearish TM The Chaikin Power Gauge Rating for GOOG is bearish due to very bearish price/volume activity and very negative expert opinions. The rating also reflects very strong earnings performance. Financial Metrics Price and volume activity for GOOG is very bearish which is indicated by its Earnings Performance relative weakness versus the market and a negative Chaikin price trend. Price/Volume Activity Expert Opinions News Sentiment Rating Neutral GOOG GOOGLE INC-C.. June 23, 2011 TM Chaikin Sentiment Gauge for GOOG is neutral. Stories concerning GOOG have a balanced or neutral sentiment. News Sentiment :Neutral Power Trend - 5 Year Chart The Power Gauge distills a 20 factor model into a concise picture of a stock's potential. High Potential Neutral Low Potential I want to receive special offers about trading stocks with your brokerage partner, optionsXpress. Click here www.chaikinpowertools.com
- 2. Financials & Earnings Financial Metrics Financial Metrics Rating LT Debt/Equity Ratio Neutral Price to Book Value GOOG's financial metrics are neutral. The company does not hold much long term debt and may be overvalued. Return on Equity The rank is based on a low long term debt to equity ratio, high price to book value ratio, high return on equity and high price to sales ratio. Price to Sales Ratio Business Value Assets and Liabilities Valuation Returns Ratio TTM Ratio TTM Ratio TTM Current Ratio 4.64 Price/Book 3.21 Return on Invest 19.8% LT Debt/Equity 0.00 Price/Sales 5.35 Return on Equity 19.8% Earnings Performance Earnings Performance Rating Earnings Growth Very Bullish Earnings Surprise GOOG's earnings performance has been very strong. The company has a history of strong earnings growth and has a stable 5 year earnings trend. Earnings Trend The rank is based on high earnings growth over the past 3-5 years, worse than expected earnings in recent quarters, a relatively low projected P/E ratio and Projected P/E Ratio consistent earnings over the past 5 years. Earnings Consistency 5 Year Revenue and Earnings Growth EPS Estimates 12/06 12/07 12/08 12/09 12/10 Factor Actual EPS Prev EST EPS Current Change Revenue(M) 10,604.92 16,593.99 21,795.55 23,650.56 29,321.00 Quarterly EPS $5.71 $6.79 +1.08 Rev % Growth 72.76% 56.47% 31.35% 8.51% 23.98% Yearly EPS $26.69 $29.50 +2.81 EPS $10.21 $13.53 $13.46 $20.62 $26.69 Factor Actual EPS Growth Est EPS Growth Change EPS % Growth 92.28% 32.52% -0.52% 53.19% 29.44% 3-5 year EPS 38.61% 17.45% -21.16 EPS Surprise EPS Quarterly Results Estimate Actual Difference % Difference FY Qtr 1 Qtr 2 Qtr 3 Qtr 4 Total Latest Qtr $7.14 $7.04 $-0.10 -1.40 12/09 $4.51 $4.70 $5.18 $6.22 $20.61 1 Qtr Ago $7.16 $7.81 $0.65 9.08 12/10 $6.15 $5.71 $6.80 $7.95 $26.61 2 Qtr Ago $5.92 $6.72 $0.80 13.51 12/11 $7.15 - - - - 3 Qtr Ago $5.78 $5.71 $-0.07 -1.21 Fiscal Year End Month is December. I want to receive special offers about trading stocks with your brokerage partner, optionsXpress. Click here www.chaikinpowertools.com
- 3. Price Trend & Expert Opinions Price/Volume Activity Price/Volume Activity Rating Relative Strength vs Market Very Bearish Chaikin Money Flow Price and volume activity for GOOG is very bearish. GOOG has underperformed the S&P 500 over 26 weeks and has a declining price trend. Price Trend The rank for GOOG is based on its relative weakness versus the market, Price Trend ROC negative Chaikin money flow, a negative Chaikin price trend, a positive Chaikin price trend ROC and a decreasing volume trend. Volume Trend Relative Strength vs S&P500 Index Chaikin Money Flow Chart shows whether GOOG is performing better or worse than the market. Chaikin Money Flow analyzes supply and demand for a company's stock. Price Activity Price Activity Volume Activity Factor Value Factor Value Factor Value 52 Week High 639.63 % Change Price - 4 Weeks -6.29% Average Volume 20 Days 2,307,322 52 Week Low 436.07 % Change Price - 24 Weeks -20.04% Average Volume 90 Days 2,659,460 % Change YTD Rel S&P 500 -19.23% % Change Price - 4 Wks Rel to S&P -3.86% Chaikin Money Flow Persistency 38% % Change Price - 24 Wks Rel to S&P -20.70% Expert Opinions Expert Opinions Earnings Estimate Revisions Very Bearish Short Interest Expert opinions about GOOG are very negative. Analysts are lowering their EPS estimates for GOOG and analysts's opinions on GOOG have been more negative Insider Activity recently. The rank for GOOG is based on analysts revising earnings estimates downward, Analyst Opinions a low short interest ratio, insiders not purchasing significant amounts of stock, pessimistic analyst opinions and relative weakness of the stock versus the Relative Strength vs Industry Computer Software-Services industry group. Earnings Estimate Revisions Analyst Recommendations EPS Estimates Revision Summary Current 7 Days Ago % Change Factor Value Last Week Last 4 Weeks Current Qtr 6.78 6.79 -0.15% Mean this Week Strong Buy Up Down Up Down Next Qtr 7.17 7.18 -0.14% Mean Last Week Strong Buy Curr Qtr 0 1 0 3 Curr Yr 0 0 0 2 Current 30 Days Ago % Change Change 0.00 Next Qtr 0 1 0 3 Current FY 29.50 29.64 -0.14 Mean 5 Weeks Ago Strong Buy Next Yr 0 0 0 2 I want to receive special offers about trading stocks with your brokerage partner, optionsXpress. Click here www.chaikinpowertools.com
- 4. The Company & Its Competitors GOOG's Competitors in Computer Software-Services News Headlines for GOOG Company Power Historic EPS Projected EPS Profit Margin PEG PE Revenue(M) Motorola Mobility shares fall on analyst Gauge growth growth downgrade - Jun 21, 2011 GOOG 38.61% 17.45% 28.43% 0.96 17.85 29,321 Bits: Justice Department to Review Google's PAET 77.39% 12.00% -3.48% - - 1,624 Admeld Deal - Jun 17, 2011 RIM Shares Tumble as Forecast Slashed Again AOL -23.81% 11.10% -35.40% 3.25 9.36 2,417 - Jun 16, 2011 BIDU 103.60% 59.17% 46.47% 0.81 70.55 1,202 Google strikes deal to add Admeld to arsenal - Jun 13, 2011 IGLD 185.33% - 0.42% - - 2,460 Bits: Google In Talks to Buy Admeld for $400 YHOO 4.32% 16.83% 19.26% 1.17 19.52 6,324 Million - Jun 9, 2011 AKAM 30.38% 17.29% 17.08% 1.44 28.44 1,024 Company Details Company Profile GOOGLE INC-CL A Google is a public and profitable company focused on search services. Named for the 1600 AMPHITHEATRE PARKWAY mathematical term googol, Google operates web sites at many international domains, MOUNTAIN VIEW, CA 94043 with the most trafficked being www.google.com. Google is widely recognized as the USA World's Best Search Engine and is fast, accurate and easy to use. The company also Phone: 6506234000 serves corporate clients, including advertisers, content publishers and site managers with Fax: 650-253-0001 cost-effective advertising and a wide range of revenue generating search services. Website: Google's breakthrough technology and continued innovation serve the company's http://http://www.google.com mission of organizing the world's information and making it universally accessible and Full Time Employees: 24,400 useful. Sector: Computer and Technology Power Gauge Ratings are created using a relative ranking system that assigns a rank of 0 to 100 (100 being the highest) to each stock in the universe. Rank is calculated by evaluating each of the stocks factors and combining them into a single number using a weighting formula. A stock's rank ranges from 100-0, where 100 is the strongest, and a rank of 95 indicates the stock is better than 95% of the stocks in the universe. Chaikin Stock Research(CSR) is not registered as a securities broker dealer or investment advisor with either the U.S. Securities and Exchange Commission or with any state securities regulatory authority. CSR is not responsible for trades executed by users of this research report, our web site or mobile app based on the information included herein. The information presented in this report does not represent a recommendation to buy or sell stocks or any financial instrument nor is it intended as an endorsement of any security or investment. The information in this report is generic by nature and is not personalized to the specific financial situation of any individual. The user bears complete responsibility for their own investment research and should seek the advice of a qualified investment professional before making any investment decisions. Copyright (c) 1978-(Present) by ZACKS Investment Research, Inc ("ZACKS"). The information, data, analyses and opinions contained herein (1) includes the confidential and proprietary information of ZACKS, (2) may not be copied or redistributed, for any purpose, (3) does not constitute investment advice offered by ZACKS, (4) are provided solely for informational purposes, and (5) are not warranted or represented to be correct, complete, accurate or timely. ZACKS shall not be responsible for investment decisions, damages or other losses resulting from, or related to, use of this information, data, analyses or opinions. Past performance is no guarantee of future performance. ZACKS is not affiliated with Chaikin Power Tools. This report from Chaikin Power Tools is for informational purposes only and is not a recommendation to buy or sell securities. LM 2.3 DS 3.0 LS 2.1 Data Provided by ZACKS Investment Research, Inc., www.zacks.com Special offers to trade stocks from optionsXpress: www.chaikinpowertools.com