Stock Research Report for WFC as of 8/17/11 - Chaikin Power Tools
•
1 recomendación•163 vistas

To order a free Chaikin Power Gauge stock research report for WFC go to http://www.chaikinpowertools.com/reports

Recomendados
Recomendados
Más contenido relacionado
Más de Dan Oconnor
Más de Dan Oconnor (7)
Último
Último (20)
Stock Research Report for WFC as of 8/17/11 - Chaikin Power Tools
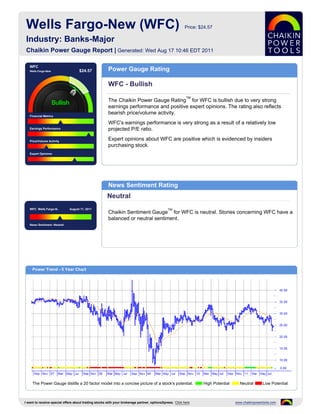
- 1. Wells Fargo-New (WFC) Price: $24.57 Industry: Banks-Major Chaikin Power Gauge Report | Generated: Wed Aug 17 10:46 EDT 2011 WFC Wells Fargo-New $24.57 Power Gauge Rating WFC - Bullish TM The Chaikin Power Gauge Rating for WFC is bullish due to very strong earnings performance and positive expert opinions. The rating also reflects bearish price/volume activity. Financial Metrics WFC's earnings performance is very strong as a result of a relatively low Earnings Performance projected P/E ratio. Price/Volume Activity Expert opinions about WFC are positive which is evidenced by insiders purchasing stock. Expert Opinions News Sentiment Rating Neutral WFC Wells Fargo-N.. August 17, 2011 TM Chaikin Sentiment Gauge for WFC is neutral. Stories concerning WFC have a balanced or neutral sentiment. News Sentiment :Neutral Power Trend - 5 Year Chart The Power Gauge distills a 20 factor model into a concise picture of a stock's potential. High Potential Neutral Low Potential I want to receive special offers about trading stocks with your brokerage partner, optionsXpress. Click here www.chaikinpowertools.com
- 2. Financials & Earnings Financial Metrics Financial Metrics Rating LT Debt/Equity Ratio Neutral Price to Book Value WFC's financial metrics are neutral. The company generates high free cash flow relative to market capitalization and is carrying too much long term debt. Return on Equity The rank is based on a high long term debt to equity ratio, low price to book value, high return on equity, high price to sales ratio and relatively high cash flow. Price to Sales Ratio Business Value Assets and Liabilities Valuation Returns Ratio TTM Ratio TTM Ratio TTM Current Ratio 0.95 Price/Book 1.03 Return on Invest 5.1% LT Debt/Equity 1.32 Price/Sales 1.39 Return on Equity 11.9% Earnings Performance Earnings Performance Rating Earnings Growth Very Bullish Earnings Surprise WFC's earnings performance has been very strong. The company is priced relatively low compared to next year's projected EPS and has a history of strong earnings growth. Earnings Trend The rank is based on high earnings growth over the past 3-5 years, an upward Projected P/E Ratio trend in earnings this year, a relatively low projected P/E ratio and consistent earnings over the past 5 years. Earnings Consistency 5 Year Revenue and Earnings Growth EPS Estimates 12/06 12/07 12/08 12/09 12/10 Factor Actual EPS Prev EST EPS Current Change Revenue(M) 47,979.00 53,593.00 51,980.00 98,636.00 93,249.00 Quarterly EPS $0.60 $0.72 +0.12 Rev % Growth 18.74% 11.70% -3.01% 89.76% -5.46% Yearly EPS $2.23 $2.82 +0.59 EPS $2.52 $2.41 $0.76 $1.76 $2.23 Factor Actual EPS Growth Est EPS Growth Change EPS % Growth 12.00% -4.37% -68.46% 131.58% 26.70% 3-5 year EPS 22.35% 8.33% -14.02 EPS Surprise EPS Quarterly Results Estimate Actual Difference % Difference FY Qtr 1 Qtr 2 Qtr 3 Qtr 4 Total Latest Qtr $0.69 $0.70 $0.01 1.45 12/09 $0.56 $0.58 $0.56 $0.08 $1.78 1 Qtr Ago $0.67 $0.67 $0.00 0.00 12/10 $0.45 $0.55 $0.60 $0.62 $2.22 2 Qtr Ago $0.62 $0.61 $-0.01 -1.61 12/11 $0.68 $0.70 - - - 3 Qtr Ago $0.56 $0.60 $0.04 7.14 Fiscal Year End Month is December. I want to receive special offers about trading stocks with your brokerage partner, optionsXpress. Click here www.chaikinpowertools.com
- 3. Price Trend & Expert Opinions Price/Volume Activity Price/Volume Activity Rating Relative Strength vs Market Bearish Chaikin Money Flow Price and volume activity for WFC is bearish. WFC has underperformed the S&P 500 over 26 weeks and is experiencing sustained selling. Price Trend The rank for WFC is based on its relative weakness versus the market, negative Price Trend ROC Chaikin money flow and a positive Chaikin price trend ROC. Volume Trend Relative Strength vs S&P500 Index Chaikin Money Flow Chart shows whether WFC is performing better or worse than the market. Chaikin Money Flow analyzes supply and demand for a company's stock. Price Activity Price Activity Volume Activity Factor Value Factor Value Factor Value 52 Week High 34.10 % Change Price - 4 Weeks -13.59% Average Volume 20 Days 48,876,736 52 Week Low 22.88 % Change Price - 24 Weeks -22.43% Average Volume 90 Days 39,825,883 % Change YTD Rel S&P 500 -16.93% % Change Price - 4 Wks Rel to S&P -3.88% Chaikin Money Flow Persistency 42% % Change Price - 24 Wks Rel to S&P -15.05% Expert Opinions Expert Opinions Earnings Estimate Revisions Bullish Short Interest Expert opinions about WFC are positive. Insiders are net buyers of WFC's stock and analysts are raising their EPS estimates for WFC. Insider Activity The rank for WFC is based on analysts revising earnings estimates upward, a low short interest ratio, insiders purchasing stock, pessimistic analyst opinions and Analyst Opinions relative weakness of the stock versus the Banks-Major industry group. Relative Strength vs Industry Earnings Estimate Revisions Analyst Recommendations EPS Estimates Revision Summary Current 7 Days Ago % Change Factor Value Last Week Last 4 Weeks Current Qtr 0.72 0.72 0.00% Mean this Week Buy Up Down Up Down Next Qtr 0.73 0.73 0.00% Mean Last Week Buy Curr Qtr 0 1 10 2 Curr Yr 0 2 11 4 Current 30 Days Ago % Change Change 0.00 Next Qtr 0 2 9 3 Current FY 2.82 2.78 0.04 Mean 5 Weeks Ago Buy Next Yr 0 2 12 5 I want to receive special offers about trading stocks with your brokerage partner, optionsXpress. Click here www.chaikinpowertools.com
- 4. The Company & Its Competitors WFC's Competitors in Banks-Major News Headlines for WFC Company Power Historic EPS Projected EPS Profit Margin PEG PE Revenue(M) Wells Fargo and Related Companies Revitalize Gauge growth growth and Preserve Affordable Housing in WFC 22.35% 8.33% 15.97% 1.05 9.52 93,249 Chicago’s Southside - Aug 8, 2011 USB 4.55% 6.25% 19.73% 1.53 10.87 20,518 Boulder developer Jim Chanin files for bankruptcy - Aug 6, 2011 BBT 7.47% 6.75% 9.05% 1.75 15.30 11,072 FL Tepper FINRA claim 07 25 - Jul 25, 2011 JPM 22.29% 6.75% 19.85% 1.07 7.70 102,694 Wells Fargo will turn spotlight on the arts - Jul 22, 2011 PNC 31.49% 6.67% 23.24% 1.15 7.35 17,096 Wells Fargo will turn spotlight on the arts - Jul C 2.80% 7.66% 12.35% 0.95 9.10 86,601 22, 2011 BAC 15.58% 7.80% -14.72% - - 134,194 BK 14.72% 7.00% 18.14% 1.31 9.13 13,875 Company Details Company Profile WELLS FARGO-NEW Wells Fargo & Company is a diversified financial services company providing banking, 420 MONTGOMERY STREET insurance, investments, mortgage and consumer finance services through stores, its SAN FRANCISCO, CA 94163 Internet site and other distribution channels across North America as well as USA internationally. (Company Press Release) Phone: 6126671234 Fax: 651-450-4033 Website: http://http://www.wellsfargo.com Full Time Employees: 272,200 Sector: Finance Power Gauge Ratings are created using a relative ranking system that assigns a rank of 0 to 100 (100 being the highest) to each stock in the universe. Rank is calculated by evaluating each of the stocks factors and combining them into a single number using a weighting formula. A stock's rank ranges from 100-0, where 100 is the strongest, and a rank of 95 indicates the stock is better than 95% of the stocks in the universe. Chaikin Stock Research(CSR) is not registered as a securities broker dealer or investment advisor with either the U.S. Securities and Exchange Commission or with any state securities regulatory authority. CSR is not responsible for trades executed by users of this research report, our web site or mobile app based on the information included herein. The information presented in this report does not represent a recommendation to buy or sell stocks or any financial instrument nor is it intended as an endorsement of any security or investment. The information in this report is generic by nature and is not personalized to the specific financial situation of any individual. The user bears complete responsibility for their own investment research and should seek the advice of a qualified investment professional before making any investment decisions. Copyright (c) 1978-(Present) by ZACKS Investment Research, Inc ("ZACKS"). The information, data, analyses and opinions contained herein (1) includes the confidential and proprietary information of ZACKS, (2) may not be copied or redistributed, for any purpose, (3) does not constitute investment advice offered by ZACKS, (4) are provided solely for informational purposes, and (5) are not warranted or represented to be correct, complete, accurate or timely. ZACKS shall not be responsible for investment decisions, damages or other losses resulting from, or related to, use of this information, data, analyses or opinions. Past performance is no guarantee of future performance. ZACKS is not affiliated with Chaikin Power Tools. This report from Chaikin Power Tools is for informational purposes only and is not a recommendation to buy or sell securities. LM 2.3 DS 3.0 LS 2.1 Data Provided by ZACKS Investment Research, Inc., www.zacks.com Special offers to trade stocks from optionsXpress: www.chaikinpowertools.com