Decentralized Rural Development Planning : A Case Study of Khok Charoen District, Lopburi Province, Thailand (Part III)
•
1 recomendación•1,031 vistas

Social, overall development and project proposals

Recomendados
Recomendados
Más contenido relacionado
Más de Dr.Choen Krainara
Más de Dr.Choen Krainara (20)
Último
Último (20)
Decentralized Rural Development Planning : A Case Study of Khok Charoen District, Lopburi Province, Thailand (Part III)
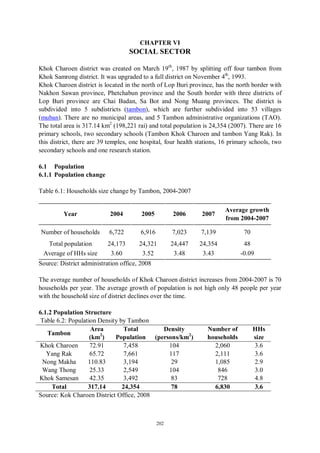
- 1. CHAPTER VI SOCIAL SECTOR Khok Charoen district was created on March 19th, 1987 by splitting off four tambon from Khok Samrong district. It was upgraded to a full district on November 4th, 1993. Khok Charoen district is located in the north of Lop Buri province, has the north border with Nakhon Sawan province, Phetchabun province and the South border with three districts of Lop Buri province are Chai Badan, Sa Bot and Nong Muang provinces. The district is subdivided into 5 subdistricts (tambon), which are further subdivided into 53 villages (muban). There are no municipal areas, and 5 Tambon administrative organizations (TAO). The total area is 317.14 km2 (198,221 rai) and total population is 24,354 (2007). There are 16 primary schools, two secondary schools (Tambon Khok Charoen and tambon Yang Rak). In this district, there are 39 temples, one hospital, four health stations, 16 primary schools, two secondary schools and one research station. 6.1 Population 6.1.1 Population change Table 6.1: Households size change by Tambon, 2004-2007 Average growth Year 2004 2005 2006 2007 from 2004-2007 Number of households 6,722 6,916 7,023 7,139 70 Total population 24,173 24,321 24,447 24,354 48 Average of HHs size 3.60 3.52 3.48 3.43 -0.09 Source: District administration office, 2008 The average number of households of Khok Charoen district increases from 2004-2007 is 70 households per year. The average growth of population is not high only 48 people per year with the household size of district declines over the time. 6.1.2 Population Structure Table 6.2: Population Density by Tambon Area Total Density Number of HHs Tambon 2 (km ) Population (persons/km2) households size Khok Charoen 72.91 7,458 104 2,060 3.6 Yang Rak 65.72 7,661 117 2,111 3.6 Nong Makha 110.83 3,194 29 1,085 2.9 Wang Thong 25.33 2,549 104 846 3.0 Khok Samesan 42.35 3,492 83 728 4.8 Total 317.14 24,354 78 6,830 3.6 Source: Kok Charoen District Office, 2008 202
- 2. In terms of population, tambon Yang Rak and Khok Charoen have the highest population of 7,661 and 7,458 persons respectively. Among tambons, again Yang Rak has the highest density, 117 people per km2, followed respectively by Khok Charoen and Wang Thong 104 people per km2, Khok Samesan has 83 persons per km2. The lowest density is Tambon Nong Makha has 29 persons per km2. Population Structure Figure 6.1: Population Distributions by Tambon S ource: Khok Charoen District Office, 2007 Population is mostly concentrated in two tambons. Yank Rak and Khok Charoen tambons are most densily populated tambon having 31.4% and 30.7% respectively followed by khok Samae San and Nong Makha tambons with 14.3% and 13.0%. Wang Thong has the least value with 10.6% in the district. 6.1.3 Composition of the population by age and gender The distribution of population in terms of age and gender varies among different groups of age and the highest population fall in the group of 26 to 40 years old. It has been cleared from the figure 6.2 that in 35 age group, female are more as compare to the males. 203
- 3. Figure 6.2: Population by age and gender Population by age and sex, Khok Charoen District 2006 1400 1200 1000 People 800 Male 600 Female 400 200 0 0-5 6-10 11- 16- 21- 26- 31- 36- 41- 46- 51- 56- 61- 66- 71- 76- >80 15 20 25 30 35 40 45 50 55 60 65 70 75 80 Age grouping Source: Khok Charoen district website Table 6.3: Population by gender, 2007 Figure 6.3: Gender balance Population distribution by gender, Tambon Male Female Total Khok Charoen district, 2007 Khok Charoen 3,823 3,696 7,519 Yang Rak 3,823 3,847 7,670 50.2 50.2 % Nong Makha 1,599 1,577 3,176 49.8% Wang Thong 1,289 1,301 2,590 Khok Samesan 1,747 1,757 3,504 Total 12,218 12,178 24,459 Male Female Source: District administration office, 2008 The population ratio between male (49%) and females (51%) is very balance in each tambons in the Khok Charoen district. 6.1.4 Population Pyramid In 2006, the population pyramid of Khok Charoen district, generally, both male and female population is equal, but number of women is higher than men after 79 years old up. However, it has no significant affect and the ratio of sixty year populations sharply decreased, so there is no tendency to aging of population. Moreover, the number of working age from 15 to 44 is very high which is a potential in term of labor force. Whereas the population group of 0-14 years is low, this shows that birth rate is very low. 204
- 4. Figure 6.4: Population pyramid S ource: Khok Charoen district website, 2008 6.1.5 Sex ratio and dependency ratio In 2007, in Khok Charoen district, the total number of male is 12,281 and female is 12,178 giving the total number of female per 100 male is 101:100 as compare to 12163 male to 12010 female in 2004 with ratio 99:100 that mean the number of female population has been increased in last three years. Table 6.4: Comparison of Male and Female Sex Ratio Population 2004 Population 2007 Total Number of female Number of female per Female Male Female Male per 100 male 100 male Khok Charoen 3,565 3,697 96:100 3,696 3,823 103: 100 Yang Rak 3,839 3,839 100:100 3,847 3,823 99: 100 Khok Same San 1,750 1,698 103:100 1,757 1,747 99: 100 Nong Makha 1,592 1,649 97:100 1,577 1,599 101: 100 Wang Thong 1,264 1,280 99:100 1,301 1,289 99: 100 Total 12,010 12,163 99:100 12,178 12,281 101: 100 Source: District administration office, 2008 Table 6.5 shows the division of population in four broader groupers i.e. infant with age group less than five , school going with age 6 – 15 year and working population with age 16-60 and old age having more than 60year of age. Population of infant and schooling groups are 8.1% and 15.5 % respectively; the working group has the highest portion 67.5%; and the group 205
- 5. over 60 year old is 8.9%. The total dependency ratio is calculated as 32.5%. It indicates that there is nearly 33 people are depended on others. Therefore, there should be development plans and programs to assure their good life living standard. Table 6.5: The dependency and dependency ratio Age grouping Description Male Female Total population % Less than 5 Infant population 985 965 1,950 8.1 Schooling 6-15 1,895 1,807 3,702 15.5 population 16-60 Working population 8,154 7,981 16,135 67.5 Dependent More than 60 988 1,135 2,123 8.9 population Total 12,022 11,888 23,910 100 Source: District administration office, 2008 6.1.6 Population Projection When there is a slightly increase in population; Gibbs is the most suitable method for applying population projection in Thailand, particularly in Khok Charoen district. Based on the district population data 2002 to 2007 (5 years period), the district and Tambon population have been projected using Gibbs Technique for 2015 and 2020 as followed: Formulation used: Pt = P1 + (P1 * R/100 * t) R (P1 – P0) / t R= * 100 (P1 + P0)/2 Where as, Pt = Projected population (2015 and 2020) P1 = Current year population (2007= 24,354) P0 = Base year population (recent past census 2002= 23,716) t = Time interval 2015 – 2007 = 8; 2020 – 2007 = 13; R = Population Growth Rate, calculated base on the data available for Khok Charoen District. (P1 - Po) / t (24,354 – 23,716)/5 R= *100 = *100 = 0.338 (P1 + Po) / 2 (24,354+ 23,716) / 2 The population projected Khok Charoen District: P2010 = 24,354 + 24,354 * (0.338/100)*3 = 24,601 P2015 = 24,354 + 24,354 * (0.338/100)*8 = 25,012 206
- 6. P2020 = 24,354 + 24,354 * (0.338/100)*13 = 25,424 Table 6.6: Population projected by Tambon 2015 and 2020 Population Population projection No Tambon distribution 2010 2015 2020 in 2007 (%) Population Density Population Density Population Density 1 Khok Charoen 30.6 7,534 103 7,660 105 7,786 107 2 Yang Rak 31.5 7,739 118 7,868 120 7,998 122 3 Nong Makha 13.1 3,226 29 3,280 30 3,334 30 4 Wang Thong 10.5 2,575 102 2,618 103 2,661 105 5 Khok Samesan 14.3 3,527 83 3,586 85 3,645 86 Total 100 24,601 87 25,012 88 25,424 90 Source: Collection and calculation, 2008 6.1.7 Population Growth Rate Population data has shown decline in the growth rate over the time from 2003 to 2007 from 0.95% to 0.05%.Among the average growth rate of five Tambons, only the total population growth of Tambon Nong Kha has decreased 0.1% since this area has low production of farming and the villagers also do not earn too much from non-agriculture occupations (NRD- 2C, 2007). Tambon Khok Charoen has the growth rate increased gradually from 2003 to 2006 and grew sharply in 2006-2007 at 3.18%; on the contrary, growth rate has also been decreased in other three Tambons Yang Rak, Nong Makha and Wang Thong in 2007. Moreover, the population rate has been downed very quickly because of the policy of government for controlling the number of children in each family. In addition, in the context of economic development, both men and women want to work more, and they want to have the best condition of education and health for their children, therefore the less number of children they have, better condition they can give to their children. Table 6.7: The population growth rate Khok Charoen district, 2003-2007 Tambon Average Population growth rate (%) population GR Year 2003-2004 2004-2005 2005-2006 2006-2007 2003-2007 Khok Charoen 0.14 0.18 0.16 3.18 0.92 Yang Rak 1.16 0.52 0.87 -1.48 0.27 Nong Makha 1.60 1.08 -0.34 -2.73 -0.10 Wang Thong 1.60 1.85 0.77 -0.80 0.86 Khok Samea San 1.11 0.38 1.10 0.14 0.68 Average 0.95 0.61 0.52 0.05 0.53 Source: Khok Charoen District Office, Jan 2008 207
- 7. Figure 6.5: Population Growth Rate Population Growth Rate, Khok Charoen district, 2003-2007 1.00 0.80 r t ae 0.60 G w rt o h 0.40 0.20 0.00 Khok Charoen Yang Rak Nong Makha Wang Thong Khok Samea -0.20 San Tambon Source: Khok Charoen District Office, Jan 2008 6.1.8 Birth and Death Rates Table 6.8: Birth and Death Rates Khok Charoen district, 2007 Tambon Population Birth Death Number of birth rate per death rate Khok Charoen 7,519 78 39 2 Yang Rak 7,670 1 20 0.05 Nong Makha 3,176 0 17 0 Wang Thong 2,590 0 10 0 Khok Samea San 3,504 1 8 0.125 Total (People) 24,459 80 94 0.851 Rate (%) 0.33 0.38 Source: Khok Charoen district office, 2008 208
- 8. The death rate is higher in the district as compare to birthrate, the birth rate is 0.33% and the death rate is 0.38%. all the Tambon has lower birth rates except the tambon Khok Charoen where birth is higher then the death rate. Moreover, the high death rate could be supposed of old age and health problems, so it needs to get attention about health services and take care of old age people. 6.1.9 Household income and saving households There are two indicators of measuring the living standards of the district in BMN i.e. household incomes and savings. The results of these two indicators have been satisfactory and all the tambon achieved the set targets in BMN as shown in table 6.9. Table 6.9: Household income Average income is not less Tambon than 23,000 baht/person/year Target (%) Achievement (%) Result Khok Charoen 70 90.4 Achieved Yang Rak 70 99.3 Achieved Nong Makha 70 97.8 Achieved Wang Thong 70 90.9 Achieved Khok Samesan 70 93.5 Achieved Average 94.4 Achieved Source: BMN, 2007 First, in terms of average income of households or poverty line, the target is 70 %, all the tambons achieved the target means that there is no household having income below poverty line. Tambon Khok Charoen and Wang Thong have the lower of achievement percentage than others 90.4% and 90.9% respectively. Moreover, the poverty rate in these two tambons is also higher than other districts 7.6% and 7.0% illustrated from the below table 6.10 of poverty rate in 2004- 2007. Table 6.10: Poverty rate by Tambon in 2004-2007 Population Average of Tambon distribution in 2007 2005 2004 poverty rate 2007 (%) 2004-2007 (%) Khok Charoen 30.6 7.4 6.8 8.6 7.6 Yang Rak 31.5 1.3 2.8 7.8 4.0 Nong Makha 13.1 1.1 5.1 8.97 5.1 Wang Thong 10.5 4.2 4.9 11.9 7.0 Khok Samesan 14.3 1.5 1.9 3.0 2.1 Average 3.1 4.3 8.1 5.2 Source: Khok Charoen district 2007 209
- 9. Second, indicator of household savings, the expected target is 80%. There are four Tambons achieved the target at the rate of 89% to 93%. There is one Tambon Nong Makha did not achieve the target and only achieve nearly 56% of house have savings. Figure 6.6: Achievement of households have saving by tambon Achivement of households have saving by Tambon, 2006 100 90 80 70 60 50 40 30 20 10 0 Khok Charoen Yang Rak Nong Makha Wang Thong Khok Samea San Source: BMN 2007 6.1.10 Characteristics of poor households There are four types of poverty in Khok Charoen district, included land problem (land less, lack of land, no land certificate); indebtedness; no house and other reasons (unpaid job, exploited job and homeless) Table 6.11: Type of poverty problems No Type of problems No. of people register Percentage 1 Land 4266 37.56 • Landless 1029 9.06 • Lack of land 925 8.14 • No land certificate 2312 20.36 2 Indebtedness 3937 34.67 • Internal 2465 21.70 • External 1472 12.96 3 No house 1307 11.51 Others (unpaid 4 1841 16.26 job/exploited job) Total 11357 100.00 Source: Khok Charoen Dsitrict office, 2008 210
- 10. The two highest reasons of poverty in Khok Charoen district are about land and debt problems 37.6% and 34.7% respectively. In terms of land problem, no land certificate is the most important problem appropriated 20.4%. Moreover, the rate of indebtedness is also very high appropriately 34.7% with most of them are internal indebt 21.7%. In addition, the situation of job exploitation and unpaid job is also the problem of the poor, especially the sugarcane workers. 6.1.11 Migration • Out- migration Out migration of each Tambon in this district shows that the high out migration occurred in three tambon: Yang Rak, Khok Charoen and Nong Makha at 30.7%, 29.1% and 21.9% respectively. Followed by Khok Samesan has the lower rate of out migration 10.4%. The lowest number of out migration is Tambon Wang Thong 7.9%. The main reasons or the push factors for out migration are; the people moved out in order to find a supplementary source of income, higher education or family settlement. According to NRD-2C the main income source of this district from agriculture, therefore which areas with low production of agriculture like Tambon Khok Charoen, Yang Rak, Nong Makha has higher immigration. During the dry season for seasonal work since lack of jobs, especially in those areas, where there is scarcity of water for agricultural practices during dry season. Table 6.12: Tambon wise out - migration Out migration Tambon Population 2007 Male Female Total Percentage Khok Charoen 7,519 92 89 181 29.1 Yang Rak 7,670 83 108 191 30.7 Nong Makha 3,176 66 70 136 21.9 Wang Thong 2,590 26 23 49 7.9 Khok Samesan 3,504 37 28 65 10.4 Total 24,459 304 318 622 100 Source: Khok Charoen District Statistic, 2008 211
- 11. • In-migration Table 6.13: Tambon wise in - migration In migration Tambon Population 2007 Male Female Total Khok Charoen 7,519 122 120 242 Yang Rak 7,670 94 106 200 Nong Makha 3,176 55 63 118 Wang Thong 2,590 51 39 90 Khok Samesan 3,504 45 32 77 Total 24,459 367 360 727 Migration rate 2.97 Source: Khok Charoen District Statistic, 2008 Pull factors In all tambons: upland crop, paddy production and other occupations like cattle rearing have high potential and many land area available for farming (500 baht/rai/year); and harvesting sugarcane season is the mostly time for labors need 6.1.12 Migration impact Social aspects • Increase burden on elderly people and they are not cared properly • The social interaction decreases such as Economic aspects • Household income increases • Farming activities decrease • Affect the efficiency of various social groups. 6.1.13 Policies and Programs on Poverty Alleviation District programs There are three main projects to solve poverty alleviation being implemented in Thailand and being adopted by the district as well. • Homeless people will be distributed the living land to settle with signature the contract with local government. • The conversion debts for poor people will be decreased the amount of pay back money with expanding the limit of time. • The poor will be distributed land for agriculture. 212
- 12. National programs of poverty reduction strategy1 According to the Government policy and the Ninth Development Plan, a poverty reduction strategy plan was formulated in 2002 in order to gain a comprehensive, multifaceted, and properly integrated plan. The strategy states the view of poverty as encompassing not only low income and consumption but also structural problems that prevent the poor to escape form poverty. The strategy consists of five main aspects: Macro Economic Strategy, Strategy for Capability Building, Strategy for Social Safety Net Improvement, Natural Resources Management Strategy, and Public Sector Restructuring Strategy. These strategies will lead to three fundamental targets: (1) to reduce the incidence of the poverty to be less than 12 percent of the population in 2006; (2) to redistribute and extend the provision of economic and social services, so that both urban and rural poor will have a more equitable access to basic services; and (3) to reduce inequality among the poor and others by readjusting structural mechanisms that have been obstructive to the poverty reduction. Macro-Economic Strategy: This strategy is drawn up to construct fair and equitable economic growth contributing to more employment in agricultural sector, which is the main source of income of the poor. This strategy also emphasizes on the necessity of an enactment of policies as the following to advocate just and equitable economy. These policies aim to (1) Set up suitable inflation rate to support economic expansion; (2) Urge progressive tax especially land tax (to distribute land holding), general property tax and inheritance tax; (3) Advance legislative system to cover the protection for micro-enterprises; (4) Provide equitable access for the poor to information and technical assistance that the poor can effectively utilize to cope with the risks. Strategy for capability building: As widely known, providing education and career-relating knowledge is the fundamental requirement for refining the poor’s capabilities and analytical skills. The training activities should be held with the purpose to prepare the poor to deal with the adverse risks and shocks. Furthermore, as the majority of the poor are those who work in micro- enterprises with less and unequal access to basic services and legal lending institutions, the establishment of legal lending institutions that provide low interest rates for the urban poor is necessary to soothe the poverty. Moreover, community empowerment towards self-reliance is another essential practice. The first step is to enhance collective process to solve poverty and vulnerability through empowering local communities, which can function as a means to demand for public services and organize their voices in designing policies and national development plans. Strategy for Social Safety Net Improvement: A critical condition for accomplishing capability building strategy is an equitable access to education and professional training which should be diversified and adjusted in accordance with the needs and skills of the poor and the 1 Knowledge Management and Poverty Reduction Policy Unit Community Economic Development and Income Distribution Office Office of the National Economic and Social Development Board 213
- 13. underprivileged. There is also a need for improving regulations on loan programs for education to be more open for the poor and the underprivileged. Another means to enable the poor and the underprivileged to income-generating assets is micro- credit from lending institutions run by the Government. Also, an establishment of community managed social fund programs with the support from public sector is required so that people in the community can manage the money to cope with adverse shocks. Natural Resources Management Strategy: The most effective natural resources management with the main focus on land and water management for the poor farmers should grant the community to dramatically participate in every level of planning and implementation. There should, consequently, be an establishment of local organization whose responsibility embraces running community managed fund for natural resources restoration. The local organization can also operate as a community stage for expressing local residents’ opinion. To make natural resources management successful, an Act of legislation relating to this issue such as forestry, fishery and also land and water need to be drawn up and brought into practice soon. Public Sector Restructuring Strategy: The role of central government has been changed from designing policies and controlling implementation process to facilitating and supporting the local institution/organization to work and participate in analyzing and solving the problems along side with other actors. The local institution and organization previously were objects. They adopted policies from the central government and implemented by themselves. Nowadays, they turn to be subjects as they motivate changes in policy designing and implementation process and work as coordinators between the central government and local people. The local people are presently required to aware of their power to bring positive changes to their communities through their active participation with the application of local wisdom in the process of designing and implementation of plans. 6.1.14 Summary of population Problems • Unequal distribution of population leads to imbalance of general development within the district. • There is a fluctuation in the growth rate in various Tambon • Migrating to other areas during the dry season Potentials • High proportion of population at working group age • Average income of household members is not less than 20,000 Bath/person/year. • There is a good gender balance in the district. • There are good supporting policies not only national programs but also district programs on poverty alleviation. 6.2 Public Health and Sanitation – Introduction 214
- 14. 6.2 Khok Charoen district has well established network of health facilities and health infrastructure, the only concern in this district is shortage of doctors and nurses especially in public health stations. The figure depits the ratio of public health institutes with respect to population and the results are quite satisfactory 6.2.1 Health policies and strategies The MOPH is authorized and responsible for the strengthening of the public health and hygiene, preventing and controlling diseases and recovering the energy level of the population. The followings are the target of MOPH’s policies: • To improve the organization structure, culture and the operation procedure in order to have good administrative system and to become a learning organization of public health • To develop and provide mechanism in facilitating the involvement of all concerned parties in monitoring the public health system as a whole. • To increase the capability of the medicines, public health and biology of health, in order to be on the front line of world competition • The middle-term goals of the MOPH’s services are following: • The important public health problems in different age groups of the population are to be lowered. • The people have health security with standard and quality health services, and to encourage people to take part in taking care of health and the public health environment. • The healthcare products and services are to be of the quality and up to the standard of international requirement. • To have good governance in the public health administration 215
- 15. 6.2.2 National Health Development Plan 2002-2006 216
- 16. 6.2.3 Distribution of basic health institutes The figure 6.7 showed the distribution of health instruction in Khok Charoen District. Figure 6.7: Location of public health station Facilities and Services The average distance to avail health facilities are 09 kilometers in Khok Charoen district (figure 6.7) and it is not convenient to most of the population to avail these facilities on foot and they have to use some transportation to access the health facilities. According to table 6.14, people of Nong Makha Tambon have to travel the most to avail the health facilities in term of distance cover Table 6.14: Accessibility of public health stations/hospital P u bl i c h e a l th s ta ti o n (m i n u te s ) N a m e o f T a m bo n D i s ta n c e (k m ) B y fo o t B y B ik e (5 0 (4 k m / h r) k m / h r) K h o k C h a ro e n 6 90 7 .2 Yang Rak 10 150 12 Non g M akh a 11 165 1 3 .2 W a n g Th o n g 12 180 1 4 .4 Khok S am ae San 6 90 7 .2 Source: Infrastructure Group, RRDP, 2008 217
- 17. 6.2.4 Existing Health facilities To achieve the healthy family goal , the good infrastructure are available in Khok Charoen district mentioned in table 6.15 and cleared in figured 6.8, one health station is serving 3505 number of population and the district hospital serving the whole district. The only concern in has been shown by the public regarding the distribution of these health institutes with respect to pupation density as Yang Rak Tambon having the largest population but it has a only one health station and limited medical staff i.e. one nurse Table 6.15: Distribution of health facilities with respect population Tambon Population Hospital Health Population Station per unit Khok Charoen 7519 1 0 1:24459 Khok Samae San 3504 0 1 1:3505 Nong Makha 3176 0 1 1:3137 Wang Tong 2590 0 1 1:2590 Yang Rak 7670 0 2 1:3835 24459 1 5 1:3505 Source: District health office, Khok Charoen district,2008 Figure 6.8: Distribution of health facilities Ditribution of Health Institues 30000 24459 Population 25000 20000 15000 7670 10000 3504 3176 2590 5000 0 Makha Samae Charoen Wang Yang Tong Nong Rak Khok San Khok Tam bon Source: District health office, Khok Charoen district,2008 6.2.5 Health personnel Stength of health personnel staff directly affect the overall health setup and health condition of the area. Khok Charoen district is located in remote locality and the administration had faced problem to hiring qualified staff for the district and primary health stations. From table 6.16 it is 218
- 18. cleared that the patient to doctor ration is quite high and at least there is an urgent need of one doctor in Khok Charoen district . Table 6.16: Detail of health personnel Tambon Population Hospital/ Doctor Nurse Doctor Nurses Health 1:6000+ 1:1000 Station * Khok Charoen 7519 1*** 3** 24 1:3760 1:358 Khok Samae San 3504 1 0 1 - 1:3504 Nong Makha 3176 1 0 1 - 1:3176 Wang Tong 2590 1 0 1 - 1:2590 Yang Rak 7670 1 0 1 - 1:7670 Total 24459 2 28 1:12230 1:873 Source: District health office, Khok Charoen district,2008 The figure 6.9 depicts that number of nurses are also less as compare to the standard ratio set by the government. Only Khok Charoen district hospital and sufficient poll of nurses but the only one nurse is taking care of one public health station as cleared from the figure 6.9. It is worthy to note that only one nurse is serving the whole Tambon having population of 7670 people. Figure 6.9: Distribution of nurses in the district Nurse to population ratio Actual Ratio Standard Ratio 10000 9000 7670 8000 7000 Population 6000 5000 3504 4000 3176 2590 3000 2000 1019 1000 1000 1000 1000 1000 1000 0 Khok Charoen Khok Samae San Nong Makha Wang Tong Yang Rak Tambon Source: District health office, Khok Charoen district,2008 +according to the standard of the 9th National Development Plan of Economy and Society) *According to the standard of the United Nation 219
- 19. ** Doctor(02) & Dentist(01) working in District Hospital only ***District Hospital, Khok Charoen 6.2.6 Existing Health Services Here is the list of main types of health facilities/treatments provided by public health station and Khok Charoen district hospital to the pollution. The level of treat is just preventive and the health institutes lack equipment and human recourse facilities to treat serious illness/disease. Health Station Treatment District Hospital P General Illness treatment P P Pregnancy P Dentist P P Childcare P P Common diseases like fever P Breathing Affection P P Diabetes P P Family Planning P Breathing system P Hypertension (High blood pressure) P Operation facilities P Source: District health office, Khok Charoen district,2008 6.2.7 Major Diseases The population of district is enjoying good health and no serious disease is among the top five diseases in the district as shown in table 6.17. It is evident from the table 6.17 that Obstructive Pulmonary disease (23%) and Digestive (29%) are the two major in-patent and out-patient diseases in the district The HIV situation in the district is satisfactory and only 21 patients have been tested positively out of 24459 having HIV Ratio: 1 to 1165 people 220
- 20. Table 6.17: Details of major disease in the district N In-patient Out-patient o. Disease type Occurrenc Disease type Occurrence e 1 Obstructive Pulmonary 123 Digestive 12333 disease 2 Awte respiratory Infection 123 Respiratory 11585 3 Hyper tension 117 Blood pressure 7214 4 Diarrhoea 117 Skin infection 6658 5 Pregnancy complication 65 Endocrine 5946 Source: District health office, Khok Charoen district,2008 Unhygienic food, Alcohol / Tobacco, Tensions/stress ,High cholesterol level , Irregular eating habits of the community are reported as the main causes of the above mentioned major diseases in the district. 6.2.8 Household Sanitation The Overall situation of household environment is good and there exists proper solid waste management system and both community and the local administration worked together to keep the area clean from the figure 6.10 that all the five tambons have achieved there targets set in BMN except the nuisance which is one common problem in the district Residence Environment ) 101 l i 100 99 .9 99.9 99.999.9100 99.9 100 99.7100 100 99.8 99.899.899.8 99.499.6 a 100 99.4 99 99.4 99.1 F 99 r 98 o s 97 s 96 95 95 95 a 95 P ( 94 s 93 u t 92 a t S Target Khok Yang Rak Nang MakhaWang Thong Khok Samae Charoen San Tambon indic.15 indic.16 in dic.17 in dic.18 Figure 6.10: Resident environment 221
- 21. 6.2.9 Health and Hygiene Condition The overall situation of Public Figure 6.11:health and Hygiene conditions Health and Sanitation at work, Contagious Disease Control and Drug Addicted is 78.3% Progressive, 13.0% Moderate and 8.7% Backward and all the household have flush toilets in the houses. Source: BMN 2007 Source: NRD 2C , 2007 6.2.10 Health Volunteer The Thailand government started the idea of introducing health volunteers in rural area in 1970. In every village, there has at least one Health Volunteer; one Health Volunteer is responsible for 5 to 10 households in each village. These Health Volunteers are not only worked with rural health stations but also work with local organization like Tao about diseases prevention. Presently, there 342 health volunteers are working in Khok Charoen district and their Tambon wise distribution has been elaborated below; Figure 6.12: Distribution of health volunteers in four tambons Tambon Health Volunteers(HV) 100 150 80 79 V 60 100 H f 49 o 40 35 . 50 50 32 50 50 50 o N 20 0 0 Khok Samae Nong Makha Wang Tong Yang Rak San Tambon Actual Population per HV Average Popluation per HV Source: District Health Officer, Khok Charoen, 2008 222
- 22. It is cleared from the figure 6.12 that the Health Volunteers are equally distributed in each Tambon with respect to population Responsibilities of Health Volunteer Following are the main responsibilities associated with Health Volunteers; • To inform new/information for villagers such as demonstrate a good role model in self-care and distribute documents and suggestion to the villagers • Health Leadership in community • Health service in the village • Common diseases like fever, headache etc prevention and control in the community • To Survey and collect data for example BMN survey, Survey and collect sanitation and environment data and send it to the health worker Selection Criteria There is no hard and fast rule to select a health volunteers, following are the key factors while appointing an individual as a health volunteer. • He/She must have strong passion to serve the community voluntarily • He/She must have comparatively knowledgeable and concern about the health matter. • He/She should not be less than 20 year of age Training and Incentives The Health Volunteers are provided three day training every year by district Health office and health station staff and they usually met after three months to discuss the problems they are facing. The Health Volunteers work on voluntarily bases but firstly, they get free medical facilities for their family and secondly, they gain knowledge through trainings Some of the strength and weakness are hereby highlight that were observed during the filed survey and interview with health volunteers and health staff and general public regarding the health volunteers and there working. Strengths Weakness • Good to follow up the patients in the • No incentive that may lead to lack of community motivation • Health Volunteer knows the community • No fix criteria for selection better than the health officers • They usually work as part time. • People have easy access to them • Low educational background • Trained • De-motivation • Involvement in planning, implementation • Lack of team work and monitoring of various health schemes 223
- 23. 6.2.11 Conclusions/Recommendations Health Volunteers have played a very vital role in the provision of basic health facilities to the community especially in remote rural areas in the past. But now, many rural health volunteers say they don’t have the time, resources or training to carry out their duties and the complaints are increasing. Despite this government continues to assign them more work on disease inspection without any reward that is de-motivating them as if government uses any other source to carry out these task, it will pay to concern service provision organization. Therefore, it is suggested that for motivating and to enhance Health Volunteers capacities government should introduce some incentive for them along with more planned comprehensive training courses 6.2.12 Case studies Public Health Station - Tambon Yang Rak Health Station is located in village number 12 Majority of this community receive health service or treatment from health station. the health station providing health facilities free of cost as per new health policy of the government. In this health station there are twelve village health volunteer works with them. These Health Volunteers would coordinate the villagers in each village to promote health facilities in the area. Roles and Responsibilities Brief descriptions of major responsibilities of Yang Rak health station are; • Provide basic health care services and provide technical support for diagnosis • Follow-up with, and give suggestions to patients, • Give Vaccine-preventable disease for student in school. • Cooperate with community leaders and Health volunteers for promoting health activities • Provide information or health knowledge for people such as suggestion on physical and mental health for elderly person, • Provide knowledge on family planning and childcare Health Personnel There are five personnel worker at Yang Rak Public health station consisting of the head of the office, one professional nurse, health academic staff, dental officer and health officer. Working schedule of health personnel at Yang Rak Public Health Station is as follow, 224
- 24. Day Service Special service Monday General Illnesses, Dental service Hypertension Check Tuesday General Illnesses Dental service Diabetes clinic, pregnancy Wednesday General Illnesses Dental service Give Vaccine for children Thursday General Illnesses Dental service Friday General Illnesses Dental service Saturday - Sunday General Illnesses Source: Public Health station, Yang Rak Working procedure The health station staff has maintained separate file for every habitant of the yang Rak Tambon containing information about one’s medical treatment history. The staff updates the file as soon as the concern individual avail medical treatment by showing his/her health card. According to the health officer, Yang Rak health station, they usually provide treatment to 40 to 50 patients and they are mostly the sugarcane farmers or belong to cattle farming groups who usually got small injuries while working. Budget and support In general, the ministry of public health controls and supports all public health station through province and district governments. The district health officer looks after the functionalities of the health stations and Tambon Administrative Organization also provide financial support to health stations to purchase medical equipment and to launch health promotion activities in the village like spraying against mosquitoes. Problem and constraint According to health station officer, the health station is facing following problems • Lack of medical staff to take care patients as health is free to all, so not only residents of Yang Rak Tambon avail the medical treatment from the health station but the residents of other nearby villager also get medical service from here due to easy accessibility • Lack of equipment like X-rays and and sometimes delay in receiving the medicines from district authorities. • Lack of health facilities and staff that is why people have to wait for long time and some time they become irritate and don’t behave well with the staff Note: There are having activities to visit patient in the villages but depend on their time and situation Monday-Friday open 8.00-17.00 Saturday-Sunday open 8.30-12.3 225
- 25. 6.2.12 District hospital, Khok Charoen – A case study Khok Charoen hospital is the only hospital exits in the district that is providing health facilities the public. The hospital has 10 beds and 2 doctors, one dentist and 25 professional nurses and 34 other staff. The hospital is equipped with one ambulance and has two pickups for emergency use. Vision To promote health facilities for all to “To have healthy families across the district” Health Strategies The hospital has set following strategies to achieve the goal, • To develop public health management system • To develop health IT system • To develop administrative setup for good governance • To improve quality of service Figure 6.13: Organization Structure Khok Charoen Hospital DHO Budget Strategies Service Quality PCU-Hospital PCU – Yang Rak Hospital PCU-Samae San PCU-Nong Makha PCU-Wang 226
- 26. Type of treatment The hospital provide following types of medical treatment • General Illness treatment • Pregnancy • Dentist • Childcare • Common diseases like fever • Breathing Affection • Diabetes Family Planning • Breathing system • Hypertension (High blood pressure) • Operation facilities Details of Health personnel Doctors Dentist Pharmacist Nurses X-Ray Paramedical Technician Administrative officer staff Staff 2 1 1 25 1 18 4 16 Source: district health officer, 2008 Treatment profile (2006-07) Following is the progressive profile of Khok Charoen district hospital for the year 2009-6-07 and it showed quite satisfactory results • No. of out-patient treated 9,918 person • Patients total frequency 46,750 times • No. of Beds 10 • No. of in-Patient treated 1,201 person • No. of days, the patient remained in hospital 3,077 days Budgets and expenditures The hospital is funded by two main sources • by Ministry of health and hospital received 8 million Bhat per year from the ministry for its operation • by Tambon Administration Organizations and it received six million Bhat per year against the services the hospital provide to there residents. Major portion of the hospital budget 64% is consumed on IPD and OPD departments and 25% goes to salaries and remaining on development works. The hospital also invests 2% of its budget amount in bank as an endowment. 227
- 27. Health Schemes The District Health Office in collaboration with district hospital imitated time to time health scheme to promoter health awareness among the public and health schemes for disease prevention in the district shown in the figure 6.14 below. Figure 6.14: Details of health awareness schemes Health Awarance Scheme program/scheme 25 20 Number of 20 15 13 12 12 10 9 10 8 6 4 5 0 0 Khok Khok Samae Nong Makha Wang Tong Yang Rak Charoen San Tambon Disease Prevention Health Promotion Scheme Source: District health office, Khok Charoen district,2008 Problems Following are the few problems identified during the survey and interview with different stakeholders • Shortage of number of Beds as ten beds are not sufficient for whole population • Shortage of doctors • Monitoring system need improvement • Lack of sufficient budget for various health schemes • Health card scheme 6.2.13 People’s Feedback Following the peoples’ feedback regarding the overall health facilities in the district • Show satisfaction on the role of health volunteers. • Health facilities were not easily accessibility especially for elderly people • Due to lack of staff people have to wait for long time to get treatment in district hospital and health stations. • Lack of medical equipment at health station level • People showed their concerns over the monitoring and checking of eatables 228
- 28. 6.2.14 Problems Following are the list of problems identified after the overall analysis of the primary and secondary data analysis. • Shortage of health staffs especially a doctor. • Lack of medical equipment at health station level • Residence are suffering from nuisance pollution in all the five Tambon • Digestive diseases are major disease in the district 6.2.15 Potential Following the list of the potentials exists in the area with respect to health and sanitation; • District is drug addict free • Very low percentage of HIV infected persons • Overall situation of Health & Sanitation is satisfactory • Presence of basic Health infrastructure in the district • Free health facilities for all 6.3. Education Education System in Thailand There are three types of education in Thailand: formal, non-formal and informal education. Formal education can be divided into two patterns: basic education and higher education. The figure 6.15 presents the current formal school system in Thailand. Non-formal education is much more flexibility in response with its aims, duration, assessment and management procedures according to learners’ needs. Informal education aims at enable people’s self-learning from persons, society, environment, media, and other sources of knowledge, for example, museums and public libraries. 6.3.1 Current Education Policies Current educational policies concentrate on raising the quality of education in both primary and higher education, and in both formal and informal education systems. There are two main strategic goals with policy instruments (Education in Thailand 2005/2006) below: 1. Human development with a focus on knowledge, happiness, health, a loving family, a pleasant environment, and a peaceful and caring society; and 2. Movement toward a knowledge-based society by placing people at the centre of learning and focusing on human worth, potential, competitiveness, morality and ethics. 229
- 29. • Policies on the Pre-primary Education; There are three areas will be supported by government policy: - providing learning that stimulates various aspects of development; - formulating principles and standards for educational provision and necessary mechanisms for close monitoring and effective support; - strengthening the role of the family, and providing relevant knowledge to parents and child guardians. • Policies on the reform of the Basic Education Curriculum and the Teaching-Learning Process For the purpose of learner development, the education reform focus on the basic education curriculum and teaching-learning process including: - greater effectiveness and efficiency in the development of curriculum, textbooks, educational media, assessment, and evaluation of educational achievement; - improvement of language teaching and learning, with an emphasis on Thai, English, and Chinese languages, and stressing communication skills in real life situations, careers, and further education; - improvement in the teaching and learning of mathematics and science, as well as computer science, to ensure a sound basis in science and technology and systematic support for talented learners; - improvement in the quality of teaching and learning in small schools; • Policies on the Reform of Vocational Education Reform of vocational education aims at ensuring the development of manpower with the necessary skills required for employment and/or entrepreneurship, as well to meet the demands for higher competencies increasingly required by industry. - Organization of a support system to improve the capacity of all vocational education institutions to provide a good education, and creation of a desirable image and concrete contribution to the society; - Clarification of the roles and responsibilities of different categories of vocational education institutions; introduction and expansion of courses in areas consistent with the needs of the labor market and national development; improvement of the curriculum, along with teaching and learning methodology; and development of assessment and evaluation methods to measure learner achievements; - Improvement of professional standards and the professional qualification system, as well as development of vocational education standards and competency-based courses in collaboration with various enterprises; • Policies on the Reform of Non-Formal and Informal Education to Support Lifelong Learning 230
- 30. Non-formal and informal education systems will promote and support lifelong learning activities to develop a culture of lifelong learning and the creation of a learning society based on active participation from all segments of society, through: - awareness campaigns to stress the importance of lifelong learning, and surveys to identify interests and needs; - curriculum improvement and development; - organization of different courses through a variety of methods, with emphasis on networking and cooperation; - collaboration with public and private sector agencies to establish a system for the transfer of learning outcomes and experiences; - establishment of a free television channel for education and improvement of programming throughout the media. 231
- 31. Figure 6.15: Organization of the Present School System in Thailand Sources: Office of Education Council, Education in Thailand 2005/2006, Bangkok: Amarin Printing and Publishing, 2006. 232
- 32. 6.3.2 Formal Education Formal education consists of basic education and higher education. Within basic education, it covers 12 years before higher education including 9 years’ compulsory education. The nine years of compulsory education requires children aged seven to enroll in basic education institutions until the age of 16. The focus of formal education in this report is on the basic education. Organizational Structure As can be seen from Figure 6.16, the Ministry of Education consists of National Council of Education, Commission of Basic Education, Commission of Higher Education and Commission of Vocational Education. Its main responsibility is to promote and oversee all levels and types of education. Lop Buri Educational Service Area Office 2 is a main organization for arranging, promoting, and supporting the foundational education and distributing authority to all educational establishments to administrate the studying ages thoroughly. It is also to bring the moral principle knowledge according to the loyal sufficient economy philosophy and to meet the quality standard. There are four objectives in Lop Buri Educational Service Area Office 2: - All studying ages included disability and less opportunity people receive opportunities to study basic education for 12 years as equivalent and entire right. - All learners receive education that meet the quality standard of foundation education. - Lop Buri educational service area office 2 and other subordinate educational establishments have strong points in education administration. - Coordinate promotion to encourage spirit to personnel and learner in particular extraordinary development area in the southern border provinces. 233
- 33. Figure 6.16: Education Administration and Management Structure Responsibilities: - Formulation of policies, plans, standards; Ministry of Ministry of Ministry - Support of resources; Education Interior providing - Monitoring and specialized evaluation education Responsibilities: - Supervision, support, Educational Local administration Public units and promotion in service areas organization providing response to policies and education standards Responsibilities: Institutions Agencies Education Agencies, and - Implementation / providing basic organizations institutions institutions administration and and early / individuals / schools /schools management childhood responsible providing education like for education specialized kindergartens provision education Sources: Adaptation from Office of Education Council, Education in Thailand 2005/2006, Bangkok: Amarin Printing and Publishing, 2006. 6.3.3 Infrastructures In Khok Charoen district, there are 14 pre-primary care centers/schools are adjunctive to 14 primary schools. Of six lower secondary schools, four schools cover primary schools(Ban Nong Maka, Ban Wang Ta In, Ban Sa Paeng and Ban Khok Same San), in terms of grade 1 to grade 9. Two schools belong to upper secondary schools (Khok Charoen wittaya school and Yang Rak wittaya school) with cover of grade 7 to grade 12. The total 191 classrooms are available for 607 pre-primary school children, 1864 primary students, 941 students in lower secondary school and 326 students in upper secondary schools. There are 16 school libraries in Khok Charoen district. 234
- 34. All schools in Khok Charoen district are public schools, there lack of private school and vocational school. Table 6.18: Distribution of Education Institutions by Tambons Pre-school / Lower Upper Primary Tambon child care- secondary secondary Total % school center school school 1 3 (combined Khok (2 schools combined 3 with lower 10 27% Charoen with Lower secondary secondary school ) school) 1 Yang Rak 4 4 (combined with lower 11 30% secondary school) 4 Nong 4 (1 school combined with - 9 24% Makha Lower secondary school ) Whang 2 2 - - 4 11% Thong 1 Khok 1 (combined with Lower - 3 8% Samae San secondary school ) Total 14 14 6 2 37 100% Source: Adopted from Lop Buri Educational Service Area Office 2, 2008 6.3.4 School Facilities Of total 177 classrooms in Khok Chareon district, 34 classrooms in pre-primary schools or care- centers, 98 classrooms in primary schools, 33 classroom in lower secondary schools and 12 classrooms in upper secondary schools. Each school owns a library, in terms of 16 libraries in this education service area. The students-classroom ratios are 1:18, 1:19, 1:29 and 1:27 relevant with pre-primary schools, primary schools, lower secondary schools and upper secondary schools respectively. The highest ratio is 1:29 at lower secondary school level. Table 6.19: Ratio of Student-classroom Khok Chareon District National Standard Ratio % of % of students per Types of school Classrooms Students Ratio Classrooms Students classroom Pre-primary School 34 607 1:18 19% 16% 1:25 235
- 35. Primary School 98 1864 1:19 55% 50% Lower Secondary School 33 941 1:29 19% 25% Upper Secondary School 12 326 1:27 7% 9% Total 177 3,738 1:21 100% 100% Source: Adopted from Lop Buri Educational Service Area Office 2, 2008 The Figure 6.17 and Figure 6.18 present that 16% of children in pre-primary schools own 19% of classrooms. At primary school level, 50% of students share 55% of classrooms. At lower secondary school level, 25% of students own 19% of classrooms and at upper secondary school, 9% of students share 7% of classrooms. Figure 6.17: Percentage of Classrooms by Education Level % of cl assr oom by school l evel s 7% 19% 19% Pr e- pr i m y School ar Pr i m y School ar Low Secondar y School er Upper Secondar y School 55% Figure 6.18: Percentage of Students by Education Level As can been seen from table 6.20,6.21 % of st udent s by school l evel and 6.22 that the ratios of students- classroom distribute by school are 9% 16% imbalance. The lowest ratio is 1:7 in the Pr e- pr i m y School ar 25% primary school Ban Din Daeng and the Pr i m y School ar Low Secondar y School er highest ratio is 1:30 in the upper Upper Secondar y School 50% secondary school, Khok Charoen wittaya. However, the total ratio of students-classroom (1:21) is lower than government standard 1: 25. 236
- 36. Table 6.20: Ratio of Students-classroom in Pre-primary Education Khok Chareon District National Pre-primary School Standard ratio No. of students per No. Name of School Boys Girls Total classroom Ratio classroom 1 Ban Yang Rak school 37 38 75 4 1:19 2 Ban Nong Maka 25 21 46 2 1:23 3 Ban Wang Ta In 34 26 60 2 1:30 4 Ban Sa Paeng 28 19 47 2 1:24 5 Ban Lam Chon Dan 13 10 23 2 1:12 6 Ban Khao Rab 9 20 29 2 1:15 7 Anu bann Khok Charoen 55 45 100 4 1:25 8 Ban Ta Le Tong 13 13 26 2 1:13 9 Ban Haey Saram 22 18 40 2 1:20 1:25 10 Ban Din Daeng 12 3 15 2 1:8 11 Ban Ram Pong Paed 11 10 21 2 1:11 12 Ban Bor Ta Kaen Tong 8 2 10 2 1:5 13 Ban Pu Ka Chad 18 15 33 2 1:17 14 Ban Khok Same San 39 43 82 4 1:21 Total 324 283 607 34 1:18 Source: Lop Buri Educational Service Area Office 2, 2008 Table 6.21: Ratio of Student-classroom in Primary School, Khok Chareon District National Primary School Standard ratio No. of students per No. Name of School Boys Girls Total classroom Ratio classroom 1 Ban Yang Rak school 120 103 223 9 1:25 1:25 2 Ban Nong Maka 84 74 158 6 1:26 3 Ban Wang Ta In 93 84 177 6 1:30 237
- 37. 4 Ban Sa Paeng 94 67 161 6 1:27 5 Ban Lam Chon Dan 31 33 64 6 1:11 6 Ban Khao Rab 49 53 102 6 1:17 7 Anu bann Khok Charoen 165 138 303 12 1:25 8 Ban Ta Le Tong 36 44 80 6 1:13 9 Ban Haey Saram 51 64 115 6 1:19 10 Ban Din Daeng 24 20 44 6 1:7 11 Ban Ram Pong Paed 23 22 45 6 1:8 12 Ban Bor Ta Kaen Tong 22 23 45 6 1:8 13 Ban Pu Ka Chad 48 49 97 6 1:16 14 Ban Khok Same San 132 118 250 11 1:23 Total 972 892 1864 98 1:19 Source: Lop Buri Educational Service Area Office 2, 2008 The table 6.22 has been suggested that the total ratio of students-classroom (1:29) in lower secondary education is higher than national standard (1:25). Table 6.22: Ratio of Students-classroom in Lower Secondary Education, Khok Chareon District Lower Secondary School No. of National No. Name of School Boys Girls Total classroom Ratio Standard 2 Ban Nong Maka 41 39 80 3 1:27 3 Ban Wang Ta In 36 30 66 3 1:22 4 Ban Sa Paeng 34 40 74 3 1:25 14 Ban Khok Same San 47 55 102 5 1:20 1:25 Khok Charoen wittaya 15 school 217 228 445 13 1:34 16 Yang Rak wittaya school 85 89 174 6 1:29 Total 460 481 941 33 1:29 Source: Lop Buri Educational Service Area Office 2, 2008 238
- 38. The table 6.23 also present that the ratio of students-classroom (1: 27) in upper secondary schools is higher than government standard (1:25). Table 6.23: Ratio of Students-classroom in Upper Secondary Education, Khok Chareon District Upper Secondary No. of National No. Name of School Boys Girls Total classroom Ratio Standard Khok Charoen wittaya 15 school 73 134 207 6 1:35 1:25 16 Yang Rak wittaya school 60 59 119 6 1:20 Total 133 193 326 12 1:27 Source: Lop Buri Educational Service Area Office 2, 2008 6.3.5 Education Personnel There are 192 teachers distribute in 16 schools including 16 pre-primary care centers in Khok Chareon district in academic year 2008. As can be seen from table 6.24, there are 17 teachers attained at master’s degree or higher, and most of teachers are qualified at bachelor’s degree; only two teachers’ degree is lower than required diploma. Table 6.24: Number of Teachers by Qualification in Khok Chorean District, Academic Year 2006 Level of Qualification Male % Female % Total % Master's Degree or Higher 8 4% 9 5% 17 9% Bachelor's Degree 44 24% 120 66% 164 90% Diploma in Education or - 0% - 0% - 0% Equivalent Low than Diploma 1 1% 1 1% 2 1% Total 53 29% 130 71% 183 100% Source: Lop Buri Educational Service Area Office 2, 2006 As table 6.24 presented, of total 183 teachers in academic year 2006, 79% of teachers were female and most of female teachers were working in pre-primary schools and primary schools 239
- 39. Number of Students and Teachers The table 6.25 show that 2793 pupils study in both pre-primary and primary schools. Of 2793 students, 1454 boys are larger than 1339 girls in primary education. Comparing with the national standard of ratio of students-teacher (1:25), the average ratio of students-teacher is 1:18 in both pre-primary and primary schools. The lowest ratio of students-teacher is 1:6 in Ban Bor Ta Kaen Tong primary school and the highest ratio of students-teacher is 1:31 in Ban Haey Saram primary school. Table 6.25: Students-teacher Ratio by School Pre-primary and primary school No. of National No. Name of School Boys Girls Total teachers Ratio Standard Ban Yang Rak 1 school 157 141 298 13 1:23 2 Ban Nong Maka 150 134 284 15 1:19 3 Ban Wang Ta In 163 140 303 17 1:18 4 Ban Sa Paeng 156 126 282 15 1:19 5 Ban Lam Chon Dan 44 43 87 4 1:22 6 Ban Khao Rab 58 73 131 7 1:19 Anu bann Khok 7 Charoen 220 183 403 22 1:18 1:25 8 Ban Ta Le Tong 49 57 106 8 1:13 9 Ban Haey Saram 73 82 155 5 1:31 10 Ban Din Daeng 36 23 59 5 1:12 11 Ban Ram Pong Paed 34 32 66 4 1:17 Ban Bor Ta Kaen 12 Tong 30 25 55 9 1:6 13 Ban Pu Ka Chad 66 64 130 8 1:16 14 Ban Khok Same San 218 216 434 19 1:23 Total 1454 1339 2793 151 1:18 Source: Lop Buri Educational Service Area Office 2, 2008 The table 6.26 indicates that, of total 945 students in secondary schools, there are 435 boys and 510 girls studying in khok Charoen wittaya and Yang Rak Vittya secondary schools respectively. The ratio of students-teacher is 1:23 that is less than the ratio 1:25 of national standard. 240
- 40. Table 6.26: Students-teacher Ratio by Lower Secondary and Upper Secondary School Lower secondary and upper secondary school No. of National No. Name of School Boys Girls Total teachers Ratio Standard Khok Charoen 28 15 wittaya 290 362 652 1:23 1:25 16 Yang Rak Vittya 145 148 293 13 1:23 Total 435 510 945 41 1:23 Source: Lop Buri Educational Service Area Office 2, 2008 The rate of dropout as table 6.27 presented that 16 students who dropped out accounting for 0.43%. The dropout rate (0.95%) at level of secondary school is bit of larger than level of primary school (0.25%). The school with the highest dropout rate is Ban Nong Maka at 1.76%. The main reason of dropout is that households migrate out to make lives because parents don’t have a stable occupation. Table 6.27: Percentage of Dropout by Schools Serial No. of No. of No. of % of No. Name of school boys girls Total dropout dropout 1 Ban Yang Rak school 157 141 298 0 0.00% 2 Ban Nong Maka 150 134 284 5 0.13% 3 Ban Wang Ta In 163 140 303 0 0.00% 4 Ban Sa Paeng 156 126 282 1 0.03% 5 Ban Lam Chon Dan 44 43 87 0 0.00% 6 Ban Khao Rab 58 73 131 0 0.00% Anu bann Khok 7 Charoen 220 183 403 0 0.00% 8 Ban Ta Le Tong 49 57 106 0 0.00% 9 Ban Haey Saram 73 82 155 0 0.00% 10 Ban Din Daeng 36 23 59 1 0.03% 11 Ban Ram Pong Paed 34 32 66 0 0.00% Ban Bor Ta Kaen 12 Tong 30 25 55 0 0.00% 13 Ban Pu Ka Chad 66 64 130 0 0.00% 14 Ban Khok Same San 218 216 434 0 0.00% Sub-total 1454 1339 2793 7 0.19% 241
- 41. Khok Charoen 15 wittaya school 290 362 652 9 0.24% Yang Rak wittaya 16 school 145 148 293 0 0.00% Sub-total 435 510 945 9 0.24% Total 1889 1849 3738 16 0.43% Source: Lop Buri Educational Service Area Office 2, 2008 Schools’ Distribution Mapping As map 6.1 presented, all the 16 schools locate by the roads. The most of time of distance to a particular school by foot is 45 minutes in Nong Makha. The most school distance by average is 2.25 km in tambon Nong Makha and the least school distance by average is 1.2 km in tambon Yang Rak. On the scale of spatial level, children can go to schools conveniently according school schools’ distribution mapping. 242
- 42. Map 61: School Distribution in Khok Charoen District 243
- 43. Table 6.28: Time of Distance to a Particular School Service by Foot and by Bike School distance School distance by minutes by km By Bike Name of Tambon By foot (4km/hr) (50 km/hr) By average km Khok Charoen 37.5 3 1.5 Yang Rak 30 2.4 1.2 Nong Makha 45 3.6 2.25 Wang Thong 30 2.4 2 Khok Samae San 37.5 3 1.5 Source: Infrastructure sector report, 2008 According NRD-2C, as the Figure 6.19 presented that most of Tambons achieved progressive education level in 2007. This indicator denotes that 100% of 6-15 years old children are in compulsory schools, 100% of 3-5 years old children are in pre-primary school, and greater than 50% of villagers who missed compulsory school or standard education and received non-formal education training. Figure 6.19: Percentage of Villages Achieved Progressive Education Level by Tambons % of vi l l ages achi eve pr ogr essi ve educat i on l evel 120% 100% 100% 92% 88% 83% Per cent age 78% 80% 60% 系 列 1 40% 20% 0% Khok Yang Rak Nong Makha Wang Thong Khok Samae C oen har San Tambon Sources: NRD-2C, 2007 6.3.6 Curriculum In 1999, the Department of Curriculum and Instruction Development (DCID) conducted a national quality assessment of education at the upper secondary level (Grade 12). Afterward, the quality assessment has showed that many schools still needed to improve teaching and learning in accordance with the 70% of core curriculum and the needs of learners and 30% of localities or institutions. About half of the teachers needed to improve their abilities to facilitate aspects of student-centered learning, and to search for knowledge, think analytically, conduct research, and create a body of knowledge. (ONEC, 2001b, pp.55-57). According to MOE report that there about 90% of students showed satisfactory results in Thai writing, many of them needed to improve their skills in chemistry, mathematics and English writing at 64%, 65% and 86%, respectively. (Ministry of Education, 1999, p.23). We interviewed an English teacher who teaches English for three schools every week; because these schools lack of enough English teacher. He has to teach English at Anu Bann 244
- 44. Khok Charoen school for 3 days, at Ban Ta Le Tong school for 1 day, and at Ban Din Daeng school for 1 day. Table 6.29: Schedule of English Teacher of Anu Bann Khok Charoen School Name of schools Working days per week Anu bann Khok Charoen 3 Ban Ta Le Tong 1 Ban Din Daeng 1 Source: Social group interview As interview presented, it’s difficult for students to study English because of limitation of teaching hours. Bangon Khanket is teaching English in three schools with grade 1 to grade 6. With regard to grade 1 to grade 3, there is one hour English class per week respectively; for grade 4 to grade 6, there are two hours per week per school. Therefore, lack of teaching and learning hours limited children interest in English learning. He believe that the quality of English learning could be improved if the number of learning hours increased from 1 hours to 3 hours; however, English teacher cannot stand such intensive workload. Activities of the Schools Most schools try to do institutional developed curriculum in the proportion of 30% according to the Committee on Academic Quality Development. As table 29 presented that the Yang Rak Wittaya school make effort to connect indigenous knowledge with school curriculum. They encourage students to join community activities and to learn from life. Overall Assessment of School Quality According to the National Education Act of B.E. 2542 (1999), there is a system of educational quality assurance including both internal and external quality assurance. All educational institutions have to receive external quality evaluation at least once every five years. Educational standards for external quality assessment of basic education institutions (Council of Ministers, January 2000) composed of 14 standards and 53 indicators that can be classified into 3 groups as follows: 1) Standards of Learners, consisting of 7 standards with 22 indicators, aim at physical, spiritual, intellectual and social development; 2) Standards of Process, consisting of 3 standards with 21 indicators, focus on administrative and teaching-learning processes; and 3) Standards of Inputs specify the characteristics or readiness of administrators, teachers and 245
- 45. the curriculum. They are composed of 4 standards, with 10 indicators. As we can see from the table 6.30, there are gaps in comparing academic achievements by schools, inequality existed in all subjects. The highest average score is 2.79 that achieved by the school Anu bann Khok Charoen. The lowest score is in school Ban Bor Ta Kaen Tong at1.79. The lowest scores distributed in subjects of English, Mathematics, Chemistry and Physics. There are 25% of schools reached at progressive level, 75% of schools still need to be improved. Of six schools with lower secondary and upper secondary grades, only school Ban Khok Same San achieved level of good standard. Therefore, we can find that the quality of 83% of lower and upper secondary schools need to be improved which affect on the rate of continuation education to higher education. Table 6.30 : School Assessment by External Education in Khok Charoen District No. Name of School Average Score Evaluation 1 Ban Yang Rak school 2.71 Progressive 2 Ban Nong Maka 2.43 Need to be improved 3 Ban Wang Ta In 2.29 Need to be improved 4 Ban Sa Paeng 2.36 Need to be improved 5 Ban Lam Chon Dan 2.57 Need to be improved 6 Ban Khao Rab 2.5 Need to be improved 7 Anu bann Khok Charoen 2.79 Progressive 8 Ban Ta Le Tong 2.43 Need to be improved 9 Ban Haey Saram 2.43 Need to be improved 10 Ban Din Daeng 2.14 Need to be improved 11 Ban Ram Pong Paed 2.36 Need to be improved 12 Ban Bor Ta Kaen Tong 1.79 Need to be improved 13 Ban Pu Ka Chad 2.57 Progressive 14 Ban Khok Same San 2.71 Progressive 15 Khok Charoen wittaya school 2.29 Need to be improved 16 Yang Rak wittaya school 2.79 Need to be improved Source: Lop Buri Educational Service Area Office 2, 2008 Students Completion and Continuation to Higher Education As can be seen from table 6.31 (NRD-2C), the numbers of children who complete compulsory education and enroll into high school are lower. 4 of 12 villages achieved at progressive level in Khok Chaaroen, the data from other villages are not available (NA). In Yang Rak, 2 of 12 villages reach at progressive level. Only one village arrived at progressive level within 12 villages in Nong Makha. Data are not available at this indictor in 9 villages, Wang Thong. It’s better in Khok Samae San than other tambons that 6 of 8 villages reach at progressive level and 1 village is at backward level. 246