

Recomendados
Más contenido relacionado
Similar a All ssm full_crosstabs_cb_oct_2013 (1)
Similar a All ssm full_crosstabs_cb_oct_2013 (1) (20)
Más de Honolulu Civil Beat
Más de Honolulu Civil Beat (20)
Último
Último (20)
All ssm full_crosstabs_cb_oct_2013 (1)
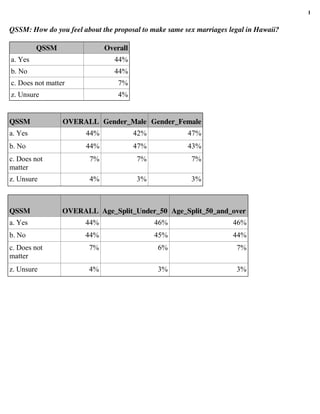
- 1. 1 QSSM: How do you feel about the proposal to make same sex marriages legal in Hawaii? QSSM Overall a. Yes 44% b. No 44% c. Does not matter 7% z. Unsure 4% QSSM OVERALL Gender_Male Gender_Female a. Yes 44% 42% 47% b. No 44% 47% 43% c. Does not matter 7% 7% 7% z. Unsure 4% 3% 3% QSSM OVERALL Age_Split_Under_50 Age_Split_50_and_over a. Yes 44% 46% 46% b. No 44% 45% 44% c. Does not matter 7% 6% 7% z. Unsure 4% 3% 3%
- 2. 2 Ethnicity_Ca Ethnicity_Japa Ethnicity_Fili Ethnicity_Hawa OVERALL ucasian nese pino iian QSSM a. Yes 44% 54% 49% 28% 34% b. No 44% 38% 42% 53% 56% c. Does not matter 7% 6% 7% 15% 7% z. Unsure 4% 2% 3% 5% 3% Ethnicity_Chi Ethnicity_Hispanic_ nese Latino Ethnicity_Other_ Mixed 32% 57% 34% 64% 35% 50% 4% 8% 10% 1% 0% 7% QSSM Politics_Liberal_p Politics_Mode Politics_Conserv Politics_Uns OVERALL rogressive rate ative ure a. Yes 44% 76% 45% 15% 29% b. No 44% 18% 43% 81% 48% c. Does not matter 7% 5% 10% 2% 13% z. Unsure 4% 2% 2% 1% 10%
- 3. 3 QSSM Party_De Party_Republi Party_Indepen Party_Uns OVERALL mocrat can dent ure a. Yes 44% 61% 11% 35% 19% b. No 44% 27% 84% 59% 50% c. Does not matter 7% 8% 3% 5% 10% z. Unsure 4% 3% 2% 1% 22% QSSM OVERALL PhoneType_ Both PhoneType_Cell PhoneType_Landline a. Yes 44% 46% 52% 35% b. No 44% 45% 43% 42% c. Does not matter 7% 6% 4% 11% z. Unsure 4% 2% 0% 11% QSSM Education_No Education_HS_Gra Education_College_Gr OVERALL _degree duate aduate a. Yes 44% 32% 29% 46% b. No 44% 45% 55% 45% c. Does not matter 7% 0% 12% 8% z. Unsure 4% 24% 3% 2% Education_SomeColl_Ass Education_Graduate_ oc_Voc Degree 44% 58% 47% 34% 5% 7% 4% 1%
- 4. 4 QSSM OVERALL Military_Yes Military_No a. Yes 44% 40% 53% b. No 44% 49% 38% c. Does not matter 7% 8% 5% z. Unsure 4% 2% 4% QSSM OVERALL Union_Yes Union_No a. Yes 44% 39% 49% b. No 44% 49% 42% c. Does not matter 7% 9% 6% z. Unsure 4% 3% 3% QSSM OVERALL Children_Yes Children_No Children_Refused a. Yes 44% 42% 52% 16% b. No 44% 50% 36% 77% c. Does not matter 7% 5% 9% 0% z. Unsure 4% 3% 3% 7%
- 5. 5 QSSM OVERALL Income_Less_than_ 50k Income_50_to_100k Income_Over_100k a. Yes 44% 44% 47% 48% b. No 44% 49% 44% 44% c. Does not matter 7% 6% 6% 7% z. Unsure 4% 1% 3% 1% QSSM OVERALL County_CD_Oahu_CD_ 01 County_CD_Oahu_CD_02 a. Yes 44% 43% 42% b. No 44% 46% 46% c. Does not matter 7% 7% 9% z. Unsure 4% 5% 3% County_CD_Hawaii County_CD_Maui County_CD_Kauai 49% 47% 51% 43% 44% 31% 6% 7% 11% 2% 2% 7%
- 6. 6 QFaith: How have religious beliefs affected your feelings about same sex marriage? Has religion been a major factor, a minor factor, or not a factor? QFaith Overall a. Major factor 26% b. Minor factor 19% c. Not a factor 50% z. Unsure QFaith 5% OVERALL Gender_Male Gender_Female a. Major factor 26% 26% 27% b. Minor factor 19% 19% 21% c. Not a factor 50% 53% 47% 5% 1% 5% z. Unsure QFaith OVERALL Age_Split_Under_50 Age_Split_50_and_over a. Major factor 26% 28% 26% b. Minor factor 19% 24% 18% c. Not a factor 50% 46% 52% 5% 2% 3% z. Unsure
- 7. 7 QFaith OVERALL Ethnicity_ Ethnicity_Japa Ethnicity_Fili Ethnicity_Hawa Caucasian nese pino iian a. Major factor 26% 28% 17% 59% 34% b. Minor factor 19% 16% 27% 11% 24% c. Not a factor 50% 53% 54% 15% 40% 5% 2% 2% 15% 1% z. Unsure Ethnicity_Chinese Ethnicity_Hispanic_Latino Ethnicity_Other_Mixed 26% 26% 8% 18% 17% 64% 14% 55% 3% QFaith 67% 0% 3% OVERALL Politics_Liberal Politics_Mode Politics_Conserv Politics_Uns _progressive rate ative ure a. Major factor 26% 18% 18% 52% 26% b. Minor factor 19% 16% 27% 24% 11% c. Not a factor 50% 63% 54% 23% 55% 5% 3% 1% 1% 8% z. Unsure
- 8. 8 QFaith Party_Repu Party_Democrat blican Party_Independent Party_Unsure OVERALL a. Major factor 26% 22% 47% 22% 38% b. Minor factor 19% 17% 33% 21% 0% c. Not a factor 50% 58% 19% 54% 55% 5% 3% 1% 3% 7% z. Unsure QFaith OVERALL PhoneType_Both PhoneType_Cell PhoneType_Landline a. Major factor 26% 28% 18% 23% b. Minor factor 19% 21% 26% 11% c. Not a factor 50% 50% 43% 57% z. Unsure 5% 1% 13% 9% QFaith Education_No Education_HS_Grad Education_College_Grad _degree uate uate OVERALL a. Major factor 26% 45% 38% 26% b. Minor factor 19% 11% 17% 18% c. Not a factor 50% 33% 42% 52% 5% 10% 4% 3% z. Unsure
- 9. 9 Education_SomeColl_Assoc_Voc Education_Graduate_Degree 24% 28% 62% 2% OVERALL 13% 46% QFaith 22% 2% Military_Yes Military_No a. Major factor 26% 27% 27% b. Minor factor 19% 20% 20% c. Not a factor 50% 50% 51% 5% 3% 3% z. Unsure QFaith OVERALL Union_Yes Union_No a. Major factor 26% 26% 27% b. Minor factor 19% 21% 20% c. Not a factor 50% 52% 50% 5% 2% 3% z. Unsure
- 10. 10 QFaith OVERALL Children_Yes Children_No Children_Refused a. Major factor 26% 27% 26% 30% b. Minor factor 19% 25% 15% 16% c. Not a factor 50% 45% 55% 49% 5% 2% 3% 6% z. Unsure QFaith OVERALL Income_Less_than _50k Income_Fifty_to_100k Income_Over_100k a. Major factor 26% 32% 25% 23% b. Minor factor 19% 19% 21% 26% c. Not a factor 50% 44% 53% 51% 5% 6% 1% 0% z. Unsure QFaith County_CD_Oahu_CD _01 OVERALL County_CD_Oahu_CD_02 a. Major factor 26% 26% 22% b. Minor factor 19% 23% 18% c. Not a factor 50% 47% 55% 5% 4% 5% z. Unsure
- 11. 11 County_CD_Hawaii County_CD_Maui County_CD_Kauai 34% 23% 30% 9% 17% 13% 48% 57% 57% 8% 3% 0% QAttitude: Would you say your views on same-sex marriage have changed during the past year or two, or have they remained the same? QAttitude Overall a. More supportive 20% b. Less supportive 21% c. Same 53% z. Unsure QAttitude 5% OVERALL Gender_Male Gender_Female a. More supportive 20% 18% 22% b. Less supportive 21% 19% 23% c. Same 53% 59% 51% 5% 4% 4% z. Unsure
- 12. 12 QAttitude OVERALL Age_Split_Under_50 Age_Split_50_and_over a. More supportive 20% 15% 22% b. Less supportive 21% 20% 21% c. Same 53% 64% 52% 5% 2% 4% z. Unsure Ethnicity_Cauc Ethnicity_Japane Ethnicity_Filipi OVERALL asian se no QAttitude a. More supportive 20% 21% 20% 18% b. Less supportive 21% 16% 23% 23% c. Same 53% 62% 55% 40% 5% 1% 2% 19% z. Unsure Ethnicity_Hawa Ethnicity_Chi Ethnicity_Hispanic_ iian nese Latino Ethnicity_Other_ Mixed 21% 10% 8% 17% 29% 24% 43% 19% 47% 65% 42% 58% 2% 1% 7% 5%
- 13. 13 QAttitude Politics_Liberal_pro Politics_Mode Politics_Conserv Politics_Uns OVERALL gressive rate ative ure a. More supportive 20% 28% 23% 11% 8% b. Less supportive 21% 11% 21% 32% 25% c. Same 53% 60% 54% 55% 56% 5% 1% 2% 2% 11% z. Unsure QAttitude OVERALL a. More supportive 20% 27% 6% 12% 2% b. Less supportive 21% 17% 36% 22% 5% c. Same 53% 53% 57% 64% 80% 5% 3% 2% 2% 13% z. Unsure QAttitude Party_Democrat Party_Uns Party_Republican Party_Independent ure OVERALL PhoneType_Both PhoneType_Cell PhoneType_Landline a. More supportive 20% 20% 9% 16% b. Less supportive 21% 22% 32% 10% c. Same 53% 56% 52% 64% 5% 2% 6% 10% z. Unsure
- 14. 14 QAttitude OVERALL Education_No_degree Education_HS_Graduate a. More supportive 20% 20% 13% b. Less supportive 21% 45% 40% c. Same 53% 29% 42% 5% 6% 5% z. Unsure Education_College_Graduate Education_SomeCol_Assoc_Voc Education_Graduate_Degree 21% 19% 16% 19% 16% 61% 55% 64% 1% QAttitude 21% 4% 1% OVERALL Military_Yes Military_No a. More supportive 20% 20% 19% b. Less supportive 21% 21% 21% c. Same 53% 56% 58% 5% 3% 3% z. Unsure QAttitude OVERALL a. More supportive 20% 19% 20% b. Less supportive 21% 22% 20% c. Same 53% 57% 56% 5% 2% 3% z. Unsure Union_Yes Union_No
- 15. 15 QAttitude OVERALL Children_Yes Children_No Children_Refused a. More supportive 20% 22% 19% 8% b. Less supportive 21% 24% 17% 28% c. Same 53% 50% 62% 63% 5% 4% 2% 1% z. Unsure QAttitude Income_Less_th OVERALL an_50k Income_Fifty_to_100k Income_Over_100k a. More supportive 20% 16% 24% 23% b. Less supportive 21% 27% 16% 18% c. Same 53% 53% 58% 58% 5% 4% 1% 2% z. Unsure QAttitude County_CD_Oah County_CD_Oahu_C OVERALL u_CD_01 D_02 a. More supportive 20% 21% 19% b. Less supportive 21% 22% 21% c. Same 53% 52% 55% 5% 5% 6% z. Unsure
- 16. 16 County_CD_Hawaii County_CD_Maui County_CD_Kauai 19% 22% 24% 14% 20% 22% 59% 54% 50% 8% 4% 4% QPressure: With public support of same sex marriage increasing over the past few years, have you ever felt pressured to say you support same sex marriage more than you actually do? QPressure Overall a. Pressured 15% b. Not Pressured 76% z. Unsure 8% QPressure OVERALL Gender_Male Gender_Female a. Pressured 15% 15% 16% b. Not Pressured 76% 79% 76% z. Unsure 8% 6% 7%
- 17. 17 QPressure OVERALL Age_Split_Under_50 Age_Split_50_and_over a. Pressured 15% 21% 14% b. Not Pressured 76% 74% 79% z. Unsure 8% 4% 7% QPressure OVERALL Ethnicity_Caucasi Ethnicity_Japanes Ethnicity_Filipi an e no a. Pressured 15% 16% 14% 14% b. Not Pressured 76% 82% 80% 65% z. Unsure 8% 2% 5% 21% Ethnicity_Hawai Ethnicity_Chin Ethnicity_Hispanic_La Ethnicity_Other_Mi ian ese tino xed 27% 24% 14% 69% 80% 55% 73% 4% QPressure 17% 3% 21% 13% Politics_Liberal_p Politics_Mode Politics_Conserv Politics_Uns OVERALL rogressive rate ative ure a. Pressured 15% 16% 18% 20% 9% b. Not Pressured 76% 82% 78% 74% 74% z. Unsure 8% 3% 4% 6% 17%
- 18. 18 QPressure OVERALL Party_De Party_Republi Party_Independ Party_Unsu mocrat can ent re a. Pressured 15% 13% 20% 21% 13% b. Not Pressured 76% 81% 77% 70% 74% z. Unsure 8% 5% 3% 9% 13% QPressure OVERALL PhoneType_ PhoneType_Ce PhoneType_Landli Both ll ne a. Pressured 15% 18% 0% 12% b. Not Pressured 76% 78% 100% 68% z. Unsure 8% 4% 0% 20% QPressure Education_No_deg Education_HS_Graduat OVERALL ree e a. Pressured 15% 33% 13% b. Not Pressured 76% 44% 79% z. Unsure 8% 23% 8% Education_College_Gr Education_SomeColl_Ass Education_Graduate_ aduate oc_Voc Degree 10% 18% 21% 86% 73% 78% 4% 9% 1%
- 19. 19 QPressure OVERALL Military_Yes Military_No a. Pressured 15% 19% 13% b. Not Pressured 76% 75% 81% 8% 6% 6% z. Unsure QPressure OVERALL Union_Yes Union_No a. Pressured 15% 19% 15% b. Not Pressured 76% 75% 79% z. Unsure 8% 6% 6% QPressure OVERALL Children_ Children_Yes No Children_Refused a. Pressured 15% 21% 12% 16% b. Not Pressured 76% 72% 83% 83% z. Unsure 8% 7% 5% 1% QPressure Income_Less_tha Income_Fifty_to_1 Income_Over_10 OVERALL n_50k 00k 0k a. Pressured 15% 19% 14% 20% b. Not Pressured 76% 73% 81% 78% z. Unsure 8% 8% 5% 2%
- 20. 20 QPressure County_CD_Oahu_ County_CD_Oahu_CD OVERALL CD_01 _02 a. Pressured 15% 19% 12% b. Not Pressured 76% 73% 81% z. Unsure 8% 8% 7% County_CD_Hawaii County_CD_Maui County_CD_Kauai 14% 11% 2% 74% 84% 92% 12% 6% 6%