

Recomendados
Más contenido relacionado
Similar a Cody A. Ray DEXA Report 3/21/2013
Similar a Cody A. Ray DEXA Report 3/21/2013 (20)
Más de Cody Ray
Más de Cody Ray (9)
Último
Último (20)
Cody A. Ray DEXA Report 3/21/2013
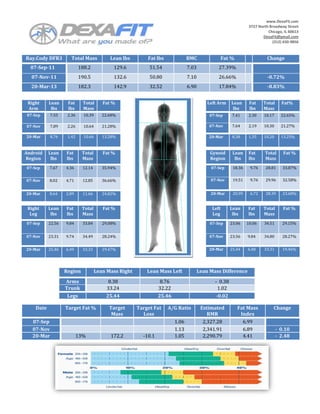
- 1. www.DexaFit.com 3727 North Broadway Street Chicago, IL 60613 DexaFit@gmail.com (312) 650-9856 Ray.Cody DFR3 Total Mass Lean lbs Fat lbs BMC Fat % Change 07-Sep-11 188.2 129.6 51.54 7.03 27.39% 07-Nov-11 190.5 132.6 50.80 7.10 26.66% -0.72% 20-Mar-13 182.3 142.9 32.52 6.90 17.84% -8.83% Right Lean Fat Total Fat % Left Arm Lean Fat Total Fat% Arm lbs lbs Mass lbs lbs Mass 07-Sep 7.55 2.36 10.39 22.68% 07-Sep 7.41 2.30 10.17 22.65% 07-Nov 7.89 2.26 10.64 21.28% 07-Nov 7.64 2.19 10.30 21.27% 20-Mar 8.76 1.42 10.66 13.28% 20-Mar 8.38 1.35 10.20 13.25% Android Lean Fat Total Fat % Gynoid Lean Fat Total Fat % Region lbs lbs Mass Region lbs lbs Mass 07-Sep 7.67 4.36 12.14 35.94% 07-Sep 18.36 9.76 28.81 33.87% 07-Nov 8.02 4.71 12.85 36.66% 07-Nov 19.51 9.76 29.96 32.58% 20-Mar 8.64 2.89 11.66 24.82% 20-Mar 20.99 6.72 28.39 23.68% Right Lean Fat Total Fat % Left Lean Fat Total Fat % Leg lbs lbs Mass Leg lbs lbs Mass 07-Sep 22.56 9.84 33.84 29.08% 07-Sep 23.06 10.06 34.51 29.15% 07-Nov 23.31 9.74 34.49 28.24% 07-Nov 23.56 9.84 34.80 28.27% 20-Mar 25.46 6.49 33.33 19.47% 20-Mar 25.44 6.48 33.31 19.46% Region Lean Mass Right Lean Mass Left Lean Mass Difference Arms 8.38 8.76 - 0.38 Trunk 33.24 32.22 1.02 Legs 25.44 25.46 -0.02 Date Target Fat % Target Target Fat A/G Ratio Estimated Fat Mass Change Mass Loss RMR Index 07-Sep 1.06 2,327.28 6.99 07-Nov 1.13 2,341.91 6.89 - 0.10 20-Mar 13% 172.2 -10.1 1.05 2,290.79 4.41 - 2.48
- 2. www.DexaFit.com 3727 North Broadway Street Chicago, IL 60613 DexaFit@gmail.com (312) 650-9856 BODY COMPOSITION CHANGE Region 07-Sep 07-Nov Change 20-Mar Change TOTAL BODY 27.4% 26.7% -0.7% 17.8% -8.8% Comparing Regions Mass 188.2 190.5 2.3 182.3 -8.2 40.0% Fat 51.5 50.8 -0.7 32.5 -18.3 35.0% Arms Lean 129.6 132.6 3.0 142.9 10.3 30.0% Legs Percent Fat 25.0% LEFT ARM 22.6% 21.3% -1.4% 13.3% -8.0% Trunk 20.0% Mass 10.2 10.3 0.1 10.2 -0.1 15.0% Gynoid Fat 2.3 2.2 -0.1 1.4 -0.8 10.0% Android Lean 7.4 7.6 0.2 8.4 0.7 5.0% Total Body 0.0% RIGHT ARM 22.7% 21.3% -1.4% 13.3% -8.0% 07-Sep-11 07-Nov-11 20-Mar-13 Mass 10.4 10.6 0.3 10.7 0.0 Fat 2.4 2.3 -0.1 1.4 -0.8 Lean 7.5 7.9 0.3 8.8 0.9 TRUNK 29.0% 28.5% -0.5% 18.8% -9.8% Changing Weight (lbs) Mass 87.6 88.5 0.9 83.1 -5.4 250.00 Fat 25.4 25.3 -0.2 15.6 -9.7 200.00 Lean 60.1 61.1 1.0 65.5 4.4 150.00 Total LEFT LEG 29.1% 28.3% -0.9% 19.5% -8.8% Lbs Fat Mass 34.5 34.8 0.3 33.3 -1.5 100.00 Lean Fat 10.1 9.8 -0.2 6.5 -3.4 50.00 Lean 23.1 23.6 0.5 25.4 1.9 - RIGHT LEG 29.1% 28.2% -0.8% 19.5% -8.8% 07-Sep-11 07-Nov-11 20-Mar-13 Mass 33.8 34.5 0.7 33.3 -1.2 Fat 9.8 9.7 -0.1 6.5 -3.2 Lean 22.6 23.3 0.7 25.5 2.2 Total Body Region Fat % ANDROID 35.9% 36.7% 0.7% 24.8% -11.8% (red line = target) Mass 12.1 12.9 0.7 11.7 -1.2 30.0% Fat 4.4 4.7 0.3 2.9 -1.8 25.0% Lean 7.7 8.0 0.4 8.6 0.6 20.0% GYNOID 33.9% 32.6% -1.3% 23.7% -8.9% 15.0% Mass 28.8 30.0 1.2 28.4 -1.6 10.0% Fat 9.8 9.8 0.0 6.7 -3.0 5.0% Lean 18.4 19.5 1.1 21.0 1.5 0.0% 07-Sep-11 07-Nov-11 20-Mar-13 Lean Mass 07-Sep 07-Nov Change 20-Mar Change Balance Distribution 40% (Male - % Fat) Arms 0.14 0.25 -0.11 0.38 -0.13 35% Trunks -0.07 0.14 -0.21 -1.02 1.16 30% Legs -0.50 -0.26 -0.24 0.02 -0.27 25% 20% 15% 10% Fat Mass 07-Sep 07-Nov Change 20-Mar Change 5% Distribution 0% Trunk / Total 49.34% 49.73% 0.39% 47.97% -1.76% 0% 4% 8% 12% 22% 28% 33% 39% 44% 50% Legs / Tootal 38.61% 38.54% -0.07% 39.88% 1.34% Fat % Arms / Total 47.65% 47.31% -0.34% 48.39% 1.08%
- 3. www.DexaFit.com 3727 North Broadway Street Chicago, IL 60613 DexaFit@gmail.com (312) 650-9856 REGION % CHANGE (red = average % fat of gender) Total Arms 30.0% 25.0% 25.0% 20.0% 20.0% 15.0% 15.0% 10.0% 10.0% 5.0% 5.0% 0.0% 0.0% 07-Sep-11 07-Nov-11 20-Mar-13 07-Sep-11 07-Nov-11 20-Mar-13 Legs Trunk 35.0% 35.0% 30.0% 30.0% 25.0% 25.0% 20.0% 20.0% 15.0% 15.0% 10.0% 10.0% 5.0% 5.0% 0.0% 0.0% 07-Sep-11 07-Nov-11 20-Mar-13 07-Sep-11 07-Nov-11 20-Mar-13 Android Gynoid 40.0% 40.0% 35.0% 35.0% 30.0% 30.0% 25.0% 25.0% 20.0% 20.0% 15.0% 15.0% 10.0% 10.0% 5.0% 5.0% 0.0% 0.0% 07-Sep-11 07-Nov-11 20-Mar-13 07-Sep-11 07-Nov-11 20-Mar-13
- 4. www.DexaFit.com 3727 North Broadway Street Chicago, IL 60613 DexaFit@gmail.com (312) 650-9856 Fat Mass Index FMI Severe Moderate Mild Fat Normal Excess Fat Obese Class I Obese Obese Class Fat Fat Deficit Deficit Class II Class Deficit III Male <2 2 to <2.3 2.3 to <3 3-6 >6 to 9 >9 to 12 >12 to >15 15 Female <3.5 3.5 to <4 4 to <5 5-9 >9 to 13 >13 to 17 >17 to >21 21 Fat Mass Index (FMI) vs. BMI: Currently, BMI is the standard measure for clinical obesity. One advantage of FMI over BMI is that it amplifies the relative effect of weight loss or gain on body fat based on different variables: aging, crash diets, height, etc. Expression of a change in body fat in absolute value fails to allow an appropriate comparison among subjects of different sizes or backgrounds. Where BMI may fail to change substantially because of an associated physical activity program (e.g., strength training), the body’s fat mass may substantially decrease, and hence the FMI as well. The high sensitivity of FMI to a slight change of body fat stores and lean mass, compared to the BMI or percentage of total body fat, makes it more valuable for assessing static and dynamic nutritional status and body composition health. Problems with BMI (Weight/Height^2) Advantages of FMI (Fat Mass/height^2) Measure of excess weight, not excess fat Measure of excess fat not confounded by Not gender specific lean mass Same reference values for both genders Gender specific reference values Muscle Symmetry: A lean mass difference close to zero indicates a balance of muscle. An injury, non- symmetrical training, or health condition may cause a disproportionate lean mass difference. Android and Gynoid Fat: When in lean and peak condition, android fat (i.e. belly/visceral fat) should be around 60-65% of gynoid fat (i.e. hips, thighs, and buttocks). When out of shape and overweight, android fat can exceed gynoid fat—a possible precursor to disease if it continues to increase or stay the same over time. A/G Ratio: The android to gynoid ratio is directly correlated to the prevalence of visceral fat, which is a result of organs insulating themselves from toxins by encapsulating the toxins in fat. This survival strategy may impede organ function and increase the risk for heart disease, stroke, and metabolic syndrome. Ideally your android fat will be lower than your gynoid fat (a ratio below 1.0). Target Fat Loss: Your target fat loss is the amount of fat mass you need to lose (assuming lean mass stays the same) to reach your target fat percentage. A/G Ratio Optimal 0.8 Target 1.0 Risk 1.2 Risk http://www.ncbi.nlm.nih.gov/pubmed/20737611 http://www.nature.com/ijo/journal/v26/n7/abs/0802037a.html http://www.ncbi.nlm.nih.gov/pmc/articles/PMC2929934/
- 5. www.DexaFit.com 3727 North Broadway Street Chicago, IL 60613 DexaFit@gmail.com (312) 650-9856 Female Body Composition Values by Age: Age Range Mean Age BMC (g) Tissue (%fat) Region Android Gynoid A/G Ratio (%fat) (%fat) (%fat) 18-29 22.5 2626 28.6 27.4 31 38 0.8 30-39 35.5 2523 30.9 29.6 34.6 39.9 0.85 40-49 45.4 2653 33.3 31.9 37 41.6 0.87 50-59 54.6 2479 34.9 33.6 38.7 43.2 0.89 18-59 40 2580 32.1 30.8 35.4 40.8 0.85 Male Body Composition Values by Age: Age Range Mean Age BMC (g) Tissue (%fat) Region Android Gynoid A/G Ratio (%fat) (%fat) (%fat) 18-29 22.7 3308 13.8 13.2 17.7 18.1 0.94 30-39 35 3534 22.8 21.8 31.5 28.4 1.11 40-49 44.4 3226 19.3 18.6 23.8 20.5 1.04 50-59 54.0 3304 24 23.1 32.2 26.9 1.17 18-59 32.9 3314 17.3 16.6 22.5 21 1.01 BMD and Body Composition Values of College Runners, Swimmers, and Baseball Players: Region BMD (cm²) BMC (g) Fat (lbs) Lean (lbs) %Fat Arms Runner 1.043 491 2.21 17.64 10.6 Swimmers 0.992 478 2.87 18.96 12.6 Baseball Players 1.125 524 4.41 18.96 17.8 Legs Runner 1.531 1400 8.16 46.74 14.0 Swimmers 1.314 1183 10.8 45.42 18.3 Baseball Players 1.538 1426 16.3 48.50 24 Trunk Runner 1.152 991 8.61 65.26 11.1 Swimmers 1.077 984 13.01 68.34 15.4 Baseball Players 1.225 1111 21.16 67.02 22.7 Android Runner — — 0.88 9.04 9.8 Swimmers — — 1.76 9.26 15.4 Baseball Players — — 3.53 9.04 26.0 Gynoid Runner — — 3.11 21.61 12.2 Swimmers — — 5.29 21.16 20.1 Baseball Players — — 9.04 21.16 29.3 Total Runner 1.371 3417 20.72 137.13 12.5 Swimmers 1.247 3178 28.89 140.88 16.2 Baseball Players 1.414 3604 43.87 142.42 22.2 *Dr. Mary K. Oates: http://dxabodycomp.com/medical_research.php