Q3 2013 The Woodlands Office Market Research Report
•
1 recomendación•196 vistas


Recomendados
Recomendados
Más contenido relacionado
La actualidad más candente
La actualidad más candente (10)
Destacado
Destacado (7)
Similar a Q3 2013 The Woodlands Office Market Research Report
Similar a Q3 2013 The Woodlands Office Market Research Report (20)
Más de Colliers International | Houston
Más de Colliers International | Houston (20)
Último
Último (20)
Q3 2013 The Woodlands Office Market Research Report
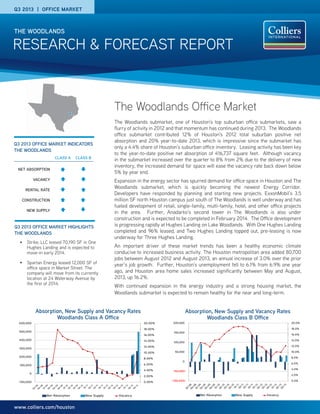
- 1. RESEARCH & FORECAST REPORT THE WOODLANDS www.colliers.com/houston The Woodlands Office Market The Woodlands submarket, one of Houston’s top suburban office submarkets, saw a flurry of activity in 2012 and that momentum has continued during 2013. The Woodlands office submarket contributed 12% of Houston’s 2012 total suburban positive net absorption and 20% year-to-date 2013, which is impressive since the submarket has only a 4.4% share of Houston’s suburban office inventory. Leasing activity has been key to the year-to-date positive net absorption of 416,737 square feet. Although vacancy in the submarket increased over the quarter to 8% from 2% due to the delivery of new inventory, the increased demand for space will ease the vacancy rate back down below 5% by year end. Expansion in the energy sector has spurred demand for office space in Houston and The Woodlands submarket, which is quickly becoming the newest Energy Corridor. Developers have responded by planning and starting new projects. ExxonMobil’s 3.5 million SF north Houston campus just south of The Woodlands is well underway and has fueled development of retail, single-family, multi-family, hotel, and other office projects in the area. Further, Anadarko’s second tower in The Woodlands is also under construction and is expected to be completed in February 2014. The Office development is progressing rapidly at Hughes Landing on Lake Woodlands. With One Hughes Landing completed and 96% leased, and Two Hughes Landing topped out, pre-leasing is now underway for Three Hughes Landing. An important driver of these market trends has been a healthy economic climate conducive to increased business activity. The Houston metropolitan area added 80,700 jobs between August 2012 and August 2013, an annual increase of 3.0% over the prior year’s job growth. Further, Houston’s unemployment fell to 6.1% from 6.9% one year ago, and Houston area home sales increased significantly between May and August, 2013, up 16.2%. With continued expansion in the energy industry and a strong housing market, the Woodlands submarket is expected to remain healthy for the near and long-term. Q3 2013 OFFICE MARKET INDICATORS THE WOODLANDS Q3 2013 OFFICE MARKET HIGHLIGHTS THE WOODLANDS • Strike, LLC leased 70,190 SF in One Hughes Landing and is expected to move-in early 2014. • Spartan Energy leased 12,000 SF of office space in Market Street. The company will move from its currently location at 24 Waterway Avenue by the first of 2014. CLASS A CLASS B NET ABSORPTION VACANCY RENTAL RATE CONSTRUCTION NEW SUPPLY Q3 2013 | OFFICE MARKET 0.00% 2.00% 4.00% 6.00% 8.00% 10.00% 12.00% 14.00% 16.00% 18.00% 20.00% -100,000 0 100,000 200,000 300,000 400,000 500,000 600,000 Net Absorption New Supply Vacancy Absorption, New Supply and Vacancy Rates Woodlands Class A Office 0.0% 2.0% 4.0% 6.0% 8.0% 10.0% 12.0% 14.0% 16.0% 18.0% 20.0% (100,000) (50,000) 0 50,000 100,000 150,000 200,000 Net Absorption New Supply Vacancy Absorption, New Supply and Vacancy Rates Woodlands Class B Office
- 2. Woodlands Submarket Map $0.00 $5.00 $10.00 $15.00 $20.00 $25.00 $30.00 $35.00 $40.00 Class A Rental Rates Historical Average Quoted Rental Rates Woodlands Class A Office Colliers International Statistics Revenues: $2.0 Billion Countries: 62 Offices: 482 Professionals: 13,500 Brokers: 5,100 Square Feet Managed: 1.12 Billion* Lease/Sale Transactions: 78,000 Total Transaction Value: $71 Billion (Based on 2012 results.) *The combination of Colliers International and FirstService results in 2.515 Billion under management - 2nd largest in the world. www.colliers.com/houston/houston/houston Accelerating success. Lisa R. Bridges Director of Market Research | Houston Direct +1 713 830 2125 lisa.bridges@colliers.com Colliers International 1300 Post Oak Boulevard Suite 200 Houston, TX 77056 United States www.colliers.com $0.00 $5.00 $10.00 $15.00 $20.00 $25.00 $30.00 Class B Rental Rates 1488 2920 249 1314 242 Huffsmith-Kohrville WoodlandsParkway ResearchForest Needham Rd. Grogan’sMillRd. Spring Stuebner GoslingRd. Kuykendahl ToHoustonCBD Historical Average Quoted Rental Rates Woodlands Class B Office The average quoted rental rates are a mix of direct and sublet rates and are based on a mix of gross and NNN. The graphs below are only intended to show rental rate trends. Actual gross rates are higher than the average rate shown in the graph. P. 2 | COLLIERS INTERNATIONAL RESEARCH & FORECAST REPORT | Q3 2013 | THE WOODLANDS