Q4 2014 Houston Office Market Research & Forecast Report
•
1 like•261 views

Houston’s Office Market Records 6.8M SF of Positive Net Absorption in 2014. Houston’s office market posted 2.2M SF of positive net absorption in Q4 2014, bringing the year-end total to 6.8M SF.

Recommended
More Related Content
Viewers also liked
Viewers also liked (15)
More from Colliers International | Houston
More from Colliers International | Houston (20)
Recently uploaded
Recently uploaded (20)
Q4 2014 Houston Office Market Research & Forecast Report
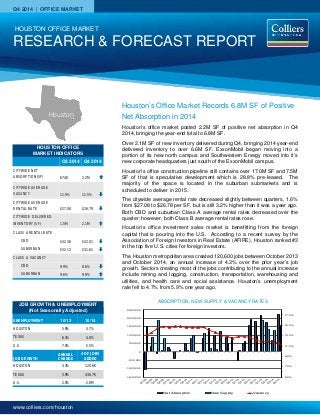
- 1. www.colliers.com/houston Q4 2014 | OFFICE MARKET HOUSTON OFFICE MARKET INDICATORS Q3 2014 Q4 2014 CITYWIDE NET ABSORPTION (SF) 674K 2.2M CITYWIDE AVERAGE VACANCY 11.9% 11.5% CITYWIDE AVERAGE RENTAL RATE $27.08 $26.79 CITYWIDE DELIVERED INVENTORY (SF) 1.5M 2.1M CLASS A RENTAL RATE CBD $42.36 $42.01 SUBURBAN $32.13 $31.61 CLASS A VACANCY CBD 9.9% 8.6% SUBURBAN 9.6% 9.9% RESEARCH & FORECAST REPORT HOUSTON OFFICE MARKET Houston’s Office Market Records 6.8M SF of Positive Net Absorption in 2014 Houston’s office market posted 2.2M SF of positive net absorption in Q4 2014, bringing the year-end total to 6.8M SF. Over 2.1M SF of new inventory delivered during Q4, bringing 2014 year-end delivered inventory to over 6.6M SF. ExxonMobil began moving into a portion of its new north campus and Southwestern Energy moved into it’s new corporate headquarters just south of the ExxonMobil campus. Houston’s office construction pipeline still contains over 17.0M SF and 7.5M SF of that is speculative development which is 28.8% pre-leased. The majority of the space is located in the suburban submarkets and is scheduled to deliver in 2015. The citywide average rental rate decreased slightly between quarters, 1.6% from $27.08 to $26.78 per SF, but is still 3.2% higher than it was a year ago. Both CBD and suburban Class A average rental rates decreased over the quarter; however, both Class B average rental rates rose. Houston’s office investment sales market is benefitting from the foreign capital that is pouring into the U.S. According to a recent survey by the Association of Foreign Investors in Real Estate (AFIRE), Houston ranked #3 in the top five U.S. cities for foreign investors. The Houston metropolitan area created 120,600 jobs between October 2013 and October 2014, an annual increase of 4.3% over the prior year’s job growth. Sectors creating most of the jobs contributing to the annual increase include mining and logging, construction, transportation, warehousing and utilities, and health care and social assistance. Houston’s unemployment rate fell to 4.7% from 5.9% one year ago. 5.0% 7.0% 9.0% 11.0% 13.0% 15.0% 17.0% -1,500,000 -1,000,000 -500,000 0 500,000 1,000,000 1,500,000 2,000,000 2,500,000 Net Absorption New Supply Vacancy Houston UNEMPLOYMENT 10/13 10/14 HOUSTON 5.9% 4.7% TEXAS 6.1% 4.8% U.S. 7.0% 5.5% JOB GROWTH ANNUAL CHANGE # OF JOBS ADDED HOUSTON 4.3% 120.6K TEXAS 3.9% 436.7K U.S. 2.0% 2.8M JOB GROWTH & UNEMPLOYMENT (Not Seasonally Adjusted) ABSORPTION, NEW SUPPLY & VACANCY RATES
- 2. RESEARCH & FORECAST REPORT | Q4 2014 | HOUSTON OFFICE MARKET $0.00 $5.00 $10.00 $15.00 $20.00 $25.00 $30.00 $35.00 $40.00 $45.00 Class A Office Rents CBD Rents Suburban Rents 0.0% 2.0% 4.0% 6.0% 8.0% 10.0% 12.0% 14.0% 16.0% CBD VS. Suburban Class A Office Vacancy CBD Vacancy Suburban Vacancy 2COLLIERS INTERNATIONAL | P. VACANCY & AVAILABILITY Houston’s citywide vacancy rate fell 40 basis points between quarters from 11.9% to 11.5% and fell by 50 basis points annually from 12.0% in Q4 2013. Between quarters, the average suburban vacancy rate decreased 20 basis points from 12.2% to 12.0% while the average CBD vacancy rate decreased 110 basis points from 10.9% to 9.8%. The average CBD Class A vacancy rate decreased 130 basis points between quarters from 9.9% to 8.6%, and the average CBD Class B vacancy rate fell 30 basis points from 10.4% to 10.1%. The average suburban Class A vacancy rate increased 30 basis points from 9.6% to 9.9%, and the average suburban Class B vacancy rate decreased 80 basis points from 14.6% to 13.8% between quarters. Of the 1,647 existing office buildings in our survey, only 47 have 100,000 SF of contiguous space available for lease or sublease. Further, only 16 have 200,000 SF of contiguous space available. Citywide, available sublease space totals 4.6 million SF or 2.2% of Houston’s total office inventory, but only 1.7 million SF of this sublease space is currently vacant. ABSORPTION & DEMAND Houston’s office market posted 2,248,224 SF of positive net absorption in Q4 2014, pushing year-end total net absorption to 6,841,398 SF. Suburban Class A space posted the largest gain, with 1,113,430 SF of positive net absorption, the majority of which occurred in The Woodlands submarket. Some of the larger tenants that moved into new space during Q4 include ExxonMobil Company (1,000,000 SF) moving into the first phase of its new north Houston corporate campus in The Woodlands submarket, Memorial Resource Development (125,000 SF) and Motive Enterprises (109,000 SF) which moved into One Allen Center located in the CBD submarket, and Samsung Engineering America Inc. (80,000 SF) which moved into Two BriarLake Plaza in the Westchase submarket. RENTAL RATES The citywide average rental rate decreased 1.1% from $27.08 per SF in Q3 2014 to $26.79 per SF, but was still up 3.2% from $25.97 per SF in Q4 2013. The average citywide rental rate for Class A fell 1.0% over the quarter and the average citywide Class B rental rate increased 1.3% between quarters. The CBD Class A average rental rate decreased 0.8% from $42.36 per SF in Q3 2014 to $42.01 per SF. The suburban Class A average rental rate fell 1.7% from $32.13 per SF in Q3 2014 to $31.61 per SF. The average CBD Class B rental rate rose 0.5%, and the average suburban Class B rental rate rose 1.3% between quarters. Building Name Address Submarket RBA (SF) Year Built % Leased Avail. SF Rent ($/SF) Owner Wells Fargo Plaza 1000 Louisiana St CBD 1,721,242 1983 97.8% 86,799 $53.87 New York State Common Retirement Fund Heritage Plaza 1111 Bagby CBD 1,359,266 1986 98.9% 14,318 $50.71 AEW Capital Management and Brookfield Office Properties, Inc. BG Group Place 811 Main CBD 972,474 2011 96.5% 144,264 $51.96 NPS of Korea CityCentre Three 842 W Sam Houston Pky N Katy Freeway 120,211 2012 94.7% 6,349 $45.96 Midway T & C Land Investors Williams Tower 2800 Post Oak Blvd West Loop/Galleria 1,476,973 1983 99.1% 70,353 $48.36 Invesco Real Estate BBVA Compass Plaza 2200 Post Oak Blvd West Loop/Galleria 312,574 2013 78.4% 67,523 $46.00 RS Post Oak Perennial LP CityWestPlace 4 2103 CityWest Blvd Westchase 518,293 2001 99.5% 92,984 $47.43 Parkway Properties, Inc. One BriarLake Plaza 2000 W Sam Houston Pky Westchase 502,410 2000 97.5% 64,802 $47.97 TIER REIT, Inc. Two Hughes Landing 1790 Hughes Landing Blvd The Woodlands 197,719 2014 86.2% 27,251 $41.92- $48.92 The Woodlands Development Company, L.P. Note: Avail. SF includes direct and sublet space as well as any future available space listed. Source: CoStar Property QUOTED GROSS RENTAL RATES FOR EXISTING TOP PERFORMING OFFICE BUILDINGS
- 3. RESEARCH & FORECAST REPORT | Q4 2014 | HOUSTON OFFICE MARKET Q4 2014 SIGNIFICANT SALES TRANSACTIONS – (100,000 SF or greater) Building Name Submarket RBA (SF) Year Built Buyer Seller Sale Price $/SF Closed The Lakes on Post Oak - 3000 Post Oak Blvd. West Loop/ Galleria 441,523 1979 FG Asset Management Five Mile Capital Partners $170M $385 11/2014 Cullen Center – 600 Jefferson CBD 449,087 1972 Stream Realty Partners Brookfield Office Properties $69M $154 10/2014 2200 West Loop South West Loop/ Galleria 201,720 1974/ 2000 Tenaris Global Services Corp. APF Properties LLC $47M $233 10/2014 Bering Office Tower – 2000 Bering Dr San Felipe/ Voss 192,211 1982/ 2008 Tanglewood Property Group 2000 Bering Ltd $29M $150 11/2014 Sam Houston Crossing One – 10343 Sam Houston Park Dr Northwest Far 159,175 2007 Fuller Realty Partners, LLC and Independencia Asset Management, LLC Duke Realty Corporation and Chambers Street Partners $26M $165 12/2014 3COLLIERS INTERNATIONAL | P. SALES ACTIVITY Houston’s office investment sales activity included 38 sales transactions and a total sales volume of approximately $478.9 million averaging $176 per SF, with an average cap rate of 5.9%. Listed below are a few significant transactions that closed in Q4 2014. LEASING ACTIVITY Houston’s office leasing activity reached 1.8 million SF in Q4 2014 with transactions including renewals, expansions, subleases, and pre-leases in buildings currently under construction. 2014 year-end leasing activity totaled just over 12.4M SF. Sources: CoStar and Real Capital Analytics 1 Renewal 2 Expansion 3 Sublease 4 Pre-lease/proposed or under construction 5 Colliers International Transaction 6Extension Building name/address Submarket SF Tenant Lease date Post Oak Central West Loop/Galleria 230,000 Stewart Information Services6 Nov-14 CityWestPlace Westchase 115,000 Bristow Group Nov-14 One Commerce Green North Belt/Greenspoint 98,000 Nabors Industries2 Dec-14 Gateway At Spring Valley Katy Freeway 40,632 StollerUSA Oct-14 330 N Sam Houston Pky E North Belt/Greenspoint 32,325 North American University Oct-14 16055 Space Center Blvd NASA/Clear Lake 33,159 MasTec1, 2, 5 Nov-14 330 N Sam Houston Pky E North Belt/Greenspoint 32,325 North American University Oct-14 Gateway At Spring Valley Katy Freeway 20,316 East West Bank4 Oct-14 America Tower Allen Parkway (Midtown) 13,680 Peregrine Petroleum Nov-14 600 Travis CBD 13,191 Wilkie Farr & Galagher3 Oct-14 1120 Nasa Parkway NASA/Clear Lake 11,707 BurrowGlobal5 Dec-14 15835 Park Ten Place Katy Freeway 10,216 NACE International2 Oct-14 Westheimer Central Plaza Westchase 10,000 Keane Franc Oct-14 Q4 2014 Select Office Leases
- 4. RESEARCH & FORECAST REPORT | Q4 2014 | HOUSTON OFFICE MARKET HOUSTON OFFICE MARKET SUMMARY (CBD, SUBURBAN & OVERALL) HOUSTON SUBURBAN OFFICE MARKET SUMMARY COLLIERS INTERNATIONAL | P. 4 VACANCY RENTAL RATE Class # of Bldgs. Total (SF) (SF) Rate (%) (SF) Rate (%) Total (SF) Q4-2014 Q3-2014 Q4-2014 Q3-2014 AVG ($/SF) CBD A 31 30,286,336 2,108,777 7.0% 482,218 1.6% 2,590,995 8.6% 9.9% 415,004 40,532 $42.01 B 30 10,395,668 1,016,288 9.8% 30,955 0.3% 1,047,243 10.1% 10.4% 35,023 27,238 $28.13 C 19 1,254,657 490,659 39.1% 0 0.0% 490,659 39.1% 38.2% -10,761 -5,529 $19.21 Total 80 41,936,661 3,615,724 8.6% 513,173 1.2% 4,128,897 9.8% 10.9% 439,266 62,241 $37.40 Suburban A 305 78,022,159 7,108,193 9.1% 595,927 0.8% 7,704,120 9.9% 9.6% 1,113,430 788,713 $31.61 B 939 78,215,289 10,232,268 13.1% 557,154 0.7% 10,789,422 13.8% 14.6% 771,485 -236,352 $20.09 C 323 14,705,326 1,930,904 13.1% 3,742 0.2% 1,934,646 13.2% 12.7% -75,957 58,904 $15.68 Total 1567 170,942,774 19,271,365 11.3% 1,156,823 0.7% 20,428,188 12.0% 12.2% 1,808,958 611,265 $24.85 Overall A 336 108,308,495 9,216,970 8.5% 1,078,145 1.0% 10,295,115 9.5% 9.7% 1,528,434 829,245 $33.96 B 969 88,610,957 11,248,556 12.7% 588,109 0.7% 11,836,665 13.4% 14.1% 806,508 -209,114 $20.78 C 342 15,959,983 2,421,563 15.2% 3,742 0.0% 2,425,305 15.2% 14.7% -86,718 53,375 $16.09 Total 1647 212,879,435 22,887,089 10.8% 1,669,996 0.8% 24,557,085 11.5% 11.9% 2,248,224 673,506 $26.79 INVENTORY DIRECT VACANCY SUBLEASE VACANCY VACANCY RATE (%) NET ABSORPTION (SF) VACANCY RENTAL RATE Class # of Bldgs. Total (SF) (SF) Rate (%) (SF) Rate (%) Total (SF) Q4-2014 Q3-2014 Q4-2014 Q3-2014 AVG ($/SF) Allen Parkway (Midtown) A 4 1,598,033 204,260 12.8% 0 0.0% 204,260 12.8% 13.0% 3,873 18,066 $32.84 B 32 2,620,056 109,025 4.2% 17,301 0.7% 126,326 4.8% 5.1% 8,063 15,653 $28.16 C 15 503,182 118,330 23.5% 0 0.0% 118,330 23.5% 22.2% -6,767 3,101 $22.82 Total 51 4,721,271 431,615 9.1% 17,301 0.4% 448,916 9.5% 9.6% 5,169 36,820 $29.54 Baytown B 3 186,005 6,248 3.4% 0 0.0% 6,248 3.4% 3.4% 0 -5,551 $17.18 C 3 81,481 1,812 2.2% 0 0.0% 1,812 2.2% 2.2% 0 0 $9.87 Total 6 267,486 8,060 3.0% 0 0.0% 8,060 3.0% 3.0% 0 -5,551 $10.98 Bellaire A 6 1,090,749 70,682 6.5% 22,105 2.0% 92,787 8.5% 10.3% 19,472 -8,083 $24.61 B 18 2,609,813 93,365 3.6% 11,155 0.4% 104,520 4.0% 4.1% 1,453 4,560 $26.27 C 5 327,020 56,097 17.2% 0 0.0% 56,097 17.2% 17.2% 0 6,498 $18.31 Total 29 4,027,582 220,144 5.5% 33,260 0.8% 253,404 6.3% 6.8% 20,925 2,975 $25.24 Conroe and Outlying Montgomery Co A 2 107,161 47,161 44.0% 0 0.0% 47,161 44.0% 44.0% 0 -329 $24.53 B 10 511,805 28,263 5.5% 0 0.0% 28,263 5.5% 4.3% -6,444 0 $18.09 C 7 289,662 4,794 1.7% 0 0.0% 4,794 1.7% 1.7% 0 2,500 $15.71 Total 19 908,628 80,218 8.8% 0 0.0% 80,218 8.8% 8.1% -6,444 2,171 $21.25 E. Fort Bend/Sugar Land A 18 3,509,489 340,378 9.7% 15,945 0.5% 356,323 10.2% 11.6% 50,949 -34,839 $28.66 B 37 2,195,623 324,745 14.8% 100,207 4.6% 424,952 19.4% 18.1% -27,224 15,760 $22.70 C 4 264,206 9,502 3.6% 2,302 0.9% 11,804 4.5% 4.5% 0 1,481 $18.99 Total 59 5,969,318 674,625 11.3% 118,454 2.0% 793,079 13.3% 13.7% 23,725 -17,598 $25.26 FM 1960 A 13 2,262,736 103,753 4.6% 34,039 1.5% 137,792 6.1% 6.9% 17,880 -1,134 $28.09 B 89 4,934,942 910,277 18.4% 0 0.0% 910,277 18.4% 19.0% 26,431 18,406 $15.56 C 20 716,153 52,563 7.3% 0 0.0% 52,563 7.3% 8.5% 8,642 -4,480 $15.51 Total 122 7,913,831 1,066,593 13.5% 34,039 0.4% 1,100,632 13.9% 14.6% 52,953 12,792 $17.21 INVENTORY DIRECT VACANCY SUBLEASE VACANCY VACANCY RATE (%) NET ABSORPTION (SF)
- 5. RESEARCH & FORECAST REPORT | Q4 2014 | HOUSTON OFFICE MARKET HOUSTON SUBURBAN OFFICE MARKET SUMMARY - CONTINUED 5COLLIERS INTERNATIONAL | P. VACANCY RENTAL RATE Class # of Bldgs. Total (SF) (SF) Rate (%) (SF) Rate (%) Total (SF) Q4-2014 Q3-2014 Q4-2014 Q3-2014 AVG ($/SF) Greenway A 16 6,224,406 427,624 6.9% 17,860 0.3% 445,484 7.2% 7.8% 40,106 -50,067 $34.80 B 33 3,386,514 222,481 6.6% 10,145 0.3% 232,626 6.9% 7.6% 25,243 5,031 $24.91 C 19 831,136 271,774 32.7% - 0.0% 271,774 32.7% 32.2% -4,318 -227 $18.24 Total 68 10,442,056 921,879 8.8% 28,005 0.3% 949,884 9.1% 9.7% 61,031 -45,263 $29.70 Gulf Freeway/Pasadena A 1 22,706 526 2.3% 0 0.0% 526 2.3% 2.3% 0 837 $27.59 B 34 1,952,561 204,285 10.5% 7,106 0.4% 211,391 10.8% 10.0% -16,397 16,161 $19.99 C 31 1,193,282 154,439 12.9% 0 0.0% 154,439 12.9% 10.3% -31,002 0 $17.18 Total 66 3,168,549 359,250 11.3% 7,106 0.2% 366,356 11.6% 10.1% -47,399 16,998 $19.14 I-10 East B 7 447,680 56,137 12.5% 0 0.0% 56,137 12.5% 14.7% 9,893 312 $14.68 C 5 267,130 68,243 25.5% 0 0.0% 68,243 25.5% 26.8% 3,300 4,291 $15.26 Total 12 714,810 124,380 17.4% 0 0.0% 124,380 17.4% 19.2% 13,193 4,603 $14.85 Katy Freeway A 73 17,021,340 836,865 4.9% 47,314 0.3% 884,179 5.2% 5.4% 143,423 162,253 $33.90 B 104 9,877,284 989,691 10.0% 204,609 2.1% 1,194,300 12.1% 12.9% 108,720 -203,421 $23.10 C 34 1,595,235 68,781 4.3% 1,440 0.1% 70,221 4.4% 3.9% -8,483 17,003 $18.14 Total 211 28,493,859 1,895,337 6.7% 253,363 0.9% 2,148,700 7.5% 7.9% 243,660 -24,165 $27.43 Kingwood/Humble B 15 853,520 58,654 6.9% 0 0.0% 58,654 6.9% 6.9% -117 -735 $20.15 C 4 141,500 144 0.1% 0 0.0% 144 0.1% 0.1% 0 1,510 $15.00 Total 19 995,020 58,798 5.9% 0 0.0% 58,798 5.9% 5.9% -117 775 $20.14 NASA/Clear Lake A 12 1,767,866 67,583 3.8% 1,311 0.1% 68,894 3.9% 5.0% 19,973 24,892 $24.37 B 47 3,186,220 933,261 29.3% 3,151 0.1% 936,412 29.4% 31.4% 65,088 29,342 $19.24 C 20 655,548 127,722 19.5% 0 0.0% 127,722 19.5% 19.7% 1,287 -1,842 $15.64 Total 79 5,609,634 1,128,566 20.1% 4,462 0.1% 1,133,028 20.2% 21.7% 86,348 52,392 $19.57 North Belt/Greenspoint A 24 5,438,248 1,106,364 20.3% 7,617 0.1% 1,113,981 20.5% 12.2% -448,746 -101,902 $28.43 B 57 5,996,655 908,223 15.1% 57,363 1.0% 965,586 16.1% 18.3% 129,199 -49,959 $15.08 C 22 1,415,652 298,645 21.1% 0 0.0% 298,645 21.1% 21.7% 8,446 -15,581 $11.68 Total 103 12,850,555 2,313,232 18.0% 64,980 0.5% 2,378,212 18.5% 16.1% -311,101 -167,442 $22.97 Northeast Near and Northeast Outlier B 4 181,618 27,386 15.1% 0 0.0% 27,386 15.1% 14.0% -1,904 22,537 $21.90 C 2 56,562 11,751 20.8% 0 0.0% 11,751 20.8% 22.1% 755 8,269 $13.99 Total 6 238,180 39,137 16.4% 0 0.0% 39,137 16.4% 15.9% -1,149 30,806 $19.03 Northwest and Northwest Outlier A 22 3,990,573 458,958 11.5% 52,861 1.3% 511,819 12.8% 13.7% 36,482 -61,578 $22.78 B 92 7,586,898 990,721 13.1% 59,187 0.8% 1,049,908 13.8% 15.4% 118,123 80,850 $18.97 C 40 1,573,367 141,140 9.0% 0 0.0% 141,140 9.0% 8.9% -1,282 10,364 $15.76 Total 154 13,150,838 1,590,819 12.1% 112,048 0.9% 1,702,867 12.9% 14.1% 153,323 29,636 $19.95 Richmond/Fountainview B 14 805,875 190,027 23.6% 0 0.0% 190,027 23.6% 25.3% 14,178 13,394 $17.40 C 12 496,843 67,347 13.6% 0 0.0% 67,347 13.6% 17.3% 18,655 5,577 $14.02 Total 26 1,302,718 257,374 19.8% 0 0.0% 257,374 19.8% 22.3% 32,833 18,971 $16.50 INVENTORY DIRECT VACANCY SUBLEASE VACANCY VACANCY RATE (%) NET ABSORPTION (SF)
- 6. RESEARCH & FORECAST REPORT | Q4 2014 | HOUSTON OFFICE MARKET HOUSTON SUBURBAN OFFICE MARKET SUMMARY - CONTINUED 6COLLIERS INTERNATIONAL | P. VACANCY RENTAL RATE Class # of Bldgs. Total (SF) (SF) Rate (%) (SF) Rate (%) Total (SF) Q4-2014 Q3-2014 Q4-2014 Q3-2014 AVG ($/SF) San Felipe/Voss A 3 1,720,793 286,055 16.6% 7,409 0.4% 293,464 17.1% 11.9% -89,325 4,387 $35.58 B 32 3,230,995 261,809 8.1% 6,778 0.2% 268,587 8.3% 9.6% 41,541 -9,181 $23.91 Total 35 4,951,788 547,864 11.1% 14,187 0.3% 562,051 11.4% 10.4% -47,784 -4,794 $30.37 South A 1 80,000 5,941 7.4% 0 0.0% 5,941 7.4% 9.7% 1,842 0 $26.98 B 12 465,159 48,148 10.4% 0 0.0% 48,148 10.4% 11.6% 5,841 -6,667 $20.74 C 5 194,042 71,100 36.6% 0 0.0% 71,100 36.6% 37.1% 889 -1,539 $23.17 Total 18 739,201 125,189 16.9% 0 0.0% 125,189 16.9% 18.1% 8,572 -8,206 $23.33 South Main/Med Center A 1 485,000 0 0.0% 0 0.0% 0 0.0% 0.0% 0 0 - B 13 854,906 185,385 21.7% 0 0.0% 185,385 21.7% 21.7% 426 21,073 $19.72 C 8 475,436 63,676 13.4% 0 0.0% 63,676 13.4% 13.8% 2,079 9,045 $16.69 Total 22 1,815,342 249,061 13.7% 0 0.0% 249,061 13.7% 13.7% 2,505 30,118 $18.85 Southeast/Outlier B 16 1,222,226 89,883 7.4% 0 0.0% 89,883 7.4% 8.6% 61,245 -20,897 $21.13 C 5 213,543 50,514 23.7% 0 0.0% 50,514 23.7% 0.0% -50,514 0 $17.00 Total 21 1,435,769 140,397 9.8% 0 0.0% 140,397 9.8% 7.3% 10,731 -20,897 $20.55 Southwest A 6 1,583,702 254,364 16.1% 0 0.0% 254,364 16.1% 16.3% 3,811 29,229 $16.56 B 64 5,675,165 1,423,921 25.1% 0 0.0% 1,423,921 25.1% 27.2% 120,903 -136,654 $15.78 C 42 2,200,629 208,270 9.5% 0 0.0% 208,270 9.5% 9.5% 691 10,957 $14.02 Total 112 9,459,496 1,886,555 19.9% 0 0.0% 1,886,555 19.9% 21.3% 125,405 -96,468 $15.66 Southwest Far and Outlier A 3 166,551 26,872 16.1% 0 0.0% 26,872 16.1% 8.2% 53,720 3,248 $23.77 B 17 981,291 238,146 24.3% 0 0.0% 238,146 24.3% 31.3% 69,025 1,300 $18.75 C 2 51,396 0 0.0% 0 0.0% 0 0.0% 0.0% 0 0 $18.00 Total 22 1,199,238 265,018 22.1% 0 0.0% 265,018 22.1% 28.0% 122,745 4,548 $21.51 West Loop/Galleria A 43 16,382,709 1,431,069 8.7% 190,142 1.2% 1,621,211 9.9% 10.4% 82,034 192,818 $34.87 B 56 6,455,013 695,235 10.8% 19,793 0.3% 715,028 11.1% 11.9% 56,137 50,032 $26.70 C 4 216,268 2,269 1.0% 0 0.0% 2,269 1.0% 1.0% 0 -767 $20.59 Total 103 23,053,990 2,128,573 9.2% 209,935 0.9% 2,338,508 10.1% 10.7% 138,171 242,083 $32.48 Westchase A 30 8,160,813 994,113 12.2% 135,510 1.7% 1,129,623 13.8% 12.7% 170,859 101,757 $36.20 B 63 7,679,669 870,517 11.3% 35,233 0.5% 905,750 11.8% 11.4% -27,249 -159,065 $20.60 C 9 608,015 80,991 13.3% 0 0.0% 80,991 13.3% 10.3% -18,335 2,744 $17.24 Total 102 16,448,497 1,945,621 11.8% 170,743 1.0% 2,116,364 12.9% 12.0% 125,275 -54,564 $29.89 The Woodlands A 27 6,409,284 445,625 7.0% 63,814 1.0% 509,439 7.9% 9.5% 1,007,077 509,158 $35.39 B 70 4,317,796 366,435 8.5% 25,126 0.6% 391,561 9.1% 8.8% -10,689 61,367 $24.28 C 5 338,038 1,000 0.3% 0 0.0% 1,000 0.3% 0.3% 0 0 $19.80 Total 102 11,065,118 813,087 7.3% 88,940 0.8% 902,000 8.2% 8.9% 996,388 570,525 $30.02 INVENTORY DIRECT VACANCY SUBLEASE VACANCY VACANCY RATE (%) NET ABSORPTION (SF)
- 7. RESEARCH & FORECAST REPORT | Q4 2014 | HOUSTON OFFICE MARKET OFFICE DEVELOPMENT PIPELINE Houston’s construction pipeline contains 17.0 million SF of office space, of which 62.8% is pre-leased. Build-to-suit projects make up 56.0% of the 17.0M SF, and the remaining 7.5M SF of spec office space under construction is approximately 28.8% pre-leased. The table below includes office buildings under construction with an RBA of 50,000 SF or greater. COLLIERS INTERNATIONAL | P. 7 Data Source: CoStar Property Building Name Address Submarket SF Pre- Leased Developer Est. Delivery ExxonMobil Campus - Ph II 23125 I-45 S The Woodlands 1,500,000 100.0% Gilbane Building Company Mar-15 Phillips 66 2101 Citywest Blvd Westchase 1,100,000 100.0% Gilbane Building Company Jun-16 609 Main at Texas 609 Main St CBD 1,057,668 0.0% Hines Dec-16 CyrusOne W Campus Expansion 5150 Westway Park Blvd Northwest Far 640,000 100.0% CyrusOne Mar-15 BHP Biliton Petroleum 1500 Post Oak Blvd Galleria/Uptown 600,000 100.0% Transwestern Oct-16 Energy Center Four 925 N Eldridge Pky Katy Freeway West 600,000 100.0% Trammell Crow Company Dec-16 Energy Center Three 935 N Eldridge Pky Katy Freeway West 546,604 100.0% Trammell Crow Company Apr-15 Energy Center V 915 N Eldridge Pky Katy Freeway West 526,637 0.4% Trammell Crow Company Apr-16 ExxonMobil Campus - Ph III 23125 I-45 S The Woodlands 500,000 100.0% Gilbane Building Company Jun-15 Hilcorp Energy Tower 1110 Main Street CBD 475,000 100.0% Hines Oct-15 Noble Energy Center II SH 249 & Louetta Rd FM 1960/Hwy 249 456,000 100.0% Trammell Crow Company Jun-15 Air Liquide Center- South 9811 Katy Fwy Katy Freeway East 452,370 37.8% MetroNational Nov-15 Millennium Tower II 10353 Richmond Ave Westchase 445,000 100.0% BMS Management, Inc. Feb-16 Energy Tower IV 11750 Katy Fwy Katy Freeway West 429,157 39.4% Mac Haik Realty LLC Jan-15 3737 Buffalo Speedway 3737 Buffalo Speedway Ave Greenway Plaza 400,000 22.9% PM Realty Group Aug-15 West Memorial Place II 15377 Memorial Dr Katy Freeway West 389,709 4.1% Skanska Commercial Development Nov-15 Shell Phase 3 Bldg 1 201 N Dairy Ashford Rd Katy Freeway West 336,000 100.0% Hines Mar-15 Shell Phase 3 Bldg 2 201 N Dairy Ashford Rd Katy Freeway West 336,000 100.0% Hines Mar-15 Shell Phase 4 201 N Dairy Ashford Rd Katy Freeway West 336,000 100.0% Hines Mar-15 West Memorial Place 15375 Memorial Dr Katy Freeway West 334,147 55.3% Skanska Commercial Development Jan-15 ExxonMobil - Hughes Landing 1735 Hughes Landing Blvd The Woodlands 331,840 100.0% The Woodlands Development Company Apr-16 ExxonMobil - Hughes Landing 1725 Hughes Landing Blvd The Woodlands 317,052 100.0% The Woodlands Development Company Apr-16 Westway Plaza 11330 Clay Rd FM 1960/Hwy 249 312,000 79.8% Transwestern Apr-15 Enclave Place 1414 Enclave Katy Freeway West 300,907 0.0% PM Realty Group Aug-15 Beltway Lakes Phase III 5775 N Sam Houston Pky E Northwest Far 271,384 0.0% Radler Enterprises, Inc. Jan-15 Town Centre I 700 Town & Country Blvd Katy Freeway East 254,489 0.0% Moody Rambin Jan-15 Three Hughes landing 1780 Hughes Landing Blvd The Woodlands 250,000 0.0% The Woodlands Development Company Oct-15 Kirby Grove 2525 Richmond Ave Greenway Plaza 248,275 53.3% Midway Companies Aug-15 CityCentre Five 825 Town & Country Katy Freeway East 227,063 68.2% Midway Companies Jul-15 Legacy at Fallbrook 10720 W Sam Houston Pky N Northwest Far 206,754 15.0% Liberty Property Trust Jan-15 Academy Sports HQ 1800 N Mason Rd Katy Freeway West 200,000 100.0% Academy Jan-15 Remington Square - Ph II 10713 W Sam Houston Pky N FM 1960/Hwy 249 200,000 0.0% Stream Realty Partners, L.P. Oct-15 3773 Richmond Ave 3773 Richmond Ave Greenway Plaza 185,000 1.0% The Redstone Companies Dec-15 One Grand Crossing SWC of Grand Pky & I-10 Southwest Outlier 171,538 0.0% Trammell Crow Company Dec-15 Woodbranch Plaza IV 12120 Wickchester Ln Katy Freeway West 171,475 100.0% PM Realty Group Apr-15 San Felipe Place 2229 San Felipe Allen Parkway/Midtown 167,562 17.0% Hines Aug-15 1885 Saint James Place 1885 St James Pl West Loop/Galleria 165,000 0.0% Nelson Murphree Legacy Partners Jan-16 Chasewood Crossing Three 19350 State Highway 249 FM 1960/Hwy 249 156,000 0.0% Greenwood Corporations Dec-15 Katy Ranch Phase I 24275 Katy Fwy Southwest Outlier 151,187 0.0% Freeway Properties Mar-15 Park Ten Center - Phase II 16200 Park Row Katy Freeway West 150,000 0.0% Lincoln Property Company Aug-15 Air Liquide Center- North 9807 Katy Fwy Katy Freeway East 143,830 100.0% MetroNational May-15 Nalco Champion Headquarters 7705 Highway 90A E Fort Bend/Sugar Land 133,000 100.0% Nalco Holding Co Aug-15 Beltway 8 Corporate Centre 5060 Westway Park Blvd Northwest Far 130,451 7.9% Panattoni Development Jan-15 Mason Creek Office Center II 21700 Merchants Way Katy Freeway West 127,955 0.0% Myers Crow & Saviers, LTD. May-15 The Offices at Sam Houston 10203 W Sam Houston Dr Northwest Far 108,633 88.9% D'Agostino Companies Jul-15 River Oaks District - Office 4444 Westheimer Rd Post Oak Park 99,826 36.9% Oliver McMillan Jan-15 Gateway at Spring Valley 9090 Katy Fwy Katy Freeway East 95,459 64.0% Ersa Grae Corporation Oct-15 2829 Technology Forest Dr 2829 Technology Forest Dr The Woodlands 87,999 48.1% Black Forest Ventures Jan-15 Grandway West - Bldg 1 Grand Pky & Franz Rd Katy Freeway West 86,800 56.7% The Urban Companies Jan-15 Deerwood Glen II 4440 SH 225 Gulf Freeway/Pasadena 78,000 0.0% Clay Development Jan-15
- 8. RESEARCH & FORECAST REPORT | Q4 2014 | HOUSTON OFFICE MARKET Accelerating success. COLLIERS INTERNATIONAL 1233 W. Loop South Suite 900 Houston, Texas 77027 Main +1 713 222 2111 LISA R. BRIDGES Director of Market Research | Houston Direct +1 713 830 2125 Fax +1 713 830 2118 lisa.bridges@colliers.com The Colliers Advantage Enterprising Culture Colliers International is a leader in global real estate services, defined by our spirit of enterprise. Through a culture of service excellence and a shared sense of initiative, we integrate the resources of real estate specialists worldwide to accelerate the success of our partners. When you choose to work with Colliers, you choose to work with the best. In addition to being highly skilled experts in their field, our people are passionate about what they do. And they know we are invested in their success just as much as we are in our clients’ success. This is evident throughout our platform—from Colliers University, our proprietary education and professional development platform, to our client engagement strategy that encourages cross-functional service integration, to our culture of caring. We connect through a shared set of values that shape a collaborative environment throughout our organization that is unsurpassed in the industry. That’s why we attract top recruits and have one of the highest retention rates in the industry. Colliers International has also been recognized as one of the “best places to work” by top business organizations in many of our markets across the globe. Colliers International offers a comprehensive portfolio of real estate services to occupiers, owners and investors on a local, regional, national and international basis. *Information herein has been obtained from sources deemed reliable, however its accuracy cannot be guaranteed. COLLIERS INTERNATIONAL | P. 8