
Recomendados
Recomendados
Más contenido relacionado
La actualidad más candente
La actualidad más candente (17)
Destacado
Similar a Q4 2012 Cincinnati Market Trends Industrial
Similar a Q4 2012 Cincinnati Market Trends Industrial (20)
Más de colliersohio
Más de colliersohio (20)
Último
Último (20)
Q4 2012 Cincinnati Market Trends Industrial
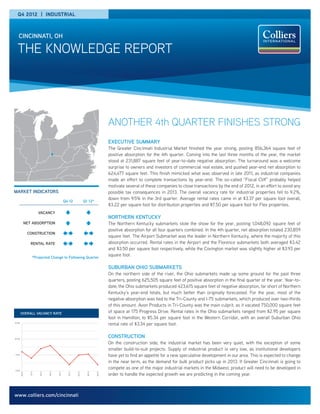
- 1. THE KNOWLEDGE REPORT CINCINNATI, OH www.colliers.com/cincinnati MARKET INDICATORS *Projected Change to Following Quarter Q4 12 Q1 13* VACANCY NET ABSORPTION CONSTRUCTION RENTAL RATE Q4 2012 | INDUSTRIAL OVERALL VACANCY RATE ANOTHER 4th QUARTER FINISHES STRONG EXECUTIVE SUMMARY The Greater Cincinnati Industrial Market finished the year strong, posting 856,364 square feet of positive absorption for the 4th quarter. Coming into the last three months of the year, the market stood at 231,887 square feet of year-to-date negative absorption. The turnaround was a welcome surprise to owners and investors of commercial real estate, and pushed year-end net absorption to 624,477 square feet. This finish mimicked what was observed in late 2011, as industrial companies made an effort to complete transactions by year-end. The so-called “Fiscal Cliff” probably helped motivate several of these companies to close transactions by the end of 2012, in an effort to avoid any possible tax consequences in 2013. The overall vacancy rate for industrial properties fell to 9.2%, down from 9.5% in the 3rd quarter. Average rental rates came in at $3.37 per square foot overall, $3.22 per square foot for distribution properties and $7.50 per square foot for Flex properties. NORTHERN KENTUCKY The Northern Kentucky submarkets stole the show for the year, posting 1,048,092 square feet of positive absorption for all four quarters combined. In the 4th quarter, net absorption totaled 230,859 square feet. The Airport Submarket was the leader in Northern Kentucky, where the majority of this absorption occurred. Rental rates in the Airport and the Florence submarkets both averaged $3.42 and $3.50 per square foot respectively, while the Covington market was slightly higher at $3.93 per square foot. SUBURBAN OHIO SUBMARKETS On the northern side of the river, the Ohio submarkets made up some ground for the past three quarters, posting 625,505 square feet of positive absorption in the final quarter of the year. Year-to- date, the Ohio submarkets produced 423,615 square feet of negative absorption, far short of Northern Kentucky’s year-end totals, but much better than originally forecasted. For the year, most of the negative absorption was tied to the Tri-County and I-75 submarkets, which produced over two-thirds of this amount. Avon Products in Tri-County was the main culprit, as it vacated 750,000 square feet of space at 175 Progress Drive. Rental rates in the Ohio submarkets ranged from $2.95 per square foot in Hamilton, to $5.34 per square foot in the Western Corridor, with an overall Suburban Ohio rental rate of $3.34 per square foot. CONSTRUCTION On the construction side, the industrial market has been very quiet, with the exception of some smaller build-to-suit projects. Supply of industrial product is very low, as institutional developers have yet to find an appetite for a new speculative development in our area. This is expected to change in the near term, as the demand for bulk product picks up in 2013. If Greater Cincinnati is going to compete as one of the major industrial markets in the Midwest, product will need to be developed in order to handle the expected growth we are predicting in the coming year. 9.0% 9.5% 10.0% 10.5% 4Q10 1Q11 2Q11 3Q11 4Q11 1Q12 2Q12 3Q12 4Q12
- 2. Transactions are believed to be accurate but not guaranteed. UPDATE YTD Transactions SALES PROPERTY SUBMARKET TENANT/BUYER SIZE TYPE 5568 West Chester Road Tri-County/Union Centre Corner Deal Title Holder LP 970,000 Sale Corridor 75 Industrial Park I-75 North Corridor IDI 652,000 Sale 3997 Bach Buxton Road East DFL Group 435,600 Sale 8752 Jacquemin Drive Tri-County/Union Centre General Motors 394,480 Sale 11520 Mosteller Road Tri-County/Union Centre Trident Capital 358,386 Sale 2725 Henkle Drive I-71 North Corridor PFB America Real Estate 346,737 Sale Former Jim Beam Packaging Plant Central/Midtown Edward Paul 278,000 Sale 760 Fujitec Drive I-71 North Corridor Green Bay Packaging 268,614 Sale 1701 Made Industrial Drive Monroe/Middletown Metal Matic Inc. 234,500 Sale 7100 Dixie Highway Tri-County/Union Centre R&R Honeymoon 226,000 Sale 201 Milford Parkway East Lee Holdings 207,040 Sale 110 Industrial Lane West Maas Enterprises Ltd. 161,400 Sale 7585 Empire Drive NKY Trident Capital 148,365 Sale 7910-7920 Kentucky Dr. NKY Corken Steel 131,329 Sale 5 Floridian Drive NKY FloCres Properties 114,900 Sale 7435 Industrial Road NKY BBMJG Properties 107,806 Sale Century Business & Service Center Tri-County/Union Centre RGW Development 82,775 Sale 6900 Steger Drive Central/Midtown Jet Machine & Manufacturing 80,000 Sale 620 Shepherd Lane Lockland/Evendale Chromaflo Lockland Holdings LLC 71,541 Sale LEASES PROPERTY SUBMARKET TENANT/BUYER SIZE TYPE 10650 Toebben Drive NKY Cengage 835,000 Lease Skyport #3 NKY Sun Chemical 354,371 Lease World Park Bldg #6 Tri-County/Union Centre Valvoline 321,464 Lease Airpark International DC #1 NKY Schwarz Paper 316,000 Lease 1100 Burlington Pike NKY Verst Group Logistics 290,521 Lease 100 Precision Drive NKY GSI 234,000 Lease Parkwest International N2 NKY iHerb 211,200 Lease 3720 Langley Drive NKY Levi Strauss & Co. 151,444 Lease 2100-2150 Global Way NKY Wayfare LLC 150,095 Lease 375 Northpointe Dr. Hamilton/Fairfield Prestige Display & Packing 123,524 Lease Skyport #3 NKY Heidelberg Distributing 118,629 Lease 2265 Progress Drive NKY LeanCor Supply Chain 106,920 Lease 5151 Fischer Place Central/Midtown Cadbury Schweppes Bottling Group 93,000 Lease 1499 Jamike Ave. NKY Close the Loop 81,200 Lease 2101-2301 E Kemper Road Blue Ash Interworkings 75,591 Lease NorthPark Business Center I Tri-County/Union Centre LEM Products 75,000 Lease 3720 Langley Drive NKY GES/Viad 72,000 Lease 5141 Fischer Place Central/Midtown Modern Builders Supply 69,300 Lease 7850 Foundation Drive NKY Mazak 63,656 Lease 7130 New Buffington Road NKY KT Warehouse Solutions 63,520 Lease Constitution Drive I-75 North Corridor Guest Supply 62,464 Lease World Park Building 9 Tri-County/Union Centre Rite Rug 60,000 Lease THE KNOWLEDGE REPORT | Q4 2012 | INDUSTRIAL | CINCINNATI P. 2 | COLLIERS INTERNATIONAL
- 3. SUBMARKET Total Inventory Total Vacant SF Vacancy Rate Quarterly Absorption YTD Absorption Avg. Rate Airport 27,423,161 1,807,030 6.6% 605,742 1,147,788 $3.42 Blue Ash 12,787,682 892,684 7.0% 59,650 262,528 $3.88 Kenton/Campbell County 5,845,329 186,942 3.2% (67,726) (86,042) $3.95 Central/Midtown 47,423,206 3,679,413 7.8% 384,042 366,185 $3.40 Covington 8,338,550 521,262 6.3% (111,019) (87,012) $3.93 Eastern Corridor 12,650,115 2,962,212 23.4% (23,193) (183,135) $3.67 Florence 24,447,909 880,205 3.6% (196,138) 73,358 $3.50 Hamilton 7,972,378 743,200 9.3% (25,904) (201,831) $2.95 I-71 North Corridor 10,980,157 1,406,674 12.8% 243,465 204,818 $3.29 Lockland/Evendale 20,650,536 701,189 3.4% 370,902 200,344 $2.97 I-75 North Corridor 21,991,003 2,519,167 11.5% (326,154) (570,238) $3.60 Tri-County/Union Centre 66,964,416 8,733,804 13.0% (99,923) (543,906) $3.06 Western Corridor 7,126,143 277,896 3.9% 42,620 41,620 $5.34 MARKET TOTALS 274,600,585 25,311,678 9.2% 856,364 624,477 $3.37 INDUSTRIAL SUBMARKET DATA AVG. ASKING RATES (PER SF-FULL SERVICE GROSS) $2 $3 $4 $5 $6 $7 $8 4Q10 1Q11 2Q11 3Q11 4Q11 1Q12 2Q12 3Q12 4Q12 Flex General Distribution QUARTERLY NET ABSORPTION SquareFeet -1,000,000 -500,000 0 500,000 1,000,000 1,500,000 4Q10 1Q11 2Q11 3Q11 4Q11 1Q12 2Q12 3Q12 4Q12 FORECAST Continuing the wave of activity in the 4th quarter, 2013 should be a year in which the industrial market continues to make significant gains. As the direction of the national economy continues to take shape, we expect the industrial market to take off in the coming year. Manufacturing is increasing, employment is starting to improve and the supply of industrial product is diminishing. These three factors should make for a year of strong positive absorption in 2013. THE KNOWLEDGE REPORT | Q4 2012 | INDUSTRIAL | CINCINNATI COLLIERS INTERNATIONAL | P. 3
- 4. CEO | PRINCIPAL: Shenan P. Murphy, CCIM +1 513 721 4200 Colliers International statistics are audited annually and may result in revisions to previously reported quarterly and final year-end figures Colliers International | Greater Cincinnati 425 Walnut Street, Suite 1200 Cincinnati, OH 45202 Industrial Services | Greater Cincinnati INT’L AIRPORT I-75 NORTH TRI-COUNTY/ UNION CENTRE I-71 NORTH BLUE ASHLOCKLAND/ EVENDALE CENTRAL/ MIDTOWN EASTERN CORRIDOR WESTERN CORRIDOR KENTON CAMPBELL COUNTY COVINGTON AIRPORT FLORENCE HAMILTON www.colliers.com/cincinnati Chuck A. Ackerman, CCIM, SIOR Brokerage Senior Vice President chuck.ackerman@colliers.com DIR +1 513 562 2266 John B. Gartner, III, SIOR Brokerage Senior Vice President Principal | Cincinnati john.gartner@colliers.com DIR +1 513 562 2207 William K. Keefer, SIOR Brokerage Senior Vice President Principal | Cincinnati bill.keefer@colliers.com DIR +1 513 562 2235 Erin M. Casey, GA-C, MICP™ Brokerage Vice President erin.casey@colliers.com DIR +1 513 562 2225 Michael E. Daly, SIOR Brokerage Senior Vice President Principal | Cincinnati mike.daly@colliers.com DIR +1 513 562 2206 522 offices in 62 countries on 6 continents United States: 147 Canada: 37 Latin America: 19 Asia: 36 ANZ: 165 EMEA: 118 • $1.8 billion in annual revenue • 1.25 billion square feet under management • Over 12,300 professionals THE KNOWLEDGE REPORT | Q4 2012 | INDUSTRIAL | CINCINNATI