The document summarizes office market conditions in North America in Q3 2011. It reports that:
- U.S. office markets saw modest growth with slightly higher demand and a small drop in vacancy rates. However, the anticipated recovery remained limited as businesses were reluctant to take on more space due to economic uncertainty.
- Canadian markets fared better than the U.S. due to a slightly stronger economy and job market.
- Going forward, both the U.S. and Canadian economies are expected to remain sluggish with little prospect of increased demand for office space given global economic challenges. The U.S. should avoid recession but growth will likely be modest around 1-2% annually.
Call Girls Jp Nagar Just Call 👗 7737669865 👗 Top Class Call Girl Service Bang...
US Office HIghlights Q3 2011
1. HIGHLIGHTS
NORTH AMERICA
www.colliers.com
Q3 2011 | Office
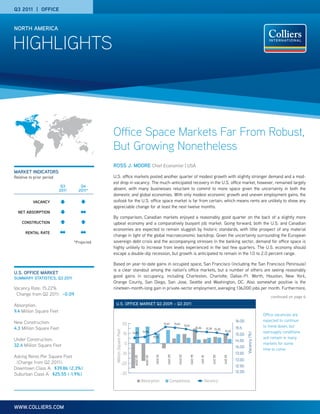
Ross J. Moore Chief Economist | USA
U.S. office markets posted another quarter of modest growth with slightly stronger demand and a mod-
est drop in vacancy. The much-anticipated recovery in the U.S. office market, however, remained largely
absent, with many businesses reluctant to commit to more space given the uncertainty in both the
domestic and global economies. With only modest economic growth and uneven employment gains, the
outlook for the U.S. office space market is far from certain, which means rents are unlikely to show any
appreciable change for at least the next twelve months.
By comparison, Canadian markets enjoyed a reasonably good quarter on the back of a slightly more
upbeat economy and a comparatively buoyant job market. Going forward, both the U.S. and Canadian
economies are expected to remain sluggish by historic standards, with little prospect of any material
change in light of the global macroeconomic backdrop. Given the uncertainty surrounding the European
sovereign debt crisis and the accompanying stresses in the banking sector, demand for office space is
highly unlikely to increase from levels experienced in the last few quarters. The U.S. economy should
escape a double-dip recession, but growth is anticipated to remain in the 1.0 to 2.0 percent range.
Based on year-to-date gains in occupied space, San Francisco (including the San Francisco Peninsula)
is a clear standout among the nation’s office markets, but a number of others are seeing reasonably
good gains in occupancy, including Charleston, Charlotte, Dallas–Ft. Worth, Houston, New York,
Orange County, San Diego, San Jose, Seattle and Washington, DC. Also somewhat positive is the
nineteen-month-long gain in private-sector employment, averaging 136,000 jobs per month. Furthermore,
Office vacancies are
expected to continue
to trend down, but
oversupply conditions
will remain in many
markets for some
time to come.
market indicators
Relative to prior period
u.s. Office market
Summary Statistics, Q3 2011
Office Space Markets Far From Robust,
But Growing Nonetheless
Q3
2011
Q4
2011*
VACANCY
NET ABSORPTION
construction
rental rate
*Projected
U.S. Office MARKET Q3 2009 – Q3 2011
Q32011
Q22011
Q12011
Q42010
Q32010
Q22010
Q12010
Absorption Completions Vacancy
MillionSquareFeet
Vacancy(%)
12.00
12.50
13.00
13.50
14.00
14.50
15.00
15.5
16.00
14.98
15.15
15.67 15.64
15.22
15.46 15.39
15.61
15.30
14.85
-30
-20
-10
0
10
20
Q32009
Q22009
Vacancy Rate: 15.22%
Change from Q2 2011: –0.09
Absorption:
9.4 Million Square Feet
New Construction:
4.3 Million Square Feet
Under Construction:
32.4 Million Square Feet
Asking Rents Per Square Foot
(Change from Q2 2011):
Downtown Class A: $39.86 (2.3%)
Suburban Class A: $25.55 (-1.9%)
continued on page 6
5. highlights | Q3 2011 | office | north America
Colliers International | p. 5
UNITED STATES | DOWNTOWN OFFICE | Class A
MARKET
EXISTING
INVENTORY (SF)
Sept 30, 2011
VACANCY
RATE (%)
June 30, 2011
VACANCY
RATE (%)
Sept 30, 2011
ABSORPTION
Q3 2011
(SF)
ABSORPTION
YTD 2011
(SF)
AVERAGE ANNUAL
QUOTED RENT
(USD PsF)
Sept 30, 2011
QUARTERLY
CHANGE IN
RENT
(%)
ANNUAL
CHANGE IN
RENT
(%)
Detroit, MI 11,416,000 14.74 16.03 (136,000) 150,000 22.50 (0.4) (1.0)
Grand Rapids, MI 1,567,000 20.21 22.34 0 5,000 21.00 5.2
Indianapolis, IN 9,776,000 12.17 12.55 (37,000) 34,000 19.40 1.5
Kansas City, MO 9,889,000 18.38 17.82 55,000 238,000 19.60 0.5 (6.1)
Minneapolis, MN 14,090,000 13.11 12.43 52,000 106,000 15.20 4.3
Omaha, NE 3,418,000 4.32 4.32 0 (25,000) 19.10 1.5
St. Louis, MO 10,755,000 14.73 15.91 (188,000) (203,000) 18.10 0.5 (5.0)
St. Paul, MN 3,433,000 8.86 8.99 (4,000) 12,000 13.40 (5.3)
MIDWEST TOTAL/AVERAGE 150,727,000 14.83 14.88 (140,000) 741,000 24.76
west
Bakersfield, CA 700,000 5.50 4.99 4,000 7,000 17.40 0.0 0.0
Boise, ID 2,038,000 5.75 6.46 (14,000) (27,000) 18.60 3.3 3.3
Denver, CO 20,569,000 11.99 13.01 (210,000) (87,000) 27.80 1.1 5.9
Fresno, CA 1,058,000 12.87 11.50 15,000 (22,000) 24.60 0.0 0.0
Honolulu, HI 4,709,000 13.27 14.21 (44,000) (93,000) 35.30 (0.3) (1.0)
Las Vegas, NV 808,000 11.26 9.12 36,000 3,000 33.70 4.5 (3.4)
Los Angeles, CA 17,734,000 15.63 14.98 116,000 (51,000) 38.50 0.0 (1.2)
Oakland, CA 10,198,000 10.49 11.20 (72,000) (127,000) 30.70 0.0 (1.2)
Phoenix, AZ 9,555,000 22.25 19.87 227,000 160,000 23.70 (0.6) (16.3)
Pleasanton/Walnut Creek, CA 7,950,000 19.36 16.94 193,000 116,000 27.60 5.5 5.5
Portland, OR 13,157,000 7.17 6.89 95,000 217,000 24.90 0.5 2.3
Reno, NV 548,000 21.10 17.32 31,000 100,000 23.30 3.2 (1.0)
Sacramento, CA 9,062,000 9.68 9.59 148,000 179,000 32.10 (0.7) (1.2)
San Diego, CA 7,254,000 18.89 17.36 111,000 (16,000) 28.30 (1.3) (3.3)
San Francisco, CA 52,333,000 14.01 12.66 656,000 1,315,000 38.40 4.0 6.0
San Jose/Silicon Valley, CA 3,365,000 30.91 31.60 (20,000) (69,000) 32.00 0.4 (7.6)
Seattle/Puget Sound, WA 32,337,000 18.33 17.22 359,000 660,000 30.50 3.0 7.0
Stockton, CA 2,774,000 22.19 20.25 14,000 (90,000) 20.50 (5.0) 11.8
WEST TOTAL/AVERAGE 196,150,000 14.90 14.12 1,643,000 2,176,000 32.02
U.S. TOTAL/AVERAGE 1,022,893,000 14.35 14.46 443,000 8,068,000 39.90 2.26 2.36
27.40 1.10 -3.32
weighted
equal
6. p. 6 | Colliers International
highlights | Q3 2011 | office | north America
office-using employment was relatively robust during the JulySeptember
period, with professional and business employment in particular up 3.4 percent
year-over-year (September).
U.S. office vacancies continue to drift lower. The U.S. national office vacancy
rate fell slightly during the July to September period, shifting nine basis points
lower (100 basis points equals one percent) to finish the quarter at 15.22
percent. During the third quarter, downtown vacancies increased six basis
points to register 13.90 percent at quarter end, while suburban office vacancies
dropped 16 basis points to average 15.87 percent. Over the past 12 months, the
U.S. national office vacancy rate has fallen 39 basis points. In the third quarter,
the flight to quality was particularly evident in Class A suburban markets
where vacancies shrank 50 basis points. Canadian office vacancy rates were
also mixed with the national central business district (CBD) vacancy rate
falling 54 basis points to 5.82 percent while suburban vacancies increased
16 basis points to 9.03 percent.
Office absorption positive for sixth the consecutive quarter. The U.S. office
market registered a sixth consecutive quarter of rising occupancy. Third-
quarter absorption came in at 9.4 million square feet (MSF). The composition
of this quarter’s absorption was highly skewed to suburban markets, whereas
last quarter two-thirds of total absorption was in downtown markets. Standout
markets in the third quarter included Dallas-Ft. Worth, Houston, Midtown
Manhattan, Orange County, Raleigh, Sacramento, San Francisco, San Diego,
Silicon Valley, suburban Detroit and suburban Washington, DC. Continuing a
trend seen over the past few quarters, Class A buildings continued to attract
“move-up” tenants: in particular, suburban Class A absorption totaled
8.0 MSF, or just over 85 percent of overall absorption. Canadian markets also
recorded an increase in occupied space during the third quarter, with absorp-
tion totaling 4.7 MSF. This was a healthy increase from the 3.6 MSF recorded
in the second quarter.
Suburban rents take a further down-leg, CBD rents rise slightly. After small
decreases in the second quarter, CBD rents posted a modest increase and
suburban rents drifted lower in the most recent three-month period. Third-
quarter data shows Class A CBD rents increased 2.3 percent to average $39.86
per square foot. Class A suburban rents moved lower, dropping 1.9 percent to
average $23.55 per square foot. Of the 60 downtown markets tracked, 33 saw
rents decrease, 20 saw rents increase and seven held steady. In the 60 sub-
urban markets, 29 markets saw rents drop, 24 rose and seven held steady.
Canadian downtown office rents moved substantially higher during the third
quarter, with Class A CBD rents increasing 6.1 percent while suburban Class
A rents increased 1.9 percent.
Office construction remains at record-low levels. Third-quarter office com-
pletions totaled just 4.3 MSF—a modest drop from the second quarter when
5.7 MSF were brought online—leaving year-to-date new supply at 15.5 MSF.
Construction underway increased by just 2.0 MSF relative to the second quar-
ter, with 32.4 MSF in various stages of development. Construction activity
remains exceptionally low by historic standards, and well below the cyclical
high reached in the second quarter of 2008 when 121 MSF was underway.
The Canadian office market added a modest level of new construction during
the third quarter, with the completion of 1.7 MSF square feet with another 7.3
MSF underway.
Office Space Markets Far From Robust,
But Growing Nonetheless
Continued from page 1
MonthtoMonthChange,thousands
2010 2011
-20
0
20
40
60
80
100
Jul-11Apr-10Jan-11Oct-10Jul-10Apr-10Jan-10
EMPLOYMENT, PROFESSIONAL & BUSINESS SERVICES
Philadelphia
Houston
Washington, DC
Chicago
Boston
Seattle
San Francisco
Midtown Manhattan
0 500000 1000000 1500000 2000000
aBSORPTION (SF) | sELECT downtown MARKETS | q3 2011
0 200,000 400,000 600,000 800,000
Northern New Jersey
Raleigh/Durham
Denver
San Diego
Raleigh/Durham
San Jose/Silicon Valley
Houston
Dallas
aBSORPTION (SF) | sELECT SUBURBAN MARKETS | q3 2011
Source: U.S. Bureau of Labor Statistics
12. p. 12 | Colliers International
highlights | Q3 2011 | office | north America
Inventory – Includes all existing multi- or single-
tenant leased and owner-occupied office properties
greater than or equal to 10,000 square feet (net
rentable area). In some larger markets this minimum
size threshold may vary up to 50,000 square feet.
Does not include medical or government buildings.
Vacancy Rate – Percentage of total inventory
physically vacant as at the survey date including
direct vacant and sublease space.
Absorption – Net change in physically occupied
space over a given period of time.
New Supply – Includes completed speculative and
build-to-suit construction. New supply quoted on a
net basis after any demolitions or conversions.
Annual Quoted Rent – Includes all costs associated
with occupying a full floor in the mid-rise portion of
a Class A building inclusive of taxes, insurance,
maintenance, janitorial and utilities (electricity
surcharges added where applicable). All office rents
in this report are quoted on an annual, gross per
square foot basis. Rent calculations do not include
sublease space.
Cap Rate – (Or going-in cap rate) Capitalization
rates in this survey are based on multi-tenant
institutional grade buildings fully leased at market
rents. Cap rates are calculated by dividing net
operating income (NOI) by purchase price.
Note: SF = square feet
PSF = per square foot
CBD = central business district
Glossary
CANADA | SUBURBAN OFFICE | ALL INVENTORY
MARKET
EXISTING
INVENTORY (SF)
sept 30, 2011
NEW SUPPLY
Q3 2011
(SF)
UNDER
CONSTRUCTION
(SF)
VACANCY
RATE (%)
sept 30, 2011
VACANCY
RATE (%)
June 30, 2011
ABSORPTION
Q3 2011
(SF)
ABSORPTION
YTD 2011
(SF)
Calgary, AB 23,437,000 0 732,000 9.19 11.01 (470,000) 152,000
Edmonton, AB 8,940,000 0 40,000 13.31 13.48
(15,000)
167,000
Guelph, ON 1,374,000 17,000 0 3.79 4.82 2,000 3,000
Halifax, NS 6,388,000 53,000 90,000 10.41 9.43 89,000 127,000
Montreal, QC 23,771,000 150,000 0 9.41 9.55 99,000 186,000
Ottawa, ON 20,956,000 318,000 0 7.74 8.02 234,000 (143,000)
Regina, SK 659,000 0 0 0.14 0.14 0 3,000
Toronto, ON 68,351,000 138,000 727,000 7.64 7.10 1,085,000 1,992,000
Vancouver, BC 27,273,000 0 785,000 10.75 10.59 44,000 138,000
Victoria, BC 3,573,000 0 113,000 10.18 8.54 0 66,000
Waterloo Region, ON 6,316,000 332,000 175,000 7.71 12.55 1,000 58,000
CANADA TOTAL/AVERAGE 191,037,000 1,008,000 2,662,000 8.86 9.03 1,069,000 2,749,000
CANADA | SUBURBAN office | class a
MARKET
EXISTING
INVENTORY (SF)
Sept 30, 2011
VACANCY
RATE (%)
sept 30,
2011
VACANCY
RATE (%)
June 30,
2011
ABSORPTION
Q3 2011
(SF)
ABSORPTION
YTD 2011
(SF)
AVERAGE ANNUAL
QUOTED RENT
(CAD PSF)
Sept 30, 2011
QUARTERLY
CHANGE
IN RENT
(%)
ANNUAL
CHANGE
IN RENT
(%)
Calgary, AB 10,829,000 7.94 10.63 (291,000) 349,000 40.00 5.3 23.1
Guelph, ON 838,000 0.86 3.20 (2,000) (7,000) 26.00 7.1
Halifax, NS 2,675,000 8.52 7.64 26,000 32,000 29.10 4.0 8.9
Montreal, QC 13,336,000 7.77 7.87 88,000 198,000 30.00 0.0 25.0
Ottawa, ON 11,944,000 7.80 8.04 264,000 276,000 30.00 0.2 (0.2)
Regina, SK 659,000 0.14 0.14 0 3,000 28.50 0.0 16.3
Toronto, ON 30,652,000 8.81 7.35 650,000 1,075,000 30.00 0.3 (4.9)
Vancouver, BC 13,132,000 13.07 10.88 287,000 350,000 38.30 0.0 4.3
Victoria, BC 817,000 8.67 8.93 0 (2,000) 40.00 0.0 21.2
Waterloo Region, ON 2,745,000 8.42 16.85 72,000 102,000 23.70 8.2 (8.9)
CANADA TOTAL/AVERAGE 87,628,000 8.89 8.68 1,093,000 2,377,000 32.30 1.91 4.34
31.60 2.18 6.34
weighted
equal