
Recomendados
Recomendados
Más contenido relacionado
La actualidad más candente
La actualidad más candente (13)
Destacado
Similar a National Voter Registration Act: A Fact Sheet
Similar a National Voter Registration Act: A Fact Sheet (20)
Más de coryhelene
Más de coryhelene (20)
Último
Último (20)
National Voter Registration Act: A Fact Sheet
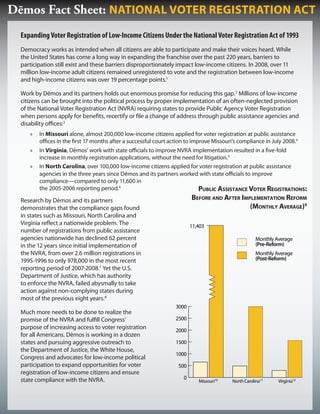
- 1. Dēmos Fact Sheet: NATIONAL VOTER REGISTRATION ACT Expanding Voter Registration of Low-Income Citizens Under the National Voter Registration Act of 1993 Democracy works as intended when all citizens are able to participate and make their voices heard. While the United States has come a long way in expanding the franchise over the past 220 years, barriers to participation still exist and these barriers disproportionately impact low-income citizens. In 2008, over 11 million low-income adult citizens remained unregistered to vote and the registration between low-income and high-income citizens was over 19 percentage points.1 Work by Dēmos and its partners holds out enormous promise for reducing this gap.2 Millions of low-income citizens can be brought into the political process by proper implementation of an often-neglected provision of the National Voter Registration Act (NVRA) requiring states to provide Public Agency Voter Registration when persons apply for benefits, recertify or file a change of address through public assistance agencies and disability offices:3 » In Missouri alone, almost 200,000 low-income citizens applied for voter registration at public assistance offices in the first 17 months after a successful court action to improve Missouri’s compliance in July 2008.4 » In Virginia, Dēmos’ work with state officials to improve NVRA implementation resulted in a five-fold increase in monthly registration applications, without the need for litigation.5 » In North Carolina, over 100,000 low-income citizens applied for voter registration at public assistance agencies in the three years since Dēmos and its partners worked with state officials to improve compliance—compared to only 11,600 in the 2005-2006 reporting period.6 Public AssistAnce Voter registrAtions: Research by Dēmos and its partners before And After imPlementAtion reform demonstrates that the compliance gaps found (monthly AVerAge)9 in states such as Missouri, North Carolina and Virginia reflect a nationwide problem. The 11,403 number of registrations from public assistance agencies nationwide has declined 62 percent Monthly Average in the 12 years since initial implementation of (Pre-Reform) the NVRA, from over 2.6 million registrations in Monthly Average 1995-1996 to only 978,000 in the most recent (Post-Reform) reporting period of 2007-2008.7 Yet the U.S. Department of Justice, which has authority to enforce the NVRA, failed abysmally to take action against non-complying states during most of the previous eight years.8 3000 Much more needs to be done to realize the promise of the NVRA and fulfill Congress’ 2500 purpose of increasing access to voter registration 2000 for all Americans. Dēmos is working in a dozen states and pursuing aggressive outreach to 1500 the Department of Justice, the White House, 1000 Congress and advocates for low-income political participation to expand opportunities for voter 500 registration of low-income citizens and ensure state compliance with the NVRA. 0 Missouri10 North Carolina11 Virginia12
- 2. Endnotes 1. U.S. Census Bureau, Current Population Survey November 2008 Voting and Registration Supplement, analysis by Dēmos. 2. See Scott Novakowski, Toward An Equal Electorate: Five States’ Gains Under the National Voter Registration Act (October 2008), available at http://www.demos.org/pubs/nvra_2.pdf. 3. 42 U.S.C. § 1973gg-5. 4. Data provided by Missouri Department of Social Services pursuant to compliance plan in ACORN v. Scott, No. 2:08-cv-04084 (W.D. Mo.). 5. Data provided by Virginia State Board of Elections. See also Allegra Chapman and Scott Novakowski, Expanding Voter Registration for Low-Income Virginians: The Impact of the National Voter Registration Act (October 2008), available at http://www.demos.org/pubs/ NVRA_VA.pdf. 6. Data provided by North Carolina State Board of Elections. See also Lisa J. Danetz and Scott Novakowski, Expanding Voter Registration for Low-Income: How North Carolina is Realizing the Promise of the National Voter Registration Act (Updated April 2008), available at http:// www.demos.org/pubs/NVRAupdated.pdf. 7. Douglas R. Hess and Scott Novakowski, Unequal Access: Neglecting the National Voter Registration Act, 1995-2006 (February 2008), available at http://www.demos.org/pub1531.cfm and U.S. Election Assistance Commission, The Impact of the National Voter Registration Act of 1993 on the Administration of Elections for Federal Offices, 2007-2008, available at http://www.eac.gov/program-areas/ research-resources-and-reports/completed-research-and-reports/the-impact-of-the-national-voter-registration-act-on-federal- elections-2007-2008. 8. Letter dated March 16, 2009 from Miles Rapoport and Brenda Wright to Hon. Charles E. Schumer and Hon. Bob Bennett, United States Senate, Committee on Rules and Administration, available at http://www.demos.org/pubs/Demos%20letter%20to%20Senate%20 Rules%20Committee%203%2016%2009.pdf. 9. All pre-reform data is taken from the U.S. Election Assistance Commission, The Impact of the National Voter Registration Act of 1993 on the Administration of Elections for Federal Office, 2005-2006, available at http://www.eac.gov/program-areas/research-resources-and- reports/copy_of_docs/the-impact-of-the-national-voter-registration-act-on-federal-elections-2005-2006/attachment_download/file. Because implementation reform was adopted at different times in each state, the time periods included in the post-reform data vary by state. See endnotes 10, 11 and 12. Post reform data was provided by the Missouri Department of Social Services, the North Carolina State Board of Elections, and the Virginia State Board of Elections. 10. Missouri’s public assistance agencies registered an average of 649 voters per month during 2005-2006. After reforms were implemented on August 16, 2008, through January 2010, the Department of Social Services alone registered an average of 11,403 voters per month. 11. North Carolina’s public assistance agencies registered an average of 484 voters per month during 2005-2006. In the post-reform period of February 2007 through November 2009, the state’s public assistance agencies registered an average of 2,995 voters per month. 12. Virginia’s public assistance agencies registered an average of 293 voters per month during 2005-2006. Since reforms were adopted in June 2008 through December 2009, the state’s public assistance agencies have registered an average of 1,558 voters per month. For more information, see www.demos.org or contact: Scott Novakowski, Senior Policy Analyst, Democracy Program, snovakowski@demos.org Brenda Wright, Director, Democracy Program, bwright@demos.org Dēmos Fact Sheet: NATIONAL VOTER REGISTRATION ACT