SlideShare una empresa de Scribd logo
1 de 8
Descargar para leer sin conexión
Industry, trade and services                                                         Statistics in focus
                                                                                     66/2011
Author: Heidi SEYBERT


Internet use in households and by individuals in 2011
Two thirds of Europeans used the internet on average at least
once a week, one quarter have never used it

The internet has become important for daily                           the Survey on ICT (information and
life, education, work and participation in                            communication technology) usage in households
society. A large majority of households and                           and by individuals and takes a closer look at the
individuals make use of it today. Nevertheless                        activities done by internet users.
there are significant differences in access and
                                                                      More than half of the individuals (56%) in the EU
usage between countries and socio-economic
                                                                      used the internet everyday or almost every day
groups. About a quarter of the EU-27
                                                                      (figure 1). Two out of three individuals used the
population aged 16 to 74 years old have never
                                                                      internet at least once a week (68%). The shares for
used the internet. Among those who used it,
                                                                      individuals who used the internet regularly were
most internet users have searched for
                                                                      above 80% in six Member States: Denmark,
information and news, consulted wikis,
                                                                      Luxembourg, the Netherlands, Finland, Sweden
participated in social networks and bought
                                                                      and the United Kingdom. The shares were below
products online. This issue of Statistics in Focus
                                                                      60% in seven Member States: Bulgaria, Greece,
provides an overview of the latest results from
                                                                      Italy, Cyprus, Poland, Portugal and Romania.

Figure 1: Individuals who used the internet at least once a week, 2011 (% of individuals)

   100

     90

     80

     70

     60

     50

     40

     30

     20

     10

      0
          S N D LU F U BE D AT F E S
           E L K    I K    E    R E K IE E - LV H M
                                          U      U T S C E LT P C
                                                      I Z S    L Y IT P E B R
                                                                       T L G O
                                         27

                                 Every day or almost every day           A least once a week, ex
                                                                          t                     cluding daily


Source: Eurostat (online data codes : isoc_bdek_di, isoc_ci_ifp_fu)
Nearly three quarters of EU households had access to the internet in 2011
                                                                                 There were also significant disparities in broadband
Figure 2: Internet access and broadband                                          take-up by households between countries. The
internet connections in households, EU27 (%)                                     percentages were well below 50% in Bulgaria,
                                                                                 Greece and Romania. However, several Member
 100
                                                                                 States showed a growth of 30 percentage points or
                                                                           73
    80
                                                65
                                                                   70            more compared to 2007. The growth was highest in
                                  60                                        68
    60   49
                   54
                                                56
                                                                   61            Greece at 38 percentage points, followed by
                                  49
                   42                                                            Cyprus (36 p.p.), the Czech Republic (35 p.p.),
    40
          30                                                                     Malta and Poland (both 31 p.p.).
    20


    0                                                                            Table 1: Internet access and broadband internet
         2006     2007          2008           2009                2010   2011
                                                                                 connections in households (%)
                         Internet access   Broadband connections                                       Internet connections in households              Broadband internet connections

                                                                                                 2007                2009              2011     2007               2009                 2011

                                                                                     EU-27        54                  65                73      42                  56                  68
Source: Eurostat (online data code : isoc_bde15b_h)
                                                                                     BE           60                  67                77      56                  63                  74
                                                                                     BG           19                  30                45      15                  26                  40
                                                                                     CZ           35                  54                67      28                  49                  63
                                                                                     DK           78                  83                90      70                  76                  84
The proportion of households in the EU with                                          DE           71                  79                83      50                  65                  78
access to the internet reached 73% in 2011,                                          EE           53                  63                71      48                  62                  66

representing an increase of 24 percentage points                                     IE           57                  67                78      31                  54                  65
                                                                                     EL           25                  38                50       7                  33                  45
compared with 2006 (figure 2).                                                       ES           45                  54                64      39                  51                  62
                                                                                     FR           49                  63                76      43                  57                  70
Broadband internet access enables higher speed                                       IT           43                  53                62      25                  39                  52

when browsing and performing activities over the                                     CY           39                  53                57      20                  47                  56
                                                                                     LV           51                  58                64      32                  50                  59
internet. For example, downloading an article or                                     LT           44                  60                62      34                  50                  57
software from a website can take a few seconds                                       LU           75                  87                91      58                  71                  68

with broadband and several minutes without a                                         HU           38                  55                65      33                  51                  61
                                                                                     MT           54                  64                75      44                  63                  75
broadband internet connection.                                                       NL           83                  90                94      74                  77                  83
                                                                                     AT           60                  70                75      46                  58                  72
In 2011, more than two thirds (68%) of households                                    PL           41                  59                67      30                  51                  61

in the EU had used broadband connections,                                            PT           40                  48                58      30                  46                  57
                                                                                     RO           22                  38                47       8                  24                  31
representing a notable increase of 26 percentage                                     SI           58                  64                73      44                  56                  67
points (p.p.) compared with 2007 and of 38 p.p.                                      SK           46                  62                71      27                  42                  55

compared with 2006. Today most households with                                       FI           69                  78                84      63                  74                  81
                                                                                     SE           79                  86                91      67                  79                  86
internet access have broadband.                                                      UK1          67                  77                85      57                  69                  83
                                                                                     IS           84                  90                93      76                  87                  93
The share of internet access varied among Member                                     NO           78                  86                92      67                  78                  80

States, ranging from 90% of households and above                                     HR           41                  50                61      23                  39                  56
                                                                                     MK           :                   42                    :    :                  34                   :
in the Netherlands, Luxembourg, Sweden and                                           TR           20                  30                43      17                  26                  39
Denmark to 50% and below in Bulgaria, Romania                                        RS           26                  37                    :    7                  23                   :

and Greece (table 1).                                                            1
                                                                                     UK data for 2009 and 2011 include estimates for Northern Ireland
                                                                                 Source: Eurostat (online data code: isoc_bde15b_h)


Nine in ten individuals aged 16-24 used the internet regularly
In 2011, 71% of individuals in the EU27 used the                                 of the Digital Agenda for Europe: By 2015, 75% of
internet at least once in the last three months prior                            the population should have used the internet
to the survey. More than two thirds of individuals                               regularly. The current level of use was
(68%) in the EU27 had used the internet regularly                                7 percentage points below this target. There were
(on average at least once a week), either at home, at                            significant gaps in usage ('digital divides') when
work or at any other place (table 2). This indicator                             looking at age groups and level of formal education
was included in the set of key performance targets                               (figure 3).


2                                                                                                                66/2011 — Statistics in focus
Figure 3: Individuals who used the internet on average at least once a week, by gender, age group
and level of formal education, EU27, 2011 (% of individuals)

      100
                                                                 91                                                                    92
        90

        80                                                                      76
                                 70                                                                                        71
                  68
        70                                        65

        60

        50                                                                                                   45
                                                                                              40
        40

        30

        20

        10

         0
                   All          Men           Women            16-24           25-54         55-74         Low          Medium        High
              Individuals                                      years           years         years       education     education    education


Source: Eurostat (online data code : isoc_bdek_di)


Table 2: Internet use and frequency of use by individuals, 2011 (% of individuals)
                                                   Internet users and non-users                    Frequency of use (on average)

                                       Used internet       Used internet                                          At least once a
                                                                                Never used       Every day or
                                      within the last 3   within the last 12                                      week (including
                                                                                 internet      almost every day
                                          months               months                                                daily use)

                       EU-27                 71                  73                  24                56                68
                       BE                    82                  83                  14                65                78
                       BG                    48                  51                  46                37                46
                       CZ                    70                  73                  24                41                63
                       DK                    90                  91                  7                 78                88
                       DE                    81                  83                  16                63                77
                       EE                    77                  77                  20                59                73
                       IE                    75                  77                  21                55                71
                       EL                    52                  53                  45                37                47
                       ES                    67                  69                  29                48                62
                       FR                    78                  80                  18                62                74
                       IT                    54                  57                  39                49                51
                       CY                    57                  58                  41                45                54
                       LV                    70                  72                  27                53                66
                       LT                    64                  65                  33                48                61
                       LU                    90                  91                  8                 76                86
                       HU                    68                  70                  28                56                66
                       MT                    68                  69                  30                55                66
                       NL                    91                  92                  7                 79                90
                       AT                    79                  80                  18                59                76
                       PL                    62                  65                  33                45                58
                       PT                    55                  58                  41                42                51
                       RO                    40                  44                  54                24                37
                       SI                    67                  69                  29                54                64
                       SK                    74                  78                  20                56                72
                       FI                    89                  89                  9                 76                86
                       SE                    93                  94                  5                 80                91
                       UK1                   85                  87                  11                70                81
                       IS                    95                  95                  4                 88                94
                       NO                    93                  94                  5                 82                91
                       HR                    58                  60                  39                44                55
                       TR                    40                  43                  55                26                36

1
    UK data include estimates for Northern Ireland
Source: Eurostat (online data codes : isoc_ci_ifp_iu, isoc_bde15cua)


              Statistics in focus — 66/2011                                                                                                     3
The percentage of regular internet users among                                            much as the share for the population with a low
younger persons aged 16-24 was 91% while it was                                           level of education. Differences between men and
only 40% for the age group 55-74 years. The                                               women were relatively small. Slightly more than
percentage of the population with high formal                                             two thirds of men (70%) and 65% of women used
education using the internet was more than twice as                                       the internet regularly.


One in four individuals aged 16-74 in the EU had never used the internet
                                                                                          The average annual decline was around 4
Figure 4: Individuals who have never used the                                             percentage points in the period from 2006 to 2010.
internet, EU27, 2006-2011 (% of individuals)                                              Although the rate of decline has slowed down,
                                                                                          reaching the share of not more than 15% non-users
                                                                                          set as an EU target for 2015 in the Digital Agenda
 100
                                                                                          remains possible.
    80

    60                                                                                    Large digital divides were evident when looking at
         42
    40
                      37
                                     33              30
                                                                26
                                                                                          the share of the population who have never used
                                                                             24
    20
                                                                                          the internet across Member States (figure 5). The
    0
                                                                                          highest shares of the population with no past
         2006     2007               2008           2009        2010        2011          experiences in internet use at all whether at home,
                                                                                          at work or at any other place were registered in
                                                                                          Romania (54%), Bulgaria (46%), Greece (45%),
Source: Eurostat (online data code : isoc_bdek_di)
                                                                                          Cyprus (41%) and Portugal (41%), and the lowest
                                                                                          in Sweden (5%), the Netherlands and Denmark
In the EU27, the proportion of individuals who                                            (both 7%), Luxembourg (8%) and Finland (9%).
never used the internet was 24% in 2011 (figure 4).                                       Another four Member States (Italy, Lithuania,
The proportion of non-users in the EU declined                                            Malta and Poland) showed proportions between
only by 2 percentage points over one year, from                                           30% and below 40% for the population being
26% in 2010 to 24% in 2011.                                                               excluded and without user skills regarding the
                                                                                          internet.

Figure 5: Individuals who have never used the internet, 2011 (% of individuals)

    60


    50


    40


    30


    20


    10


     0
         RO BG   EL        CY   PT        IT   LT    PL    MT   ES     SI   HU     LV   EU-   CZ   IE   EE   SK   AT   FR   DE   BE   UK   FI   LU   DK   NL   SE
                                                                                         27


Source: Eurostat (online data code : isoc_bdek_di)


4                                                                                                                 66/2011 — Statistics in focus
A majority of internet users searched for information about goods and services,
travel or health, read online news, consulted wikis and participated in social
networks
                                                                                                                           Looking at the use of such information services
Figure 6: Use of internet for obtaining
information and reading online news, EU27,
                                                                                                                           over the last few years, the use of the internet for
2009-2011 (% of internet users)                                                                                            searching product information and about travel and
                                                                                                                           accommodation remained relatively stable. More
                                                                                                                           significant increases were noticed for reading
                                                          0   10   20   30   40   50   60   70   80       90               online news and using information about health,
       Finding information about goods or services
                                                                                                                           education and training. In particular, reading online
                                                                                                                           news showed steady growth and increased by
    Use of services related to travel or travel related
                   accommodation
                                                                                                               2009
                                                                                                                           6 percentage points compared with 2010.
                 Reading online news, newspapers                                                               2010
                                                                                                               2011
                                                                                                                           Eurostat is releasing 5 new indicators on internet
              Looking for health-related information                                                                       usage in 2011 (figure 7). They are part of the set of
 Looking for information about education, training or                                                                      indicators included in the Benchmarking Digital
                    course offers
                                                                                                                           Europe Framework 2011-2015 that supports
                                                                                                                           monitoring of the Digital Agenda and covers issues
                                                                                                                           related to participation in social and professional
Source: Eurostat (online data codes : isoc_bde15cua,                                                                       networks, consulting wikis and civic or political
isoc_ci_ac_i)                                                                                                              participation.
The internet has found wide recognition as a source                                                                        In the EU27, more than half of internet users (53%)
of information by users. Nearly 80% of internet                                                                            participated in social networks. The proportion of
users searched for information about goods and                                                                             internet users who participated in professional
services for private purposes (figure 6).                                                                                  networks was 10%. A significant share of internet
More than half of internet users in the EU in the                                                                          users made use of new learning opportunities:
first quarter of 2011 read news online (56%), used                                                                         More than half of internet users (54%) consulted
services related to travel or travel related                                                                               wikis on any subject. One in five internet users
accommodation (54%) or looked for health related                                                                           stated that they read and posted opinions on civic
information (54%). Furthermore, a significant share                                                                        or political issues. One in ten internet users took
of internet users (40%) searched for information                                                                           part in online consultations or voting.
about education, training or course offers.

Figure 7: Use of internet for social and professional networking, learning, civic and political
participation, EU27, 2011 (% of internet users)


                                                                                                      0               10        20     30     40      50     60


                                                      Participating in social networks


                                          Participating in professional networks


                                                                             Consulting wikis

                    Reading and posting opinions on civic or political
                                       issues

                               Taking part in online consultations or voting


Source: Eurostat (online data code : isoc_bde15cua)


                   Statistics in focus — 66/2011                                                                                                                               5
Three in five internet users shopped online within the last twelve months
Buying over the internet (e-commerce or e-                          available goods or services finally also buy such
shopping) has become very popular in the EU.                        products online. Reasons may include the
Consumers appreciate the convenience of shopping                    preference to shop in person or trust or security
anytime and anywhere, getting better access to                      concerns. Figure 8 shows the proportions of e-
information and a broader selection of products,                    shoppers among internet users. The reference
comparing prices or obtaining opinions from other                   period of the last twelve months prior to the survey
consumers. Not all users who take advantage of                      for this indicator takes into account seasonal effects
informing themselves over the internet about                        in e-commerce.

Figure 8: Internet users who bought or ordered goods or services for private use over the internet
in the last 12 months, 2009-2011 (% of internet users)

    90

    80

    70

    60

    50

    40

    30

    20

    10

    0
         U D D SE N LU FI
          K K E    L               FR M E - IE AT BE SK P
                                       T U               L          SI C E C E H P E
                                                                        Z S Y L U T E           IT   LV LT BG RO
                                         27


                                                      2009   2010    2011


Source: Eurostat (online data code : isoc_bdek_smi)


In 2011, 58% of internet users in the EU27 have                     ranging from 13 % in Bulgaria and Romania, 25%
bought or ordered goods or services over the                        in Lithuania and 27% in Estonia, Italy and Latvia
internet for private purposes in the last 12 months,                to 82% in the United Kingdom, 77% in Denmark
compared with 57% in 2010 and 54% in 2009.                          and Germany, 75% in Sweden and 74% in the
However, the share of e-shoppers among internet                     Netherlands. Compared with 2010, Lithuania and
users varied considerably between Member States,                    Slovenia recorded the highest increases.


Three in ten internet users submitted completed web forms to public authorities
The survey collected indicators on e-government                     EU internet users have obtained information from
which covers interactions between citizens and all                  public authorities' websites within the last twelve
levels of government (local or city, regional,                      months prior to the survey and one third
national) for a) obtaining information from public                  downloaded forms. Looking at a higher level and
authorities' websites, b) downloading forms and c)                  two-way type of interaction with public authorities,
submitting completed forms. Findings for these                      the proportion of internet users in the EU27 who
indicators are shown in Figure 9. Almost half of                    submitted completed web forms was 28%,


6                                                                                    66/2011 — Statistics in focus
6 percentage points lower than the proportion for                  example for sending tax declarations online.
downloading forms. However, ten Member States                      Another aspect was that national population
showed higher shares for submitting than for                       censuses were carried out in early 2011 for which it
downloading forms. This could be attributed to an                  was possible in several countries to complete
increasing offer or easiness to use such facilities on             questionnaires and return them via web forms.
e-government websites or user preferences, for

Figure 9: Internet users who interacted with public authorities in the last 12 months, by type of
interaction, 2011 (% of internet users)

    90

    80

    70

    60

    50

    40

    30

    20

    10

      0
          E 27
           U       BG C D D E IE E E FR IT C LV LT LU H M N AT P P R SI SK FI SE U
                       Z K E E    L S       Y          U T L    L T O             K

                   Obtained information from websites           Downloaded forms        Submitted completed forms

Note: Data for BE not reliable but included in EU27 aggregate


Source: Eurostat (online data code: isoc_bde15ei)


METHODOLOGICAL NOTES


Source: EU survey on ICT usage in households and by                (http://ec.europa.eu/information_society/eeurope/i2010/docs/b
individuals.                                                       enchmarking/benchmarking_digital_europe_2011-2015.pdf).
2011 data are based on selected aggregate data transmitted by      Country codes: European Union (27 countries) is written as
Member States and other countries. Data for UK (2009-2011)         EU27 and includes Belgium (BE), Bulgaria (BG), the Czech
include estimates for Northern Ireland. An update of the public    Republic (CZ), Denmark (DK), Germany (DE), Estonia (EE),
database covering all collected characteristics is foreseen        Ireland (IE), Greece (EL), Spain (ES), France (FR), Italy (IT),
during the first quarter 2012.                                     Cyprus (CY), Latvia (LV), Lithuania (LT), Luxembourg (LU),
                                                                   Hungary (HU), Malta (MT), the Netherlands (NL), Austria
The survey covered households with at least one person aged        (AT), Poland (PL), Portugal (PT), Romania (RO), Slovenia
16-74, and individuals aged 16-74. Households were asked           (SI), Slovakia (SK), Finland (FI), Sweden (SE) and the United
about internet access by any member of the household at            Kingdom (UK). Other countries for which data are presented
home, individuals about the last time of internet use, frequency   in this publication: Island (IS), Norway (NO), Croatia (HR),
and place of use, mobile use, activities and e-skills. Sample      Former Yugoslav Republic of Macedonia (MK), Turkey (TR)
sizes EU27: 149331 households and 214580 individuals               and Serbia (RS).
(2011).
                                                                   Definitions, reference periods of selected data:
The findings are used for monitoring several EU policies, in
particular the Digital Agenda. The Digital Agenda for Europe       'Digital divide' is a term used to describe gaps and pattern of
(http://ec.europa.eu/information_society/digital-                  access to and use of computers and the internet across the
agenda/index_en.htm) is one of the flagship initiatives under      population and countries.
the Europe 2020 strategy. Most indicators presented in this
publication are included in the 2011-2015 Benchmarking             The indicator on broadband internet access measures the
Digital Europe Framework                                           proportion of households having subscribed to at least a basic
                                                                   level of broadband. Broadband technologies include DSL


           Statistics in focus — 66/2011                                                                                             7
(Digital Subscriber Line), cable, optical fibre, satellite and    are one-time actions with a given timeframe for feedback and
3G/4G mobile telephony networks (e.g. UMTS).                      refer to the systematic collection of opinions. Social
                                                                  networking sites include tools for posting personal data into a
In general, individuals were asked about activities they had      profile, uploading user-created content, allowing personalised
carried out on the internet in the last 3 months prior to the     interaction and communication with others by posting
survey at home or at any other location for private purposes.     messages, and defining social relationships by determining
The main reference period was the first quarter of 2011 (the      who has access to data, who can communicate with whom and
data was collected in most countries in the second quarter).      how. Popular examples are Facebook, Twitter. Professional
Reading news included any type of online news, newspapers         networks are also seen in the broader context of social
or news magazines, either free of charge or paid. Services        networking and have the same requirement of profile creation
related to travel or travel related accommodation include         or contributing through messaging or chat or uploading text or
services for information (e.g. websites for tourists informing    audio-visual content files. Examples are LinkedIn, Xing,
about attractions, hotels, flight schedules), often combined      Ecademy.
with services for booking of travel tickets, hotel rooms etc.     The definition of e-commerce excludes manually typed e-
                                                                  mails.
Wiki software is a type of collaborative software program that    The definition of education levels is: high (tertiary education,
allows web pages to be created and collaboratively edited         ISCED 5 or 6), medium (upper secondary education or post
using a common web browser. The most popular example is           secondary, but not tertiary, ISCED 3 or 4), low (no formal
Wikipedia. Reading and posting opinions on civic or political     education completed, primary or lower secondary education,
issues refers to websites used to read opinions and to make       ISCED 0, 1 or 2).
own opinions known. The websites may have been created by
anyone or any organisation, including public or private (e.g.     Further explanations on the questions included in the survey
news agencies), governmental or non-governmental. Taking          can be found in the dedicated section on Information Society
part in on-line consultations or voting to define civic or        Statistics / Methodology / Methodological Manual /
political issues may address urban planning or signing a          Methodological Manual 2011: http://ec.europa.eu/eurostat/ict
petition via a website and relate to active participation. They


Further information

Eurostat Website: http://ec.europa.eu/eurostat
Data on "Information society statistics"
http://epp.eurostat.ec.europa.eu/portal/page/portal/information_society/data/database
Further information about "Information society statistics"
http://epp.eurostat.ec.europa.eu/portal/page/portal/information_society/introduction


Journalists can contact the media support service:
Bech Building, Office A4/125, L-2920 Luxembourg
Tel.: (352) 4301 33408
Fax: (352) 4301 35349
E-mail: eurostat-mediasupport@ec.europa.eu


European Statistical Data Support:

With the members of the ‘European statistical system’, Eurostat has set up a network of
support centres in nearly every Member State and in some EFTA countries.
Their role is to provide help and guidance to Internet users of European statistics.
Contact details for this support network can be found on the Eurostat website at:
http://ec.europa.eu/eurostat/.


All Eurostat publications can be ordered via the ‘EU Bookshop’:
http://bookshop.europa.eu/.


Manuscript completed on: 08.12.2011
Data extracted on: 30.11.2011
ISSN 1977-0316
Catalogue number:KS-SF-11-066-EN-N
© European Union, 2011

Más contenido relacionado

Destacado

Labs mas
Labs masLabs mas
Labs masAfRIGA
 
Country presentation joint taskforce meeting - sierra leone
Country presentation   joint taskforce meeting - sierra leoneCountry presentation   joint taskforce meeting - sierra leone
Country presentation joint taskforce meeting - sierra leoneAfRIGA
 
Ghana presentation johnson
Ghana presentation   johnsonGhana presentation   johnson
Ghana presentation johnsonAfRIGA
 
Essential things that should always be in your car
Essential things that should always be in your carEssential things that should always be in your car
Essential things that should always be in your carEason Chan
 
Activism x Technology
Activism x TechnologyActivism x Technology
Activism x TechnologyWebVisions
 

Destacado (7)

Labs mas
Labs masLabs mas
Labs mas
 
Country presentation joint taskforce meeting - sierra leone
Country presentation   joint taskforce meeting - sierra leoneCountry presentation   joint taskforce meeting - sierra leone
Country presentation joint taskforce meeting - sierra leone
 
Ghana presentation johnson
Ghana presentation   johnsonGhana presentation   johnson
Ghana presentation johnson
 
The Origin of Rice (Tagalog Version)
The Origin of Rice (Tagalog Version)The Origin of Rice (Tagalog Version)
The Origin of Rice (Tagalog Version)
 
4 rice
4 rice4 rice
4 rice
 
Essential things that should always be in your car
Essential things that should always be in your carEssential things that should always be in your car
Essential things that should always be in your car
 
Activism x Technology
Activism x TechnologyActivism x Technology
Activism x Technology
 

Similar a Internet

TNS: E-communications in Europe.
TNS: E-communications in Europe.TNS: E-communications in Europe.
TNS: E-communications in Europe.TNSopinion
 
Kevin McLean Moving Social Security Online
Kevin McLean Moving Social Security OnlineKevin McLean Moving Social Security Online
Kevin McLean Moving Social Security OnlineKevin McLean
 
apidays Paris 2022 - A day in the life of BPCE Sustainable IT referent/evange...
apidays Paris 2022 - A day in the life of BPCE Sustainable IT referent/evange...apidays Paris 2022 - A day in the life of BPCE Sustainable IT referent/evange...
apidays Paris 2022 - A day in the life of BPCE Sustainable IT referent/evange...apidays
 
Occupati del digitale
Occupati del digitaleOccupati del digitale
Occupati del digitalePaolo Coppola
 
Mobile media an_iab_europe_white_paper
Mobile media an_iab_europe_white_paperMobile media an_iab_europe_white_paper
Mobile media an_iab_europe_white_paperSaatchi & Saatchi
 
Mobile consumer insights IAB Europe
Mobile consumer insights IAB EuropeMobile consumer insights IAB Europe
Mobile consumer insights IAB EuropeAd6 Media
 
Mobile Media; Consumer Insights across Europe
Mobile Media; Consumer Insights across EuropeMobile Media; Consumer Insights across Europe
Mobile Media; Consumer Insights across EuropeIAB Spain
 
Are nonusers socially disadvantaged?
Are nonusers socially disadvantaged? Are nonusers socially disadvantaged?
Are nonusers socially disadvantaged? Petr Lupac
 
Information sources and the use of media in Italy (1)
Information sources and the use of media in Italy (1)Information sources and the use of media in Italy (1)
Information sources and the use of media in Italy (1)Quattrogatti.info
 
Digital Gender Gap in EU-27 ICT Employment During COVID-19 Impact
Digital Gender Gap in EU-27 ICT Employment During COVID-19 ImpactDigital Gender Gap in EU-27 ICT Employment During COVID-19 Impact
Digital Gender Gap in EU-27 ICT Employment During COVID-19 ImpactICDEcCnferenece
 
ICT usage by European enterprises
ICT usage by European enterprisesICT usage by European enterprises
ICT usage by European enterprisesFriso de Jong
 
Evolution of Digital Marketing Assignment 2
Evolution of Digital Marketing Assignment 2 Evolution of Digital Marketing Assignment 2
Evolution of Digital Marketing Assignment 2 RichardBetts19
 
Demographic transition, ageing and migration
Demographic transition, ageing and migrationDemographic transition, ageing and migration
Demographic transition, ageing and migrationMigrationPolicyCentre
 
Helen Milner Digital Inclusion At Handheld Learning London 7 Oct 2009
Helen Milner Digital Inclusion At Handheld Learning London 7 Oct 2009Helen Milner Digital Inclusion At Handheld Learning London 7 Oct 2009
Helen Milner Digital Inclusion At Handheld Learning London 7 Oct 2009Helen Milner
 
Anna Ludwinek, the hidden potential of Europe’s economically inactive
Anna Ludwinek, the hidden potential of Europe’s economically inactiveAnna Ludwinek, the hidden potential of Europe’s economically inactive
Anna Ludwinek, the hidden potential of Europe’s economically inactiveNUI Galway
 
ICT4D, Digital technologies for development
ICT4D, Digital technologies for developmentICT4D, Digital technologies for development
ICT4D, Digital technologies for developmentRoberto Polillo
 
Helen Milner Digital Inclusion At Handheld Learning London 7 Oct 2009
Helen Milner Digital Inclusion At Handheld Learning London 7 Oct 2009Helen Milner Digital Inclusion At Handheld Learning London 7 Oct 2009
Helen Milner Digital Inclusion At Handheld Learning London 7 Oct 2009gueste0da83
 

Similar a Internet (20)

TNS: E-communications in Europe.
TNS: E-communications in Europe.TNS: E-communications in Europe.
TNS: E-communications in Europe.
 
Kevin McLean Moving Social Security Online
Kevin McLean Moving Social Security OnlineKevin McLean Moving Social Security Online
Kevin McLean Moving Social Security Online
 
Citizen 2.0
Citizen 2.0Citizen 2.0
Citizen 2.0
 
Encuentro en México 2010 - Dmitri Ypsilanti
Encuentro en México 2010 - Dmitri YpsilantiEncuentro en México 2010 - Dmitri Ypsilanti
Encuentro en México 2010 - Dmitri Ypsilanti
 
apidays Paris 2022 - A day in the life of BPCE Sustainable IT referent/evange...
apidays Paris 2022 - A day in the life of BPCE Sustainable IT referent/evange...apidays Paris 2022 - A day in the life of BPCE Sustainable IT referent/evange...
apidays Paris 2022 - A day in the life of BPCE Sustainable IT referent/evange...
 
Occupati del digitale
Occupati del digitaleOccupati del digitale
Occupati del digitale
 
Mobile media an_iab_europe_white_paper
Mobile media an_iab_europe_white_paperMobile media an_iab_europe_white_paper
Mobile media an_iab_europe_white_paper
 
Mobile consumer insights IAB Europe
Mobile consumer insights IAB EuropeMobile consumer insights IAB Europe
Mobile consumer insights IAB Europe
 
Mobile Media; Consumer Insights across Europe
Mobile Media; Consumer Insights across EuropeMobile Media; Consumer Insights across Europe
Mobile Media; Consumer Insights across Europe
 
Are nonusers socially disadvantaged?
Are nonusers socially disadvantaged? Are nonusers socially disadvantaged?
Are nonusers socially disadvantaged?
 
Information sources and the use of media in Italy (1)
Information sources and the use of media in Italy (1)Information sources and the use of media in Italy (1)
Information sources and the use of media in Italy (1)
 
Digital Gender Gap in EU-27 ICT Employment During COVID-19 Impact
Digital Gender Gap in EU-27 ICT Employment During COVID-19 ImpactDigital Gender Gap in EU-27 ICT Employment During COVID-19 Impact
Digital Gender Gap in EU-27 ICT Employment During COVID-19 Impact
 
ICT usage by European enterprises
ICT usage by European enterprisesICT usage by European enterprises
ICT usage by European enterprises
 
Evolution of Digital Marketing Assignment 2
Evolution of Digital Marketing Assignment 2 Evolution of Digital Marketing Assignment 2
Evolution of Digital Marketing Assignment 2
 
Demographic transition, ageing and migration
Demographic transition, ageing and migrationDemographic transition, ageing and migration
Demographic transition, ageing and migration
 
Helen Milner Digital Inclusion At Handheld Learning London 7 Oct 2009
Helen Milner Digital Inclusion At Handheld Learning London 7 Oct 2009Helen Milner Digital Inclusion At Handheld Learning London 7 Oct 2009
Helen Milner Digital Inclusion At Handheld Learning London 7 Oct 2009
 
Anna Ludwinek, the hidden potential of Europe’s economically inactive
Anna Ludwinek, the hidden potential of Europe’s economically inactiveAnna Ludwinek, the hidden potential of Europe’s economically inactive
Anna Ludwinek, the hidden potential of Europe’s economically inactive
 
ICT4D, Digital technologies for development
ICT4D, Digital technologies for developmentICT4D, Digital technologies for development
ICT4D, Digital technologies for development
 
Networked and Hyperconnected: The New Social (and work) Operating System
Networked and Hyperconnected:The New Social (and work) Operating SystemNetworked and Hyperconnected:The New Social (and work) Operating System
Networked and Hyperconnected: The New Social (and work) Operating System
 
Helen Milner Digital Inclusion At Handheld Learning London 7 Oct 2009
Helen Milner Digital Inclusion At Handheld Learning London 7 Oct 2009Helen Milner Digital Inclusion At Handheld Learning London 7 Oct 2009
Helen Milner Digital Inclusion At Handheld Learning London 7 Oct 2009
 

Último

Streamlining Python Development: A Guide to a Modern Project Setup
Streamlining Python Development: A Guide to a Modern Project SetupStreamlining Python Development: A Guide to a Modern Project Setup
Streamlining Python Development: A Guide to a Modern Project SetupFlorian Wilhelm
 
How to write a Business Continuity Plan
How to write a Business Continuity PlanHow to write a Business Continuity Plan
How to write a Business Continuity PlanDatabarracks
 
Powerpoint exploring the locations used in television show Time Clash
Powerpoint exploring the locations used in television show Time ClashPowerpoint exploring the locations used in television show Time Clash
Powerpoint exploring the locations used in television show Time Clashcharlottematthew16
 
Are Multi-Cloud and Serverless Good or Bad?
Are Multi-Cloud and Serverless Good or Bad?Are Multi-Cloud and Serverless Good or Bad?
Are Multi-Cloud and Serverless Good or Bad?Mattias Andersson
 
Unraveling Multimodality with Large Language Models.pdf
Unraveling Multimodality with Large Language Models.pdfUnraveling Multimodality with Large Language Models.pdf
Unraveling Multimodality with Large Language Models.pdfAlex Barbosa Coqueiro
 
Artificial intelligence in cctv survelliance.pptx
Artificial intelligence in cctv survelliance.pptxArtificial intelligence in cctv survelliance.pptx
Artificial intelligence in cctv survelliance.pptxhariprasad279825
 
New from BookNet Canada for 2024: BNC CataList - Tech Forum 2024
New from BookNet Canada for 2024: BNC CataList - Tech Forum 2024New from BookNet Canada for 2024: BNC CataList - Tech Forum 2024
New from BookNet Canada for 2024: BNC CataList - Tech Forum 2024BookNet Canada
 
Transcript: New from BookNet Canada for 2024: BNC CataList - Tech Forum 2024
Transcript: New from BookNet Canada for 2024: BNC CataList - Tech Forum 2024Transcript: New from BookNet Canada for 2024: BNC CataList - Tech Forum 2024
Transcript: New from BookNet Canada for 2024: BNC CataList - Tech Forum 2024BookNet Canada
 
Commit 2024 - Secret Management made easy
Commit 2024 - Secret Management made easyCommit 2024 - Secret Management made easy
Commit 2024 - Secret Management made easyAlfredo García Lavilla
 
Vertex AI Gemini Prompt Engineering Tips
Vertex AI Gemini Prompt Engineering TipsVertex AI Gemini Prompt Engineering Tips
Vertex AI Gemini Prompt Engineering TipsMiki Katsuragi
 
The Ultimate Guide to Choosing WordPress Pros and Cons
The Ultimate Guide to Choosing WordPress Pros and ConsThe Ultimate Guide to Choosing WordPress Pros and Cons
The Ultimate Guide to Choosing WordPress Pros and ConsPixlogix Infotech
 
Dev Dives: Streamline document processing with UiPath Studio Web
Dev Dives: Streamline document processing with UiPath Studio WebDev Dives: Streamline document processing with UiPath Studio Web
Dev Dives: Streamline document processing with UiPath Studio WebUiPathCommunity
 
DevoxxFR 2024 Reproducible Builds with Apache Maven
DevoxxFR 2024 Reproducible Builds with Apache MavenDevoxxFR 2024 Reproducible Builds with Apache Maven
DevoxxFR 2024 Reproducible Builds with Apache MavenHervé Boutemy
 
"Subclassing and Composition – A Pythonic Tour of Trade-Offs", Hynek Schlawack
"Subclassing and Composition – A Pythonic Tour of Trade-Offs", Hynek Schlawack"Subclassing and Composition – A Pythonic Tour of Trade-Offs", Hynek Schlawack
"Subclassing and Composition – A Pythonic Tour of Trade-Offs", Hynek SchlawackFwdays
 
TrustArc Webinar - How to Build Consumer Trust Through Data Privacy
TrustArc Webinar - How to Build Consumer Trust Through Data PrivacyTrustArc Webinar - How to Build Consumer Trust Through Data Privacy
TrustArc Webinar - How to Build Consumer Trust Through Data PrivacyTrustArc
 
Leverage Zilliz Serverless - Up to 50X Saving for Your Vector Storage Cost
Leverage Zilliz Serverless - Up to 50X Saving for Your Vector Storage CostLeverage Zilliz Serverless - Up to 50X Saving for Your Vector Storage Cost
Leverage Zilliz Serverless - Up to 50X Saving for Your Vector Storage CostZilliz
 
Human Factors of XR: Using Human Factors to Design XR Systems
Human Factors of XR: Using Human Factors to Design XR SystemsHuman Factors of XR: Using Human Factors to Design XR Systems
Human Factors of XR: Using Human Factors to Design XR SystemsMark Billinghurst
 
Developer Data Modeling Mistakes: From Postgres to NoSQL
Developer Data Modeling Mistakes: From Postgres to NoSQLDeveloper Data Modeling Mistakes: From Postgres to NoSQL
Developer Data Modeling Mistakes: From Postgres to NoSQLScyllaDB
 
Advanced Computer Architecture – An Introduction
Advanced Computer Architecture – An IntroductionAdvanced Computer Architecture – An Introduction
Advanced Computer Architecture – An IntroductionDilum Bandara
 

Último (20)

E-Vehicle_Hacking_by_Parul Sharma_null_owasp.pptx
E-Vehicle_Hacking_by_Parul Sharma_null_owasp.pptxE-Vehicle_Hacking_by_Parul Sharma_null_owasp.pptx
E-Vehicle_Hacking_by_Parul Sharma_null_owasp.pptx
 
Streamlining Python Development: A Guide to a Modern Project Setup
Streamlining Python Development: A Guide to a Modern Project SetupStreamlining Python Development: A Guide to a Modern Project Setup
Streamlining Python Development: A Guide to a Modern Project Setup
 
How to write a Business Continuity Plan
How to write a Business Continuity PlanHow to write a Business Continuity Plan
How to write a Business Continuity Plan
 
Powerpoint exploring the locations used in television show Time Clash
Powerpoint exploring the locations used in television show Time ClashPowerpoint exploring the locations used in television show Time Clash
Powerpoint exploring the locations used in television show Time Clash
 
Are Multi-Cloud and Serverless Good or Bad?
Are Multi-Cloud and Serverless Good or Bad?Are Multi-Cloud and Serverless Good or Bad?
Are Multi-Cloud and Serverless Good or Bad?
 
Unraveling Multimodality with Large Language Models.pdf
Unraveling Multimodality with Large Language Models.pdfUnraveling Multimodality with Large Language Models.pdf
Unraveling Multimodality with Large Language Models.pdf
 
Artificial intelligence in cctv survelliance.pptx
Artificial intelligence in cctv survelliance.pptxArtificial intelligence in cctv survelliance.pptx
Artificial intelligence in cctv survelliance.pptx
 
New from BookNet Canada for 2024: BNC CataList - Tech Forum 2024
New from BookNet Canada for 2024: BNC CataList - Tech Forum 2024New from BookNet Canada for 2024: BNC CataList - Tech Forum 2024
New from BookNet Canada for 2024: BNC CataList - Tech Forum 2024
 
Transcript: New from BookNet Canada for 2024: BNC CataList - Tech Forum 2024
Transcript: New from BookNet Canada for 2024: BNC CataList - Tech Forum 2024Transcript: New from BookNet Canada for 2024: BNC CataList - Tech Forum 2024
Transcript: New from BookNet Canada for 2024: BNC CataList - Tech Forum 2024
 
Commit 2024 - Secret Management made easy
Commit 2024 - Secret Management made easyCommit 2024 - Secret Management made easy
Commit 2024 - Secret Management made easy
 
Vertex AI Gemini Prompt Engineering Tips
Vertex AI Gemini Prompt Engineering TipsVertex AI Gemini Prompt Engineering Tips
Vertex AI Gemini Prompt Engineering Tips
 
The Ultimate Guide to Choosing WordPress Pros and Cons
The Ultimate Guide to Choosing WordPress Pros and ConsThe Ultimate Guide to Choosing WordPress Pros and Cons
The Ultimate Guide to Choosing WordPress Pros and Cons
 
Dev Dives: Streamline document processing with UiPath Studio Web
Dev Dives: Streamline document processing with UiPath Studio WebDev Dives: Streamline document processing with UiPath Studio Web
Dev Dives: Streamline document processing with UiPath Studio Web
 
DevoxxFR 2024 Reproducible Builds with Apache Maven
DevoxxFR 2024 Reproducible Builds with Apache MavenDevoxxFR 2024 Reproducible Builds with Apache Maven
DevoxxFR 2024 Reproducible Builds with Apache Maven
 
"Subclassing and Composition – A Pythonic Tour of Trade-Offs", Hynek Schlawack
"Subclassing and Composition – A Pythonic Tour of Trade-Offs", Hynek Schlawack"Subclassing and Composition – A Pythonic Tour of Trade-Offs", Hynek Schlawack
"Subclassing and Composition – A Pythonic Tour of Trade-Offs", Hynek Schlawack
 
TrustArc Webinar - How to Build Consumer Trust Through Data Privacy
TrustArc Webinar - How to Build Consumer Trust Through Data PrivacyTrustArc Webinar - How to Build Consumer Trust Through Data Privacy
TrustArc Webinar - How to Build Consumer Trust Through Data Privacy
 
Leverage Zilliz Serverless - Up to 50X Saving for Your Vector Storage Cost
Leverage Zilliz Serverless - Up to 50X Saving for Your Vector Storage CostLeverage Zilliz Serverless - Up to 50X Saving for Your Vector Storage Cost
Leverage Zilliz Serverless - Up to 50X Saving for Your Vector Storage Cost
 
Human Factors of XR: Using Human Factors to Design XR Systems
Human Factors of XR: Using Human Factors to Design XR SystemsHuman Factors of XR: Using Human Factors to Design XR Systems
Human Factors of XR: Using Human Factors to Design XR Systems
 
Developer Data Modeling Mistakes: From Postgres to NoSQL
Developer Data Modeling Mistakes: From Postgres to NoSQLDeveloper Data Modeling Mistakes: From Postgres to NoSQL
Developer Data Modeling Mistakes: From Postgres to NoSQL
 
Advanced Computer Architecture – An Introduction
Advanced Computer Architecture – An IntroductionAdvanced Computer Architecture – An Introduction
Advanced Computer Architecture – An Introduction
 

Internet

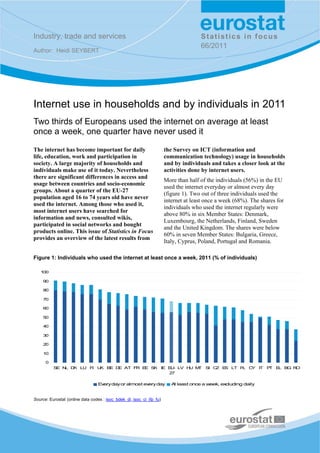
  • 1. Industry, trade and services Statistics in focus 66/2011 Author: Heidi SEYBERT Internet use in households and by individuals in 2011 Two thirds of Europeans used the internet on average at least once a week, one quarter have never used it The internet has become important for daily the Survey on ICT (information and life, education, work and participation in communication technology) usage in households society. A large majority of households and and by individuals and takes a closer look at the individuals make use of it today. Nevertheless activities done by internet users. there are significant differences in access and More than half of the individuals (56%) in the EU usage between countries and socio-economic used the internet everyday or almost every day groups. About a quarter of the EU-27 (figure 1). Two out of three individuals used the population aged 16 to 74 years old have never internet at least once a week (68%). The shares for used the internet. Among those who used it, individuals who used the internet regularly were most internet users have searched for above 80% in six Member States: Denmark, information and news, consulted wikis, Luxembourg, the Netherlands, Finland, Sweden participated in social networks and bought and the United Kingdom. The shares were below products online. This issue of Statistics in Focus 60% in seven Member States: Bulgaria, Greece, provides an overview of the latest results from Italy, Cyprus, Poland, Portugal and Romania. Figure 1: Individuals who used the internet at least once a week, 2011 (% of individuals) 100 90 80 70 60 50 40 30 20 10 0 S N D LU F U BE D AT F E S E L K I K E R E K IE E - LV H M U U T S C E LT P C I Z S L Y IT P E B R T L G O 27 Every day or almost every day A least once a week, ex t cluding daily Source: Eurostat (online data codes : isoc_bdek_di, isoc_ci_ifp_fu)
  • 2. Nearly three quarters of EU households had access to the internet in 2011 There were also significant disparities in broadband Figure 2: Internet access and broadband take-up by households between countries. The internet connections in households, EU27 (%) percentages were well below 50% in Bulgaria, Greece and Romania. However, several Member 100 States showed a growth of 30 percentage points or 73 80 65 70 more compared to 2007. The growth was highest in 60 68 60 49 54 56 61 Greece at 38 percentage points, followed by 49 42 Cyprus (36 p.p.), the Czech Republic (35 p.p.), 40 30 Malta and Poland (both 31 p.p.). 20 0 Table 1: Internet access and broadband internet 2006 2007 2008 2009 2010 2011 connections in households (%) Internet access Broadband connections Internet connections in households Broadband internet connections 2007 2009 2011 2007 2009 2011 EU-27 54 65 73 42 56 68 Source: Eurostat (online data code : isoc_bde15b_h) BE 60 67 77 56 63 74 BG 19 30 45 15 26 40 CZ 35 54 67 28 49 63 DK 78 83 90 70 76 84 The proportion of households in the EU with DE 71 79 83 50 65 78 access to the internet reached 73% in 2011, EE 53 63 71 48 62 66 representing an increase of 24 percentage points IE 57 67 78 31 54 65 EL 25 38 50 7 33 45 compared with 2006 (figure 2). ES 45 54 64 39 51 62 FR 49 63 76 43 57 70 Broadband internet access enables higher speed IT 43 53 62 25 39 52 when browsing and performing activities over the CY 39 53 57 20 47 56 LV 51 58 64 32 50 59 internet. For example, downloading an article or LT 44 60 62 34 50 57 software from a website can take a few seconds LU 75 87 91 58 71 68 with broadband and several minutes without a HU 38 55 65 33 51 61 MT 54 64 75 44 63 75 broadband internet connection. NL 83 90 94 74 77 83 AT 60 70 75 46 58 72 In 2011, more than two thirds (68%) of households PL 41 59 67 30 51 61 in the EU had used broadband connections, PT 40 48 58 30 46 57 RO 22 38 47 8 24 31 representing a notable increase of 26 percentage SI 58 64 73 44 56 67 points (p.p.) compared with 2007 and of 38 p.p. SK 46 62 71 27 42 55 compared with 2006. Today most households with FI 69 78 84 63 74 81 SE 79 86 91 67 79 86 internet access have broadband. UK1 67 77 85 57 69 83 IS 84 90 93 76 87 93 The share of internet access varied among Member NO 78 86 92 67 78 80 States, ranging from 90% of households and above HR 41 50 61 23 39 56 MK : 42 : : 34 : in the Netherlands, Luxembourg, Sweden and TR 20 30 43 17 26 39 Denmark to 50% and below in Bulgaria, Romania RS 26 37 : 7 23 : and Greece (table 1). 1 UK data for 2009 and 2011 include estimates for Northern Ireland Source: Eurostat (online data code: isoc_bde15b_h) Nine in ten individuals aged 16-24 used the internet regularly In 2011, 71% of individuals in the EU27 used the of the Digital Agenda for Europe: By 2015, 75% of internet at least once in the last three months prior the population should have used the internet to the survey. More than two thirds of individuals regularly. The current level of use was (68%) in the EU27 had used the internet regularly 7 percentage points below this target. There were (on average at least once a week), either at home, at significant gaps in usage ('digital divides') when work or at any other place (table 2). This indicator looking at age groups and level of formal education was included in the set of key performance targets (figure 3). 2 66/2011 — Statistics in focus
  • 3. Figure 3: Individuals who used the internet on average at least once a week, by gender, age group and level of formal education, EU27, 2011 (% of individuals) 100 91 92 90 80 76 70 71 68 70 65 60 50 45 40 40 30 20 10 0 All Men Women 16-24 25-54 55-74 Low Medium High Individuals years years years education education education Source: Eurostat (online data code : isoc_bdek_di) Table 2: Internet use and frequency of use by individuals, 2011 (% of individuals) Internet users and non-users Frequency of use (on average) Used internet Used internet At least once a Never used Every day or within the last 3 within the last 12 week (including internet almost every day months months daily use) EU-27 71 73 24 56 68 BE 82 83 14 65 78 BG 48 51 46 37 46 CZ 70 73 24 41 63 DK 90 91 7 78 88 DE 81 83 16 63 77 EE 77 77 20 59 73 IE 75 77 21 55 71 EL 52 53 45 37 47 ES 67 69 29 48 62 FR 78 80 18 62 74 IT 54 57 39 49 51 CY 57 58 41 45 54 LV 70 72 27 53 66 LT 64 65 33 48 61 LU 90 91 8 76 86 HU 68 70 28 56 66 MT 68 69 30 55 66 NL 91 92 7 79 90 AT 79 80 18 59 76 PL 62 65 33 45 58 PT 55 58 41 42 51 RO 40 44 54 24 37 SI 67 69 29 54 64 SK 74 78 20 56 72 FI 89 89 9 76 86 SE 93 94 5 80 91 UK1 85 87 11 70 81 IS 95 95 4 88 94 NO 93 94 5 82 91 HR 58 60 39 44 55 TR 40 43 55 26 36 1 UK data include estimates for Northern Ireland Source: Eurostat (online data codes : isoc_ci_ifp_iu, isoc_bde15cua) Statistics in focus — 66/2011 3
  • 4. The percentage of regular internet users among much as the share for the population with a low younger persons aged 16-24 was 91% while it was level of education. Differences between men and only 40% for the age group 55-74 years. The women were relatively small. Slightly more than percentage of the population with high formal two thirds of men (70%) and 65% of women used education using the internet was more than twice as the internet regularly. One in four individuals aged 16-74 in the EU had never used the internet The average annual decline was around 4 Figure 4: Individuals who have never used the percentage points in the period from 2006 to 2010. internet, EU27, 2006-2011 (% of individuals) Although the rate of decline has slowed down, reaching the share of not more than 15% non-users set as an EU target for 2015 in the Digital Agenda 100 remains possible. 80 60 Large digital divides were evident when looking at 42 40 37 33 30 26 the share of the population who have never used 24 20 the internet across Member States (figure 5). The 0 highest shares of the population with no past 2006 2007 2008 2009 2010 2011 experiences in internet use at all whether at home, at work or at any other place were registered in Romania (54%), Bulgaria (46%), Greece (45%), Source: Eurostat (online data code : isoc_bdek_di) Cyprus (41%) and Portugal (41%), and the lowest in Sweden (5%), the Netherlands and Denmark In the EU27, the proportion of individuals who (both 7%), Luxembourg (8%) and Finland (9%). never used the internet was 24% in 2011 (figure 4). Another four Member States (Italy, Lithuania, The proportion of non-users in the EU declined Malta and Poland) showed proportions between only by 2 percentage points over one year, from 30% and below 40% for the population being 26% in 2010 to 24% in 2011. excluded and without user skills regarding the internet. Figure 5: Individuals who have never used the internet, 2011 (% of individuals) 60 50 40 30 20 10 0 RO BG EL CY PT IT LT PL MT ES SI HU LV EU- CZ IE EE SK AT FR DE BE UK FI LU DK NL SE 27 Source: Eurostat (online data code : isoc_bdek_di) 4 66/2011 — Statistics in focus
  • 5. A majority of internet users searched for information about goods and services, travel or health, read online news, consulted wikis and participated in social networks Looking at the use of such information services Figure 6: Use of internet for obtaining information and reading online news, EU27, over the last few years, the use of the internet for 2009-2011 (% of internet users) searching product information and about travel and accommodation remained relatively stable. More significant increases were noticed for reading 0 10 20 30 40 50 60 70 80 90 online news and using information about health, Finding information about goods or services education and training. In particular, reading online news showed steady growth and increased by Use of services related to travel or travel related accommodation 2009 6 percentage points compared with 2010. Reading online news, newspapers 2010 2011 Eurostat is releasing 5 new indicators on internet Looking for health-related information usage in 2011 (figure 7). They are part of the set of Looking for information about education, training or indicators included in the Benchmarking Digital course offers Europe Framework 2011-2015 that supports monitoring of the Digital Agenda and covers issues related to participation in social and professional Source: Eurostat (online data codes : isoc_bde15cua, networks, consulting wikis and civic or political isoc_ci_ac_i) participation. The internet has found wide recognition as a source In the EU27, more than half of internet users (53%) of information by users. Nearly 80% of internet participated in social networks. The proportion of users searched for information about goods and internet users who participated in professional services for private purposes (figure 6). networks was 10%. A significant share of internet More than half of internet users in the EU in the users made use of new learning opportunities: first quarter of 2011 read news online (56%), used More than half of internet users (54%) consulted services related to travel or travel related wikis on any subject. One in five internet users accommodation (54%) or looked for health related stated that they read and posted opinions on civic information (54%). Furthermore, a significant share or political issues. One in ten internet users took of internet users (40%) searched for information part in online consultations or voting. about education, training or course offers. Figure 7: Use of internet for social and professional networking, learning, civic and political participation, EU27, 2011 (% of internet users) 0 10 20 30 40 50 60 Participating in social networks Participating in professional networks Consulting wikis Reading and posting opinions on civic or political issues Taking part in online consultations or voting Source: Eurostat (online data code : isoc_bde15cua) Statistics in focus — 66/2011 5
  • 6. Three in five internet users shopped online within the last twelve months Buying over the internet (e-commerce or e- available goods or services finally also buy such shopping) has become very popular in the EU. products online. Reasons may include the Consumers appreciate the convenience of shopping preference to shop in person or trust or security anytime and anywhere, getting better access to concerns. Figure 8 shows the proportions of e- information and a broader selection of products, shoppers among internet users. The reference comparing prices or obtaining opinions from other period of the last twelve months prior to the survey consumers. Not all users who take advantage of for this indicator takes into account seasonal effects informing themselves over the internet about in e-commerce. Figure 8: Internet users who bought or ordered goods or services for private use over the internet in the last 12 months, 2009-2011 (% of internet users) 90 80 70 60 50 40 30 20 10 0 U D D SE N LU FI K K E L FR M E - IE AT BE SK P T U L SI C E C E H P E Z S Y L U T E IT LV LT BG RO 27 2009 2010 2011 Source: Eurostat (online data code : isoc_bdek_smi) In 2011, 58% of internet users in the EU27 have ranging from 13 % in Bulgaria and Romania, 25% bought or ordered goods or services over the in Lithuania and 27% in Estonia, Italy and Latvia internet for private purposes in the last 12 months, to 82% in the United Kingdom, 77% in Denmark compared with 57% in 2010 and 54% in 2009. and Germany, 75% in Sweden and 74% in the However, the share of e-shoppers among internet Netherlands. Compared with 2010, Lithuania and users varied considerably between Member States, Slovenia recorded the highest increases. Three in ten internet users submitted completed web forms to public authorities The survey collected indicators on e-government EU internet users have obtained information from which covers interactions between citizens and all public authorities' websites within the last twelve levels of government (local or city, regional, months prior to the survey and one third national) for a) obtaining information from public downloaded forms. Looking at a higher level and authorities' websites, b) downloading forms and c) two-way type of interaction with public authorities, submitting completed forms. Findings for these the proportion of internet users in the EU27 who indicators are shown in Figure 9. Almost half of submitted completed web forms was 28%, 6 66/2011 — Statistics in focus
  • 7. 6 percentage points lower than the proportion for example for sending tax declarations online. downloading forms. However, ten Member States Another aspect was that national population showed higher shares for submitting than for censuses were carried out in early 2011 for which it downloading forms. This could be attributed to an was possible in several countries to complete increasing offer or easiness to use such facilities on questionnaires and return them via web forms. e-government websites or user preferences, for Figure 9: Internet users who interacted with public authorities in the last 12 months, by type of interaction, 2011 (% of internet users) 90 80 70 60 50 40 30 20 10 0 E 27 U BG C D D E IE E E FR IT C LV LT LU H M N AT P P R SI SK FI SE U Z K E E L S Y U T L L T O K Obtained information from websites Downloaded forms Submitted completed forms Note: Data for BE not reliable but included in EU27 aggregate Source: Eurostat (online data code: isoc_bde15ei) METHODOLOGICAL NOTES Source: EU survey on ICT usage in households and by (http://ec.europa.eu/information_society/eeurope/i2010/docs/b individuals. enchmarking/benchmarking_digital_europe_2011-2015.pdf). 2011 data are based on selected aggregate data transmitted by Country codes: European Union (27 countries) is written as Member States and other countries. Data for UK (2009-2011) EU27 and includes Belgium (BE), Bulgaria (BG), the Czech include estimates for Northern Ireland. An update of the public Republic (CZ), Denmark (DK), Germany (DE), Estonia (EE), database covering all collected characteristics is foreseen Ireland (IE), Greece (EL), Spain (ES), France (FR), Italy (IT), during the first quarter 2012. Cyprus (CY), Latvia (LV), Lithuania (LT), Luxembourg (LU), Hungary (HU), Malta (MT), the Netherlands (NL), Austria The survey covered households with at least one person aged (AT), Poland (PL), Portugal (PT), Romania (RO), Slovenia 16-74, and individuals aged 16-74. Households were asked (SI), Slovakia (SK), Finland (FI), Sweden (SE) and the United about internet access by any member of the household at Kingdom (UK). Other countries for which data are presented home, individuals about the last time of internet use, frequency in this publication: Island (IS), Norway (NO), Croatia (HR), and place of use, mobile use, activities and e-skills. Sample Former Yugoslav Republic of Macedonia (MK), Turkey (TR) sizes EU27: 149331 households and 214580 individuals and Serbia (RS). (2011). Definitions, reference periods of selected data: The findings are used for monitoring several EU policies, in particular the Digital Agenda. The Digital Agenda for Europe 'Digital divide' is a term used to describe gaps and pattern of (http://ec.europa.eu/information_society/digital- access to and use of computers and the internet across the agenda/index_en.htm) is one of the flagship initiatives under population and countries. the Europe 2020 strategy. Most indicators presented in this publication are included in the 2011-2015 Benchmarking The indicator on broadband internet access measures the Digital Europe Framework proportion of households having subscribed to at least a basic level of broadband. Broadband technologies include DSL Statistics in focus — 66/2011 7
  • 8. (Digital Subscriber Line), cable, optical fibre, satellite and are one-time actions with a given timeframe for feedback and 3G/4G mobile telephony networks (e.g. UMTS). refer to the systematic collection of opinions. Social networking sites include tools for posting personal data into a In general, individuals were asked about activities they had profile, uploading user-created content, allowing personalised carried out on the internet in the last 3 months prior to the interaction and communication with others by posting survey at home or at any other location for private purposes. messages, and defining social relationships by determining The main reference period was the first quarter of 2011 (the who has access to data, who can communicate with whom and data was collected in most countries in the second quarter). how. Popular examples are Facebook, Twitter. Professional Reading news included any type of online news, newspapers networks are also seen in the broader context of social or news magazines, either free of charge or paid. Services networking and have the same requirement of profile creation related to travel or travel related accommodation include or contributing through messaging or chat or uploading text or services for information (e.g. websites for tourists informing audio-visual content files. Examples are LinkedIn, Xing, about attractions, hotels, flight schedules), often combined Ecademy. with services for booking of travel tickets, hotel rooms etc. The definition of e-commerce excludes manually typed e- mails. Wiki software is a type of collaborative software program that The definition of education levels is: high (tertiary education, allows web pages to be created and collaboratively edited ISCED 5 or 6), medium (upper secondary education or post using a common web browser. The most popular example is secondary, but not tertiary, ISCED 3 or 4), low (no formal Wikipedia. Reading and posting opinions on civic or political education completed, primary or lower secondary education, issues refers to websites used to read opinions and to make ISCED 0, 1 or 2). own opinions known. The websites may have been created by anyone or any organisation, including public or private (e.g. Further explanations on the questions included in the survey news agencies), governmental or non-governmental. Taking can be found in the dedicated section on Information Society part in on-line consultations or voting to define civic or Statistics / Methodology / Methodological Manual / political issues may address urban planning or signing a Methodological Manual 2011: http://ec.europa.eu/eurostat/ict petition via a website and relate to active participation. They Further information Eurostat Website: http://ec.europa.eu/eurostat Data on "Information society statistics" http://epp.eurostat.ec.europa.eu/portal/page/portal/information_society/data/database Further information about "Information society statistics" http://epp.eurostat.ec.europa.eu/portal/page/portal/information_society/introduction Journalists can contact the media support service: Bech Building, Office A4/125, L-2920 Luxembourg Tel.: (352) 4301 33408 Fax: (352) 4301 35349 E-mail: eurostat-mediasupport@ec.europa.eu European Statistical Data Support: With the members of the ‘European statistical system’, Eurostat has set up a network of support centres in nearly every Member State and in some EFTA countries. Their role is to provide help and guidance to Internet users of European statistics. Contact details for this support network can be found on the Eurostat website at: http://ec.europa.eu/eurostat/. All Eurostat publications can be ordered via the ‘EU Bookshop’: http://bookshop.europa.eu/. Manuscript completed on: 08.12.2011 Data extracted on: 30.11.2011 ISSN 1977-0316 Catalogue number:KS-SF-11-066-EN-N © European Union, 2011