09 03 17 Web 2.0 Weekly
•
1 recomendación•412 vistas

Video & Gaming companies lead March Web 2.0 financing activity - $42.5m for 5 companies

Recomendados
Más contenido relacionado
La actualidad más candente
La actualidad más candente (20)
Destacado
Similar a 09 03 17 Web 2.0 Weekly
Similar a 09 03 17 Web 2.0 Weekly (20)
Más de David Shore
Más de David Shore (11)
Último
Último (20)
09 03 17 Web 2.0 Weekly
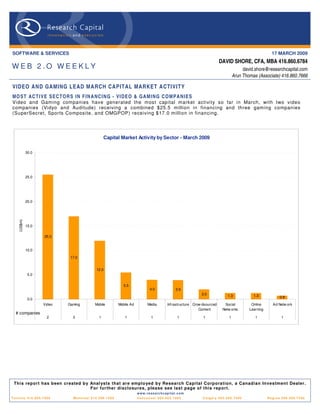
- 1. SOFTWARE & SERVICES 17 MARCH 2009 DAVID SHORE, CFA, MBA 416.860.6784 WEB 2.O WEEKLY david.shore@researchcapital.com Arun Thomas (Associate) 416.860.7666 VIDEO AND GAMING LEAD MARCH CAPITAL MARKET ACTIVITY MO ST AC T I V E S EC T O R S IN F IN A NC IN G - VI DE O & GAM IN G CO M PA NI E S Video and Gaming companies have generated the most capital market activity so far in March, with two video companies (Vidyo and Auditude) receiving a combined $25.5 million in financing and three gaming companies (SuperSecret, Sports Composite, and OMGPOP) receiving $17.0 million in financing. Capital Market Activity by Sector - March 2009 30.0 25.0 20.0 (US$m) 15.0 25.5 10.0 17.0 12.0 5.0 5.5 4.0 3.9 2.0 1.3 1.3 0.8 0.0 Video Gaming Mobile Mobile Ad Media Infrastructure Crow dsourced Social Online Ad Netw ork Content Netw orks Learning # companies 2 3 1 1 1 1 1 1 1 1 This report has been created b y Anal ysts that are emplo yed b y Research Capital Corporation, a Canadian Investment Dealer. For further disclosures, please see last page of this report. w w w . r e s e a rc h c a p i t a l . c o m T o ro n t o 4 1 6 . 8 6 0 . 7 6 0 0 Montreal 514.399.1500 Vancouver 604.662.1800 Calgary 403.265.7400 Regina 306.566.7550
- 2. Page 2 THE WEB 2.0 UNIVERSE Eighty-nine public Web 2.0 companies identified: Our W eb 2.0 universe contains 89 companies, with a combined market cap of $31.3 billion. These include a wide variety of companies, including MMOG (Massive Multi-Player Online Gaming) companies, social networking software companies, media sharing companies, and social lending companies. See below for a summary of the full universe (Figure 1). The average market cap for the group is ~$350 million (but a median of only $24 million), with average trailing revenue of $130 million (median $40 million). The companies are also generally profitable, with a median EBITDA margin of 13.3%. On a valuation basis, the overall average is 3.9x trailing revenue (median 1.0x) and 8.8x trailing EBITDA (median 6.0x). Twelve of the companies have more than 500 employees. C omparable C ompany Analys is > Web 2.0 Trading C urrent US D M ark et US D L T M Total US D L TM T otal E B IT DA T E V /L T M TE V /L T M C ompany Na me L TM as of Ti cker E xc hange C urrency HQ Price C ap ($m) R ev ($m ) E B IT DA ($m ) % R evenue E B I TDA E mployees Accelerize N ew Media, I nc. 9 /3 0/20 08 AC LZ OTCB B US D United S tates 0. 23 6. 2 3. 2 ( 4. 7) NM 3. 3 x - 20 Actoz S oft C o. , Ltd. 9 /3 0/20 08 A05 279 0 K OS E KR W S outh K orea 10 ,8 50 6 6. 6 50. 9 9. 3 18.3 % 0. 8 x 4 .5 x NA AQ Inte ractive, Inc. 1 2/31 /200 8 3 838 TS E JP Y J a pan 3 3, 40 0. 00 1 8. 5 61. 4 4. 9 8. 0% - - NA As s ociated Me dia Holdings Inc. 6 /3 0/20 07 AS MH OTCP K US D United S tates 0 0. 1 0. 1 ( 2. 3) NM 8. 0 x - 3 Bi gs tring C orp. 9 /3 0/20 08 BSG C OTCB B US D United S tates 0. 01 0. 7 0. 1 ( 2. 1) NM 2 8. 9x - 8 Be ta wave C orporation 9 /3 0/20 08 B W AV OTCB B US D United S tates 0 5. 3 6. 3 (11 .0 ) NM 2. 5 x - 41 Be yond C omme rce, Inc. 9 /3 0/20 08 B YO C OTCB B US D United S tates 0. 57 2 3. 3 1. 1 ( 7. 7) -9 8. 9% 2 4. 1x - 25 Br ight T hi ngs plc 9 /3 0/20 08 AIM: B GT A IM G BP United K ingdom 0 2. 9 0. 2 ( 1. 6) 47.1 % 1 2. 0x - 9 Br oadW ebA s ia I nc. 9 /3 0/20 08 B W BA OTCP K US D United S tates 0. 51 4 3. 3 0. 0 ( 4. 6) NM - - 46 C DC C orp. 9 /3 0/20 08 C HI N. A Na s daqG S US D Hong K ong 1 9 8. 2 428 . 1 18 .8 16.0 % 0. 4 x 8 .2 x 3 ,1 25 C hina G ateway C orpora tion 9 /3 0/20 08 CG W Y OTCB B US D United S tates 0. 00 0. 0 6. 7 ( 6. 6) 13.3 % 0. 0 x - 37 C hines e G amer International 9 /3 0/20 08 G T S M: 3 083 G TS M TWD T a iwan 1 51 373 . 0 37. 4 17 .6 NM 8. 5 x 18. 0x NA C ornerW orld C orporation 1 0/31 /200 8 CW R L OTCB B US D United S tates 0. 14 6. 6 0. 6 NM NM 1 3. 1x - NA DAD A S pA 9 /3 0/20 08 C M: DA CM E UR Italy 5 9 7. 6 220 . 4 35 .2 NM 0. 6 x 4 .0 x 5 74 DXN Hol dings Bhd 1 1/30 /200 8 DX N K LS E MY R Ma lays ia 0. 28 1 7. 8 75. 9 10 .1 NM 0. 5 x 3 .7 x NA Dibz International, Inc. NA DI BZ OTCP K US D United S tates 0 0. 0 NA NM -0 .3 % - - NA Digita lP os t Interactive, Inc. 9 /3 0/20 08 DG LP OTCB B US D United S tates 0. 00 0. 3 0. 4 ( 3. 3) NM 2. 8 x - 11 Digita lT own, I nc. 1 1/30 /200 8 DG T W OTCB B US D United S tates 3 8 1. 5 NM ( 2. 5) 18.3 % - - 3 Dolphin Digita l Me dia , Inc. NA DP DM OTCB B US D United S tates 0. 49 2 3. 8 NA NM NM - - 6 E olith C o. Ltd. 1 2/31 /200 7 A04 106 0 K OS E KR W S outh K orea 5 30 1 7. 2 17. 4 ( 0. 0) -6 0. 6% 1. 0 x - NA E xtensi ons, Inc. 9 /3 0/20 08 E XT I OTCP K US D United S tates 0. 15 1 4. 2 NM NM 16.9 % - - 2 F ina ncia l Me dia Group, Inc. 1 1/30 /200 8 F NG P OTCB B US D United S tates 0 0. 9 6. 8 1. 2 26.4 % 0. 0 x 0 .0 x 22 F luid Mus ic C anada , I nc. 9 /3 0/20 08 T S X: F MN TS X C AD United S tates 0. 40 1 6. 5 4. 2 ( 8. 6) NM 0. 7 x - 29 F rogs te r Inte ractive P icture s A G 6 /3 0/20 08 FRG XT R A E UR G er many 6 1 7. 0 5. 2 ( 3. 2) 61.9 % 3. 1 x - NA Ga mania Digital E nterta inme nt C o. , L td. 9 /3 0/20 08 6 180 G TS M TWD T a iwan 2 9. 60 130 . 6 108 . 1 18 .3 23.9 % 1. 0 x 5 .8 x NA Ga meO n C o L td. 1 2/31 /200 8 3 812 TS E JP Y J a pan 83 ,0 00 8 1. 7 75. 9 20 .1 19.2 % 0. 3 x 1 .2 x NA Ge oS entri c O yj 9 /3 0/20 08 G E O 1V HL S E E UR F inland 0. 03 2 4. 3 5. 3 (12 .3 ) 36.0 % 3. 6 x - 92 Gi ant Inte ractive G roup, Inc. 1 2/31 /200 8 GA NY S E US D C hina 7 1, 661 . 1 233 . 1 1 44. 3 14.7 % - - NA Gi gaMe dia L td. 9 /3 0/20 08 G IG M Na s daqG S US D T a iwan 5. 70 308 . 0 200 . 5 48 .0 -2 5. 6% 1. 2 x 5 .0 x 9 75 Gravity C o., Ltd 9 /3 0/20 08 GRVY Na s daqG M US D S outh K orea 1 1 7. 5 34. 1 6. 5 4. 5% - - 6 36 Gree, Inc. 6 /3 0/20 08 T S E : 3 632 TS E JP Y J a pan 5, 26 0. 00 1, 194 . 2 29. 9 10 .8 NM 3 7. 8x - NA GungHo Online E nte rtainme nt, Inc. 9 /3 0/20 08 3 765 OSE JP Y J a pan 1 11 ,1 00 129 . 3 104 . 0 15 .3 NM 1. 0 x 6 .8 x NA HanbitS oft, Inc. 9 /3 0/20 08 A04 708 0 K OS E KR W S outh K orea 3, 31 0. 00 5 0. 5 48. 3 (12 .4 ) NM 0. 7 x - NA IA C /Inte rActive C orp. 1 2/31 /200 8 IAC I Na s daqG S US D United S tates 15 2, 059 . 2 1 , 445 . 1 64 .6 37.2 % 0. 2 x 4 .8 x 3 ,2 00 IA S E ne rgy, Inc. 1 0/31 /200 8 IAS C . A OTCB B US D C a na da 0. 06 4. 2 0. 0 ( 0. 9) -1 5. 3% - - NA IdeaE dge, Inc. 1 2/31 /200 8 O T C B B: ID AE OTCB B US D United S tates 0 1 6. 9 0. 0 ( 4. 6) 7. 6% - - NA is ee media Inc. 9 /3 0/20 08 IE E T S XV C AD C a na da 0. 08 3. 2 1. 1 ( 4. 3) 33.8 % 0. 6 x - NA J umbuck E ntertainme nt P ty Ltd. 1 2/31 /200 8 AS X :J MB ASX A UD Aus tra lia 0 1 4. 8 11. 9 4. 4 -4 2. 5% 0. 9 x 2 .4 x 72 J umpT V I nc. 6 /3 0/20 08 T S X: J T V TS X C AD C a na da 0. 40 3 5. 8 11. 5 ( 1. 8) -1 0. 1% 3. 9 x - NA K a boos e I nc. 9 /3 0/20 08 T S X: K AB TS X C AD C a na da 0 3 8. 6 58. 4 4. 4 -3 .7 % 0. 8 x 10. 2x NA K i ngs oft C o. Ltd. 9 /3 0/20 08 3 888 S EHK HK D C hina 2. 72 376 . 7 106 . 7 36 .0 NM 2. 7 x 8 .0 x 1 ,6 60 Lingo Me dia C orpora tion 9 /3 0/20 08 T S XV :L M T S XV C AD C a na da 1 9. 1 3. 2 ( 1. 4) 38.0 % 3. 1 x - NA Live World I nc. 9 /3 0/20 08 L VW D OTCP K US D United S tates 0. 20 6. 2 11. 7 ( 1. 2) 16.0 % 0. 4 x - 73 LookS mart, Ltd. 9 /3 0/20 08 L OO K Na s daqG M US D United S tates 1 1 7. 4 69. 5 ( 2. 6) NM - - 93 Magnitude Informa ti on S ys tems I nc. 9 /3 0/20 08 MA GY OTCB B US D United S tates 0. 02 7. 9 0. 1 ( 3. 2) NM - - 13 Mixi, I nc. 1 2/31 /200 8 2 121 TS E JP Y J a pan 3 38 ,0 00 526 . 5 119 . 4 45 .4 26.9 % 3. 5 x 9 .3 x NA Mode rn T i mes Gr oup Mtg A B 1 2/31 /200 8 MT G B OM SE K S weden 12 9. 50 1, 009 . 8 1 , 558 . 2 2 49. 1 48.6 % 1. 0 x 6 .0 x NA Moggle , Inc 1 2/31 /200 8 MMO G OTCB B US D United S tates 2 7 2. 6 NM ( 1. 1) 65.0 % - - 3 MOK O. mobi L imited 1 2/31 /200 8 MK B ASX A UD Aus tra lia 0. 06 3. 2 1. 0 ( 2. 0) NM 2. 4 x - NA NE O W IZ G ame s C orpora tion 1 2/31 /200 7 A09 566 0 K OS E KR W S outh K orea 38 ,8 50 260 . 0 125 . 6 33 .7 30.8 % 2. 0 x 7 .5 x NA NetDra gon We bS oft, Inc. 9 /3 0/20 08 7 77 S EHK HK D C hina 3. 40 231 . 8 95. 2 46 .3 17.6 % 0. 6 x 1 .3 x 1 ,4 82 Netea s e. com Inc. 1 2/31 /200 8 NT E S Na s daqG S US D C hina 23 2, 774 . 8 450 . 8 2 93. 1 25.3 % - - NA NeXplore C orporation 9 /3 0/20 07 NX P C OTCP K US D United S tates 0. 94 5 2. 4 NM ( 4. 9) -5 .1 % - - 19 Ngi G roup Inc. 1 2/31 /200 8 2 497 TS E JP Y J a pan 18 ,6 40 2 3. 4 100 . 1 30 .8 54.1 % - - NA Northgate T e chnologies L imited 1 2/31 /200 8 5 900 57 B SE I NR India 3 3. 35 2 2. 7 131 . 3 23 .1 -4 .9 % 0. 2 x 1 .0 x 2 86 Open T e xt C orp. 1 2/31 /200 8 OTE X Na s daqG S US D C a na da 32 1, 656 . 1 769 . 3 1 95. 0 NM 2. 3 x 9 .2 x 3 ,4 00 Openwa ve S ys tems I nc. 1 2/31 /200 8 OPW V Na s daqG S US D United S tates 0. 82 6 8. 3 199 . 6 (10 .2 ) 13.1 % - - 6 27 P e rfect W orld C o., Ltd. 1 2/31 /200 8 PWRD Na s daqG S US D C hina 13 672 . 1 210 . 1 1 13. 7 46.0 % - - NA P hotoC hannel Ne tworks Inc. 1 2/31 /200 8 T S XV :P N T S XV C AD C a na da 1. 55 4 0. 9 15. 7 ( 0. 8) 13.3 % 2. 5 x - NA Quepas a C orp. 9 /3 0/20 08 QPS A Na s daqC M US D United S tates 1 1 4. 3 0. 1 (11 .8 ) 9. 4% - - 63 OA O R B C Informa ti on S ys tems 1 2/31 /200 7 RB CI R TS US D R us s ia 0. 24 3 3. 3 136 . 8 17 .9 10.1 % 0. 0 x 0 .1 x NA S handa Intera cti ve E nte rtainment L td. 1 2/31 /200 8 S NDA Na s daqG S US D C hina 35 2, 429 . 1 521 . 7 2 39. 7 -3 4. 8% - - NA S hutterfly, I nc. 1 2/31 /200 8 S F LY Na s daqG S US D United S tates 8. 93 224 . 6 213 . 5 28 .4 -6 0. 5% 0. 6 x 4 .8 x 5 14 S K C ommunications C o. , Ltd. 1 2/31 /200 7 A06 627 0 K OS E KR W S outh K orea 7 ,7 20 221 . 1 144 . 4 13 .6 NM 1. 5 x 16. 3x NA S NA P I nter active, Inc. 9 /3 0/20 08 S T VI OTCB B US D United S tates 0. 95 1 0. 1 2. 3 0. 2 21.7 % 3. 9 x 38. 9x 5 S NM G lobal Holdings 9 /3 0/20 08 S NMN OTCP K US D United S tates 0 0. 0 2. 0 ( 0. 7) NM 1. 1 x - 33 S ocial Me dia V enure s , I nc. 1 2/31 /200 8 S MVI OTCP K US D United S tates 1. 20 0. 0 0. 1 ( 0. 1) 49.5 % 0. 1 x - NA S i te s earch C orpora tion 1 0/31 /200 8 S T PC OTCB B US D United S tates 5 4 0. 3 NM ( 0. 9) -1 2. 0% - - 15 S park Ne tworks , I nc. 1 2/31 /200 8 L OV A ME X US D United S tates 2. 34 4 8. 1 57. 3 12 .4 33.7 % 0. 8 x 3 .9 x NA S pectrumDNA, Inc. 9 /3 0/20 08 S PX A OTCB B US D United S tates 0 8. 8 0. 1 ( 2. 7) 9. 7% - - 7 T encent Holdings Ltd. 9 /3 0/20 08 7 00 S EHK HK D C hina 5 4. 40 12 ,6 13.5 903 . 2 4 47. 4 -5 0. 6% 1 5. 2x 30. 7x 6 ,0 39 T he P arent C ompany 8/2/2 008 K IDS . Q OTCP K US D United S tates 0 1. 3 112 . 0 (13 .5 ) -1 0. 4% 0. 2 x - 3 47 T he 9 Limited 1 2/31 /200 8 NC T Y Na s daqG S US D C hina 1 3. 33 357 . 5 249 . 7 84 .1 0. 4% - - NA T he S tre et.com, Inc. 1 2/31 /200 8 TS CM Na s daqG M US D United S tates 2 5 9. 5 71. 9 7. 0 23.0 % - - NA T otal S port O nl ine A S 3 /3 1/20 06 TOS O O T C NO NO K Norway 0. 04 0. 2 2. 0 ( 1. 0) -9 1. 6% 4. 6 x - 16 T ree . C om, Inc. 1 2/31 /200 8 TRE E Na s daqG M US D United S tates 4 4 2. 5 228 . 6 (23 .9 ) NM 0. 2 x - NA Unis e rve C ommunications C orp. 1 1/30 /200 8 T S XV :U S S T S XV C AD C a na da 0. 05 1. 0 23. 5 0. 1 -1 0. 1% 0. 1 x 31. 3x NA Unite d Online Inc. 1 2/31 /200 8 UNT D Na s daqG S US D United S tates 4 329 . 4 669 . 4 1 53. 9 NM 1. 0 x 4 .1 x 1 ,4 69 UOMO Medi a, Inc 1 0/31 /200 8 UO MO OTCB B US D C a na da 0. 06 5. 1 0. 5 ( 0. 4) NM 1 1. 4x - NA VO IS , I nc. 1 2/31 /200 8 V OI S OTCB B US D United S tates 0 3. 3 0. 0 ( 1. 3) NM - - 4 W ebzen Inc. 1 2/31 /200 8 W ZE N Na s daqG M US D S outh K orea 1. 62 1 9. 2 19. 8 ( 2. 0) NM - - 3 30 W izza rd S oftwa re C orporation 9 /3 0/20 08 W ZE A ME X US D United S tates 0 1 8. 1 6. 2 ( 6. 5) 38.8 % 2. 9 x - 1 10 W oozyF ly, Inc. 9 /3 0/20 08 W ZY F OTCB B US D United S tates 0. 15 2. 6 0. 0 NM 22.4 % - - 14 W orlds .com Inc. 9 /3 0/20 08 W DDD OTCB B US D United S tates 0 1 0. 0 0. 1 NM -7 .6 % - - 1 W ynds torm C orporation NA W YN D OTCB B US D United S tates 0. 12 2. 2 NA NM NM - - NA XI NG A G 9 /3 0/20 08 O 1B C XT R A E UR G er many 28 190 . 4 40. 7 15 .8 0. 0% 3. 3 x 8 .5 x 1 61 Y e dangO nline C orp. 1 2/31 /200 7 A05 277 0 K OS E KR W S outh K orea 6, 85 0. 00 7 4. 6 47. 8 10 .7 65.0 % 1. 5 x 6 .9 x NA Y nk K orea Inc. 1 2/31 /200 7 A02 377 0 K OS E KR W S outh K orea 3 ,6 40 6. 2 13. 6 ( 1. 0) -9 8. 9% 0. 5 x - NA ZipL ocal I nc. 9 /3 0/20 08 T S XV :ZIP T S XV C AD C a na da 0. 02 0. 9 2. 8 ( 3. 8) 8. 2% 0. 6 x - NA High 12 ,6 13.5 1 ,558.2 44 7. 4 65.0 % 3 7. 8x 38. 9x 6, 03 9 Low 0. 0 0. 0 -2 3. 9 -9 8. 9% 0. 0 x 0 .0 x 1 Average 351.7 132.5 28.5 7.3% 3.9x 8.8x 547 Medi an 2 4. 3 40 .7 0 .2 13.3 % 1. 0 x 6 .0 x 73 Figure 1. Web 2.0 Universe Summary Source. Capital IQ
- 3. Page 3 C A P I T A L M A R K E T S A C T I V I T Y (M & A A N D F I N A N C I N G ) Please note that we have removed a few of the charts from the W eb 2.0 Weekly that are better looked at on a monthly basis, as opposed to weekly. March activity on pace with busy February: At the halfway point of March, there have been 13 financings announced (total $73.2 million, average $5.6 million) compared to 25 financings announced in February, totalling $185.5 million, or $7.4 million on average (Figure 2). The average value for February was above the $6.8 million average for January, with four financings over $15 million in February (Twitter, Synthasite, Tremor Media, and Offerpal Media) vs. no deals over $15 million in January. Financing Activity Last Three Months 250.0 8.0 7.0 200.0 6.0 5.0 150.0 (US$m) (US$m) 4.0 100.0 3.0 2.0 50.0 1.0 0.0 0.0 Jan-09 Feb-09 Mar-09 Total Average Figure 2. Financings, Last Three Months Source. Company reports Vidyo largest deal in March: The largest deal thus far in March is the $15 million Series D round for Vidyo (Figure 3). For additional details, see Figures 24 and 25 (at end of note).
- 4. (US$m) 0.0 5.0 10.0 15.0 20.0 25.0 30.0 35.0 40.0 Twitter Synthasite Tremor Media Source. Company reports Aster Data Systems Vidyo Offerpal Media Imagini Yodle Emergent Game Technologies AdMob SendMe Inc. Outbrain VirtuOz Figure 3. Capital Market Activity, Last Three Months Auditude SuperSecret RatePoint companies raising $48.0 million. Nurien DECA IMVU NewsGator Go Internet Media One True Media Tvtrip Play Hard Sports SundaySky JibJab Xobni InsideView Kewego Motionbox Tongxue SocialMedia Fliqz Oodle Greystripe Wamba OMGPOP Sportsblogs Geni AboutUs Gbox TextDigger OneSpot Simulmedia FetchDog Mixpo Virtual Fairground Tynt E-Global Sports Network 7 Billion People Financing Summary - Last Three Months FamilyLink.com Tripwolf mEgo WhistleBox Sports Composite DE Hunch Mendeley Outright Tvinci Filtrbox AdultSpace MMO Life Cake Financial Myngle Hubdub Snooth CoveritLive 33Across fav.or.it BackType Identi.ca Meez Pulse Entertainment Jan-09 Mar-09 Feb-09 Page 4 14 companies raising almost $110 million (Figure 4). Social networking companies have the next highest totals, with 10 Video continues to be the most active sector: Activity over the last three months was busiest in the video sector, with
- 5. Page 5 Capital Market Activity by Sector - Last Three Months 120.0 100.0 80.0 (US$m) 60.0 109.1 40.0 48.0 42.3 42.3 20.0 35.0 26.5 25.0 22.5 20.9 15.0 12.4 12.0 11.5 11.4 10.0 9.5 6.2 5.5 4.3 4.0 3.2 2.0 1.3 0.0 Comment/Reputation Gaming Micromedia Wiki Travel RSS Microblog Mobile Media Online Learning Financial Services Infrastructure Blog Mobile Ad Search Crowdsourced Content Social Networks Virtual Goods Video Virtual World Aggregation Ad Network Analytics 14 10 7 5 1 4 2 4 2 1 3 1 2 1 1 2 3 1 1 1 2 1 1 Figure 4. Capital Market Activity, by Sector, Last Three Months Source. Company reports C A P I T A L M A R K E T S A C T I V I T Y (P R I C E P E R F O R M A N C E ) Price Performance: Our W eb 2.0 index (market-cap weighted) underperformed the NASDAQ composite index from mid 2008 until recently when it has moved higher than the NASDAQ index (Figure 5).
- 6. Page 6 Web 2.0 Index Price Performance 140 120 100 80 60 40 20 0 3/17/2008 3/31/2008 4/14/2008 4/28/2008 5/12/2008 5/26/2008 6/9/2008 6/23/2008 7/7/2008 7/21/2008 8/4/2008 8/18/2008 9/1/2008 9/15/2008 9/29/2008 10/13/2008 10/27/2008 11/10/2008 11/24/2008 12/8/2008 12/22/2008 1/5/2009 1/19/2009 2/2/2009 2/16/2009 3/2/2009 3/16/2009 ^COMP - Share Pricing Index: Web 2.0 X (Market Cap) Figure 5. Web 2.0 Price Performance Source. Capital IQ Almost all companies rise – Frogster leads: Almost all the companies in our universe had positive stock price performances over the past week (for stocks with prices greater than $1) (Figure 6), with only five companies showing negative returns on the week. Frogster Interactive (FRG-XTRA) led the group with a stellar 50.0% return over the past week. PhotoChannel Networks (PN-TSX V) had the worst return, dropping 6.1% in the week.
- 7. Page 7 1 Week P rice P erformance Frogs ter Interac tive Pic tures A G 50.0% The9 Limited 42.9% Webz en Inc . 32.8% GigaMedia Ltd. 31.6% S K Communic ations Co., Ltd. 26.4% Quepas a Corp. 25.6% S hutterf ly , Inc . 24.5% Perf ec t World Co., Ltd. 22.0% DigitalTow n, Inc . 19.0% Gamania Digital Entertainment 17.2% Tenc ent Holdings Ltd. 15.1% Ngi G roup Inc . 15.1% XING A G 14.1% S handa Interac tive 13.8% Modern Times Group Mtg A B 13.1% G ree, Inc . 12.2% Mix i, Inc . 9.7% Northgate Tec hnologies Limited 8.8% Y edangOnline Corp. 8.7% IA C/InterA c tiveCorp. 8.5% Open Tex t Corp. 8.4% Tree.Com, Inc . 8.4% Neteas e.c om Inc . 7.9% TheS treet.c om, Inc . 7.7% A Q Interac tive, Inc . 6.5% NEOWIZ Games Corporation 6.3% Y nk K orea Inc . 5.2% LookS mart, Ltd. 5.2% Chines e Gamer International 4.9% HanbitS of t, Inc . 4.6% G iant Interac tive G roup, Inc . 4.6% K ings of t Co. Ltd. 3.8% A c toz S of t Co., Ltd. 3.3% G ameOn Co Ltd. 2.5% NetDragon WebS of t, Inc . 1.5% United Online Inc . 1.3% S park Netw orks , Inc . 0.4% Moggle, Inc 0.0% S oc ial Media V enures , Inc . -4.0% Eolith Co. Ltd. -4.5% DA DA S pA -4.5% G ungHo Online Entertainment, -4.9% PhotoChannel Netw orks Inc . -6.1% -10.0% 0.0% 10.0% 20.0% 30.0% 40.0% 50.0% 60.0% Figure 6. 1-Week Price Performance Source. Capital IQ
- 8. Page 8 INDUSTRY NEWS (PARTNERSHIPS, FINANCIAL RESULTS, NEW PRODUCTS) K ey Developments C ompany Headline Notes T ree .C om, Inc. (Na s daqG M: T R E E ) T ree. C om Inc. P rovide s E a rnings G u ida nce fo r the First T re e.C om I nc. provided e arnings guidance for the first qua rter of 2009 . F or the qu arter, the company e xpe cts E B IT DA and net inco me (los s ) Q ua rte r of 2 009 to be roughly in-line with or s lightly better tha n E B I T DA a nd net income (los s) f or the fourth qua rter of 2 008. B . B raun to De plo y C onte nt M anagement C ompany -wide O pen T e xt C orp. a nnou nced that internationa l medical equ ipment and s ervices provide r, B . B rau n Me ls ungen AG , will de plo y a company - O pen T ext C orp. U s ing O pe n T ex t E C M S uite wide E C M s olution bas ed o n the O pen T ex t E C M S uite. The plan re pres ents a majo r expa ns io n of the co mpany 's us e o f E C M from a ro und (Nas da qGS : O TE X ) 2,00 0 us ers currently, to all us ers globa lly when the pro ject is fu lly deploy ed in a bout three ye ars. T he k ey go al of the pro ject is to s tre amline the ma nage ment of regulate d do cu me nts acros s the entire life cycle and to me et s trict, cons tantly changing lega l requirements in ma ny different parts o f the world concurrently. B . B rau n als o e xpects to be nefit from more e ffective ex change of inf ormation throu gh colla boration as well a s efficient and contro lled a cces s to all pro ce ss -rela ted co mpa ny documents. C DC Mulls A cquis itions C DC C o rporation a nnou nced today that a n af filia te o f the company ha s clos ed the purchas e o f the C ompa ny’s 3.7 5% S enior E xchangeable C DC C orp. (Na s daqG S : C HIN.A) C onvertible Notes Due 2011 with one Note ho lde r that was announced on March 5, 200 9, f or cas h, as we ll as s igned and clos ed, today , an additiona l purchas e of the entire remaining po rtion of the holdings of N otes f rom a nother Note holder. P eter Y ip, C E O o f C DC sa id: “W ith ou r stro ng bala nce s hee t and pres ent operational pe rf ormance , we pla n to res ume purs uing s trategic and oppo rtunistic acqu is itions for expanding our s oftware platfo rm, su ch as our recently -announced C ate goric tra ns actio n, a s we ll as increas ing ou r mark et share in C hina for our MM O online ga me s bus ines s. W e remain confident of ou r glo bal bus ines s which is reinfo rced by ou r s trong pres ence in C hina. quot; LiveW orld Inc. R epo rts U naudite d E arnings R es ults fo r LiveW orld Inc. repo rted u naudite d ea rnings re su lts f or the fourth qua rter and full y ea r ende d Decembe r 31, 2 008 . F or the qu arter, the L ive W orld Inc. (O T C PK : L V W D) the F ou rth Q uarte r a nd F u ll Y ear E nded December 3 1, co mpany reporte d ne t income of $165 ,000 , or $ 0.01 per ba s ic and $0 .00 per dilu ted s ha re on tota l revenu e of $3, 003, 000 co mpa re d to net 20 08 ; P rovides R evenue G uidance for the F irs t Qu arter lo ss of $58 4,00 0, o r $0.0 2 pe r bas ic a nd $ 0.02 per dilu ted share on total re venue o f $2 ,977 ,000 for the s ame period la st ye ar. T he co mpany of 200 9 re ported inco me bef ore tax of $11 0,00 0 compared to los s bef ore ta x of $56 5,00 0 fo r the s ame perio d las t y ear. T he company repo rted net ca sh provided by o perating activities o f $2 8,00 0 compared to negative net cas h pro vided by ope ra ting activities of $283 ,000 for the s ame perio d las t y ear. T he company reported adjus ted E B IT DA of $400 ,000 compared to ne gative adjus ted E B IT DA o f $37 0,00 0 fo r the sa me perio d las t y ear. F o r the yea r, the co mpany reporte d ne t los s of $ 1,07 8,00 0, or $ 0.03 per bas ic and $0 .03 per dilu ted share on tota l revenue of $ 11,7 61,0 00 compa re d to net los s of $2, 373, 000, or $0. 08 per bas ic and $0.0 8 pe r dilute d s hare on total revenue of $ 10,8 63,0 00 f or the sa me period las t y ear. T he company reported nega tive net cas h provide d by operating a ctivities of $55 8,00 0 compared to negative net cas h p W izz ard S of tware A nno unces Newe st R eleas e of A T &T W iz z ard S oftwa re C orporation announced the availability of V e rs ion 4 .2 o f A T &T Na tural V oices T e xt-to-S peech (T T S ) for W indo ws. T he W izzard S oftware C orpora ti on Na tural V o ices T ex t to S peech so ftware's new s treamline d architecture mak es it e as ier a nd f as ter for a pplication and web develo pers to deploy high performa nce s pee ch (AME X: W ZE ) so lu tio ns . T his new vers ion fea tures twe nty vo ices in eight la ngua ges , including the recent addition of I talian. W izz ard continues to mak e AT & T technology ve ry cos t e ffective for a pplications develo pers and is plea se d to add this new a nd improve d W indo ws vers io n to co mplement the 200 8 releas e o f 4. 2 fo r Linux. AT & T Natural V oices is widely ack nowledge d in the indus try as the mos t na tural-s ou nding sy nthes iz ed speech s y stem in the world, and W izz ard of fers a varie ty of licensing mo dels to De ve lopers, Integrators and B us ines s C lients . B y continu ing to improve Natural V o ices , A T &T is reinforcing its res olve to provide world-clas s s peech sy nthes is to mainstre am ma rk ets through W izz ard S of tware. P hotoC hannel Network s S igns Lice ns e A greement with P hotoC hanne l N etwork s Inc. a nnou nced that it has s igned a licens e agreement with P si Digital S olu tio ns Limited out of the U nite d K ingdom. P hotoC ha nne l Network s Inc . P s i Digital S olu tio ns Limited U nde r the a greement P N I ha s gra nted an exclus ive right to fu rther develop, ma rk et and s ub-licens e the I R IS S red-e ye re mo val te chnology . (T S X V: P N) P NI s hall receive roy alty payments and s hall mainta in the right to u se within its pla tform. R on Ma or, the origina l inventor of the technology , will head the R &D effo rts to fu rther de ve lop and improve this te chnology . P hotoC hannel Network s Inc. (T S XV : P N) completed the P hotoC hanne l N etwork s Inc. (T S XV : P N) signe d an agree me nt to acquire W o rk s Media, Ltd. fo r C AD 5.3 millio n on F ebruary 25, 200 9. T he P hotoC ha nne l Network s Inc . acqu is itio n of W ork sM edia, L td. purchas e price inclu des a cas h pay me nt o f C A D 2. 1 million to be pa id in 13 e qual monthly ins tallments, is s uance of 0 .75 millio n s hares in 3 (T S X V: P N); W orks Me dia, L td. equa l ins ta llments and is s uance of 0.9 millio n s hares o ver next 3 y ears if annual pe rfo rmance targe ts of W orks Me dia are met. T he trans action is s ubject to appro val by the T S X V enture E xchange. Fo rmal clo sing of the tra ns actio n is expe cted to occur upon receipt of this acce ptance of the agreement by T S X V entu re E x change. P hotoC ha nnel Networks I nc. (T S X V : P N) completed the acquis ition of W ork sM edia, L td. on M arch 11, 200 9. Ne teas e Launches C hines e I nterne t S tock Index Nete as e.com Inc. on M arch 12 officially launched th e inde x fo r C hines e Internet s tock s, which is aimed a t ga uging the o verall performance of Netea s e.c om Inc. publicly-traded C hines e Internet co mpanies and the ir s tock s. T he index is calcu lated bas ed o n the marke t valu e of 14 publicly-traded (Nas da qGS : NT E S ) C hines e I nterne t companies traded in Ho ng K ong and the U S , with the benchmark se ttling at 1,00 0 s tarting fro m March 10 . T he 14 co mpanies include P erfect W o rld, Alibaba, Nete as e, G iant Inte ra ctive, V is ionC hina , K ongz ho ng.com, C trip, T encent, S ina , S ouhu, S handa Netwo rk ing, T he9, 51job.com, a nd B aidu. co m. T heir bus ines se s are covering Internet se arch, online game, ne ws portal, o nline re cruitment, B 2 B , and so on. T he index is des igned to re fle ct the mo ve ment of C hina's I nterne t economy and the attitude of the capita l mark et towards the Inte rnet mark et. It can give jou rnalis ts , analy s ts , and inve stors birds ' eye view o f the Internet indus try in C hina. S handa to La unch O pe n B eta T es t for 'S uper S tar' S handa Intera ctive E nte rtainme nt L td. a nnou nced that it will k ick o ff o pen beta tes t f or 'S uper S tar', one of its multimedia o nline role -play ing S handa Interactive E ntertainment games in mid April. T he game is a comprehe ns ive mus ic z one combining s ix s ys tems s uch as s inging, friend mak ing, competition and so on. L td. (Nas da qGS : S N DA) Ne tDragon W ebso ft Inc. R eports E a rnings R es ults for the NetDragon W ebS oft Inc. a nnou nced its annual res ults for the fo urth quarter and y ear ended December 31 , 20 08. F or the quarte r, the NetDragon W ebS oft, Inc. F ou rth Q uarte r and Y ea r E nded D ecember 31, 200 8 co mpany reporte d prof it attributable to s ha re holders of R MB 73. 2 million on revenu e of R MB 13 6.5 millio n against profit a ttribu table to (S E HK : 777) shareholde rs of R MB 50 .9 million on re venue o f R M B 1 36.6 million f or the third qua rter of 2008 . F or the y ear e nded December 3 1, 2 008, the co mpany reporte d prof it attributable to s ha re holders of R MB 239 .4 million or ba sic earnings per s hare o f R MB 44 .49 ce nts on reve nue of R MB 596 .0 million. Ne tDragon S eek s Acqu is itions NetDragon W ebs oft Inc. a nnou nced its annual res ults for the y ear e nded 31 December 20 08. D uring the ye ar under review, re venue o f the NetDragon W ebS oft, Inc. G rou p amou nted to approx imate ly R MB 59 6.0 millio n, while revenu e for the f ourth quarter o f 20 08 wa s a pprox imate ly R MB 13 6.5 millio n, (S E HK : 777) ma intaining at a s tea dy level from approxima tely R MB 136 .6 million for the third quarter of 200 8. G ros s profit was a pprox imate ly R MB 52 7.9 millio n fo r the full y ear a nd R M B 118. 1 million for the fou rth qu arter of 2008 . Mr. Liu Dejia n, C hairman and E x ecutive Directo r o f Ne tDragon, sa id, “T o fu rther s trengthen our pres ence else where, we will co ntinue to e nhance our o vers eas dis tribution cha nnels and identify s trategic partne rs hip o pportu nities in o ve rs ea s mark ets in the fu ture. G o ing forward, we will continu e to lay the fo unda tio ns for long-term s ucces s and crea te value in a challe nging bus ine ss e nvironment. W ith a range of new a nd f un o nline games in the pipeline, I am confident the G ro up will co ntinue to mak e progres s and achieve s us tainable gro wth in the fu ture.quot;
- 9. Page 9 S NA P I nteractive Annou nces C hange o f Hea d Q uarte rs S NA P Interactive, Inc. annou nced that in a n ef fort to cons olidate operations and enable pending growth, it has s igned a three-ye ar le as e on S NAP Interactive , Inc . a ne w off ice location in New Y ork C ity. T he leas e is ef fective April 1 , 20 09. T he new S NAP he adqu arters is a 3,4 00 s qu are foo t s pace in (O TC B B : S T V I) Midtown Manhatta n, o ne block from M adiso n S quare G a rden. T he S tree t.com Inc. Announce s Mana gement C hanges T heS treet. co m Inc. announce d that T homa s J . C larke , J r. , its C hief E xe cu tive O f ficer and a Directo r f or the pas t ten y ea rs , is leaving the T heS treet.com , Inc. co mpany . T he company als o announce d that M r. O tte, who has s erved as a Director o f the company s ince 200 1 and ha s previou sly se rved (Nas da qGM: T S C M) as the C ha irma n of the company 's A udit C ommittee, will a ss ume the role o f interim C hie f E xecutive O fficer of the co mpany . Mr. Otte will re ma in as interim C E O until a perma nent replaceme nt is named. Mr. O tte is a fo unding partne r of M onte fio re P a rtners , a venture capita l inves tment fund mana gement firm. G igaMedia L td. (Nas daqG S : GIGM) G igaMe dia Ltd. P ro vides E arnings G uidance for the G iga Media L td. provided earnings guidance f or the fou rth qu arter of 2008 . T he co mpany confirme d fo urth-quarte r 2008 net earnings we re in- F ou rth Q uarte r of 20 08 line with ma rk et expectations . S pectrumDN A, Inc. (O T C B B : S PX A) S pectrumDNA Inc. P a rtners with Mark etingP rofs .com to S pectrumD NA I nc. announce d a stra tegic partnership with Mark etingP rofs .com, and their plans to launch an exclus ive Ma rk eting La unch M ark eting A ddictio nary Addictiona ry , a ttracting more than 300, 000 mark eting profes s io nals to the highly engaging word play engine . S pectrumDNA 's produ ct, T he Addictiona ry , is a highly flexible a nd progra mmable engine of e ngageme nt (or E ngine t) with cons tantly evolving features and functions that ca n be eas ily conf igu re d and re-branded-for us e by any aff inity grou p, and by a ny mark ete r loo king to capture-and-nurture their community . T he A ddictionary is des igned to incre as e traf fic, e xte nd a udience e ngagement and deliver lo ng-term R O I through earne d media. Mark etingP rofs is an L A-bas ed media property offering a ctio nable k no w-ho w throu gh a range of o n-and offline ef forts to help bus ine ss es ma rk et the ir produ cts and se rvice s both smarte r a nd bette r. Figure 7. Key Developments Source. Capital IQ VALUATION MMOG companies lead market-cap charts: Eight companies in our Web 2.0 universe top US$1 billion in market capitalization (Figure 8). Sixty-seven of the 89 companies have market caps under US$100 million, with 29 under $10 million. Online gaming companies dominate the top of the list with four of the top five by market cap.
- 10. Page 10 Market C ap (US D m) Tencent Holdings Ltd. Neteas e.c om Inc. 2774.8 2429.1 S handa Interactive Entertainment Ltd. IA C/InterA ctiveCorp. 2059.2 G iant Interac tive G roup, Inc. 1661.1 Open Tex t Corp. 1656.1 Gree, Inc. 1194.2 1009.8 Modern Times G roup Mtg A B Perf ect World Co. , Ltd. 672.1 Mix i, Inc. 526. 5 K ings oft Co. Ltd. 376.7 Chines e Gamer International 373.0 The9 L imited 357.5 United Online Inc. 329.4 308.0 G igaMedia Ltd. NEOWIZ Games Corporation 260.0 231. 8 NetDra gon WebS of t, Inc. S hutterf ly , Inc. 224.6 S K Communica tions Co., Ltd. 221.1 XING A G 190.4 Gamania Digital Entertainment Co. , Ltd. 130.6 129.3 G ungHo Online Entertainment, Inc. CDC Corp. 98.2 97. 6 DA DA S pA G ameOn Co Ltd. 81.7 DigitalTow n, Inc. 81.5 Y edangOnline Corp. 74.6 Moggle, Inc 72.6 68.3 Openw ave S y s tems Inc. A ctoz S oft Co. , Ltd. 66.6 59.5 TheS treet.c om, Inc. NeXplore Corporation 52.4 HanbitS of t, Inc. 50.5 S park Netw orks , Inc. 48.1 B roadWebA s ia Inc. 43.3 42.5 Tree.Com, Inc. PhotoChannel Netw orks Inc. 40.9 40.3 S ites earch Corporation K a boos e Inc. 38.6 J umpTV Inc. 35.8 OA O R B C Inf ormation S y s tems 33.3 GeoS entric Oy j 24.3 23.8 Dolphin Digital Media, Inc. Ngi Group Inc. 23.4 B ey ond Commerce, Inc. 23.3 Northga te Technologies Limited 22.7 Webz en Inc. 19.2 18.5 A Q Interactive, Inc. Wiz z ard S of tw are Corporation 18.1 17.8 DXN Holdings B hd G ravity Co., Ltd 17.5 LookS mart, Ltd. 17.4 Eolith Co. Ltd. 17.2 Frogs ter Interactive Pictures A G 17.0 16.9 Idea Edge, Inc. Fluid Mus ic Canada, Inc. 16.5 14.8 J umbuc k Entertainment Pty Ltd. Quepas a Corp. 14.3 Ex tens ions , Inc. 14.2 S NA P Interactive, Inc. 10.1 Worlds . com Inc. 10.0 9.1 Lingo Media Corporation S pectrumDNA , Inc. 8.8 7.9 Magnitude Inf ormation S y s tems Inc. CornerWorld Corporation 6.6 Y nk K orea Inc. 6.2 LiveWorld Inc. 6.2 A cc eleriz e New Media, Inc. 6.2 5.3 B etaw ave Corporation UOMO Media, Inc 5.1 4.2 IA S Energy , Inc. V OIS , Inc. 3.3 is eemedia Inc. 3.2 MOK O.mobi Limited 3.2 B right Things plc 2.9 2.6 Wooz y Fly , Inc. Wy nds torm Corporation 2.2 1.3 The Parent Company Unis erve Communications Corp. 1.0 Z ipL ocal Inc. 0.9 Financia l Media Group, Inc. 0.9 B igs tring Corp. 0.7 0.3 DigitalPos t Interac tive, Inc. Total S port Online A S 0.2 0.1 A s s ociated Media Holdings Inc. China G atew ay Corporation 0.0 S ocial Media V enures , Inc. 0.0 Dibz International, Inc. 0.0 S NM G lobal Holdings 0.0 0 500 1,000 1,500 2, 000 2,500 3,000 3,500 4, 000 Figure 8. Market Cap Ranking Source. Capital IQ TEV/Revenue (LTM) averages 3.9x: The overall average TEV/Revenue (LTM) multiple for our group is 3.9x – up from 3.8x last week (Figure 14). However, this is skewed by Gree (3633-TSE) at 37.8x and Bigstring (BSGC-OTCBB) at 28.9x. The median is only 1.0x. Note that we exclude multiples greater than 50x. Thirty-two of the companies have multiples under 1.5x.